. 2024 Aug 14;10(16):e36235.
doi: 10.1016/j.heliyon.2024.e36235. eCollection 2024 Aug 30.

Vasculogenic mimicry-related gene prognostic index for predicting prognosis, immune microenvironment in clear cell renal cell carcinoma

Affiliations

Vasculogenic mimicry-related gene prognostic index for predicting prognosis, immune microenvironment in clear cell renal cell carcinoma

Junyong Ou et al. Heliyon. .

Abstract

Background: Clear cell renal cell carcinoma (ccRCC) is a highly aggressive cancer associated with higher death rates. However, traditional anti-angiogenic therapies have limited effectiveness due to drug resistance. Vascular mimicry (VM) provides a different way for tumors to develop blood vessels without relying on endothelial cells or angiogenesis. However, the intricate mechanisms and interplay between it and the immune microenvironment in ccRCC remain unclear.

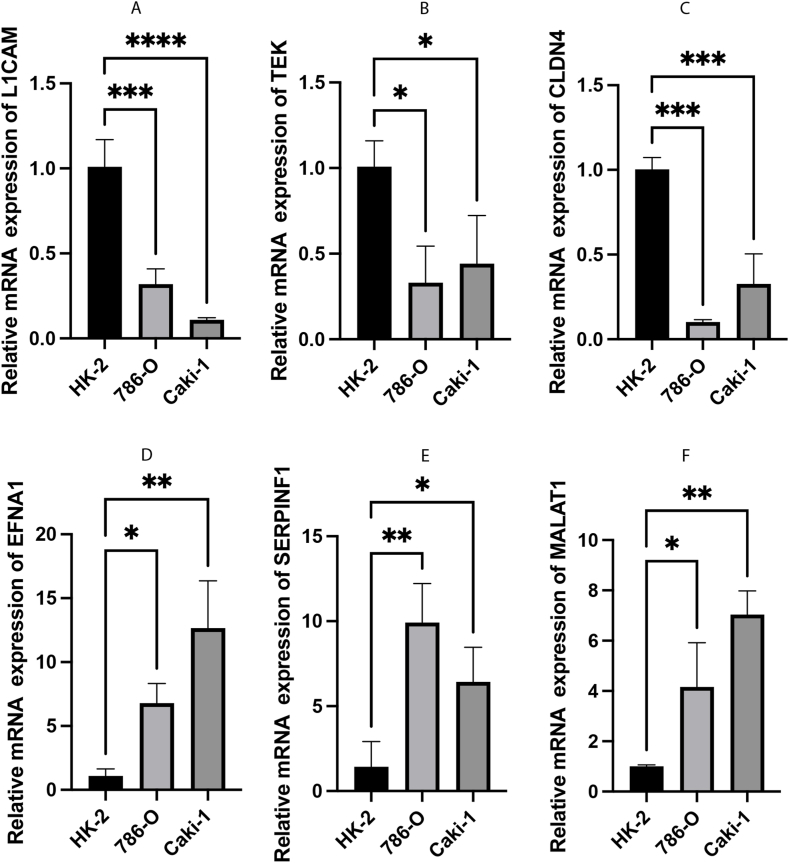
Methods: A PubMed and GeneCards literature review was conducted to identify VM-related genes (VMRGs). VMRGs expression profiles were obtained from The Cancer Genome Atlas (TCGA) and Gene Expression Omnibus (GEO), developing a novel VM risk score model and nomogram for ccRCC. The EBI ArrayExpress database (the validation set) was obtained to validate the prognostic model. The relationship between VMRGs risk score clinical characteristics and immune infiltration was investigated. Finally, the expression of six model VMRGs was validated using single-cell analysis, GEPIA, Human Protein Atlas (HPA), and quantitative Real-time PCR (qRT-PCR).

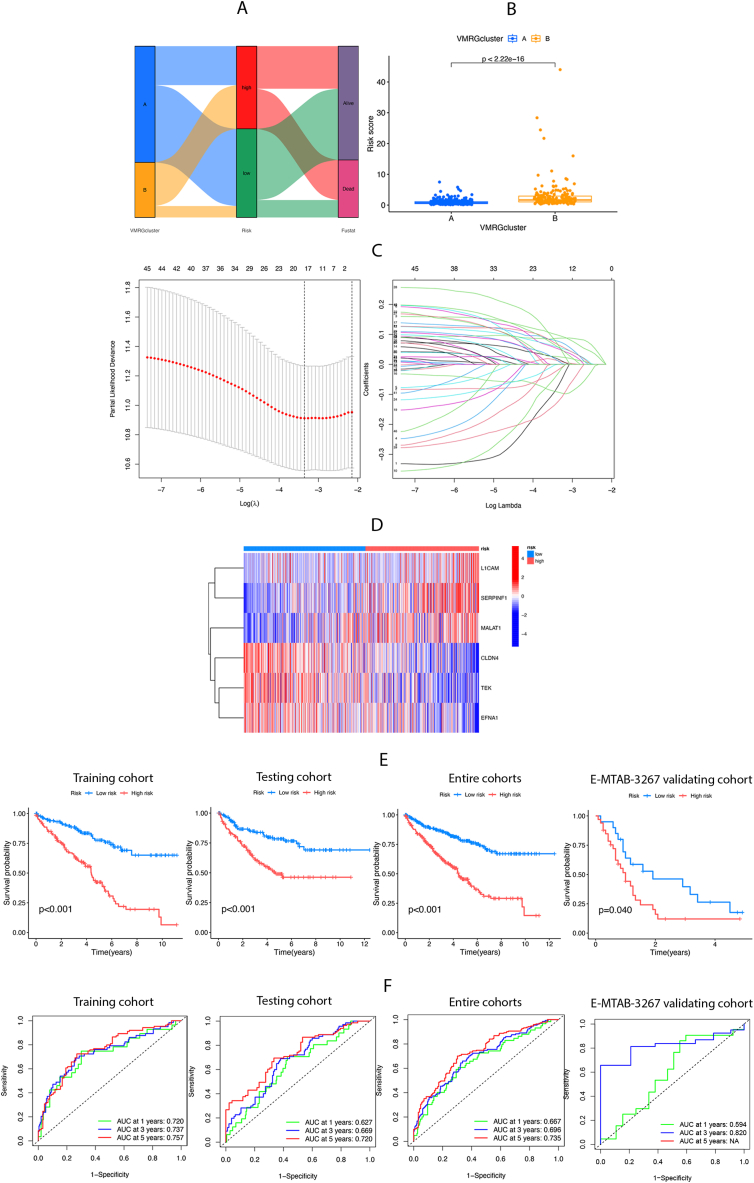
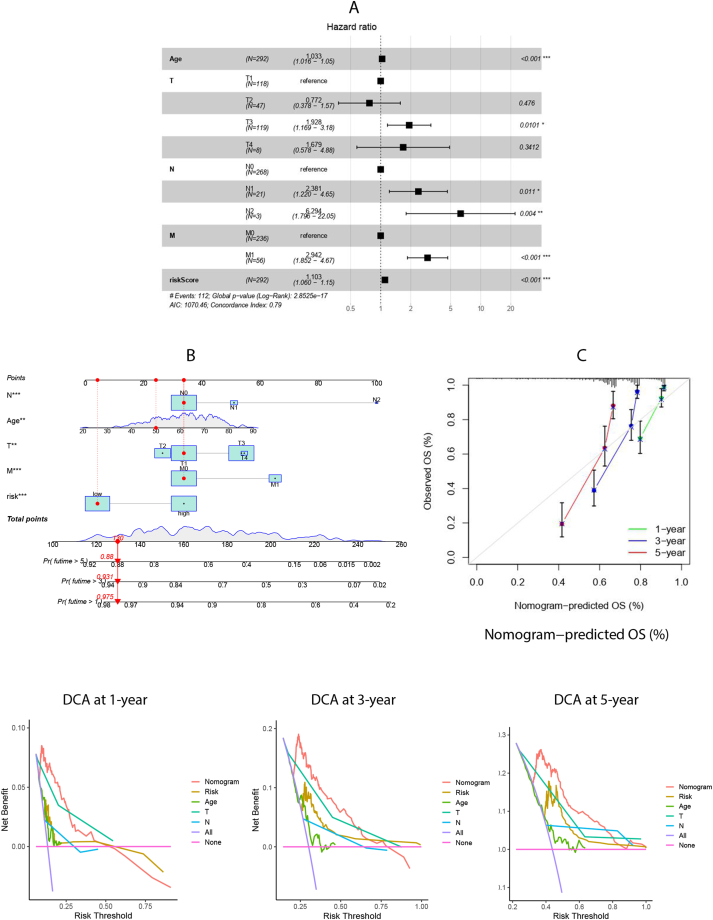
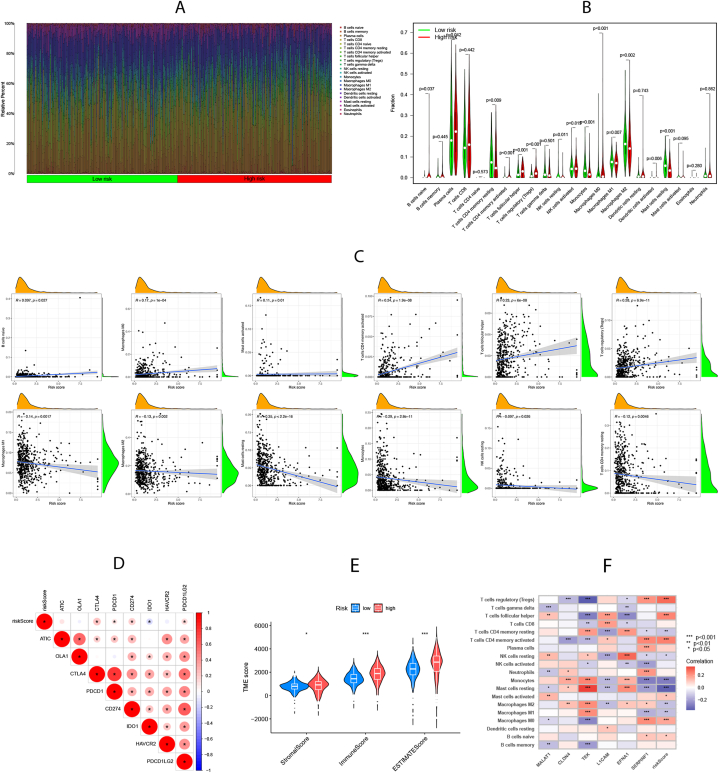
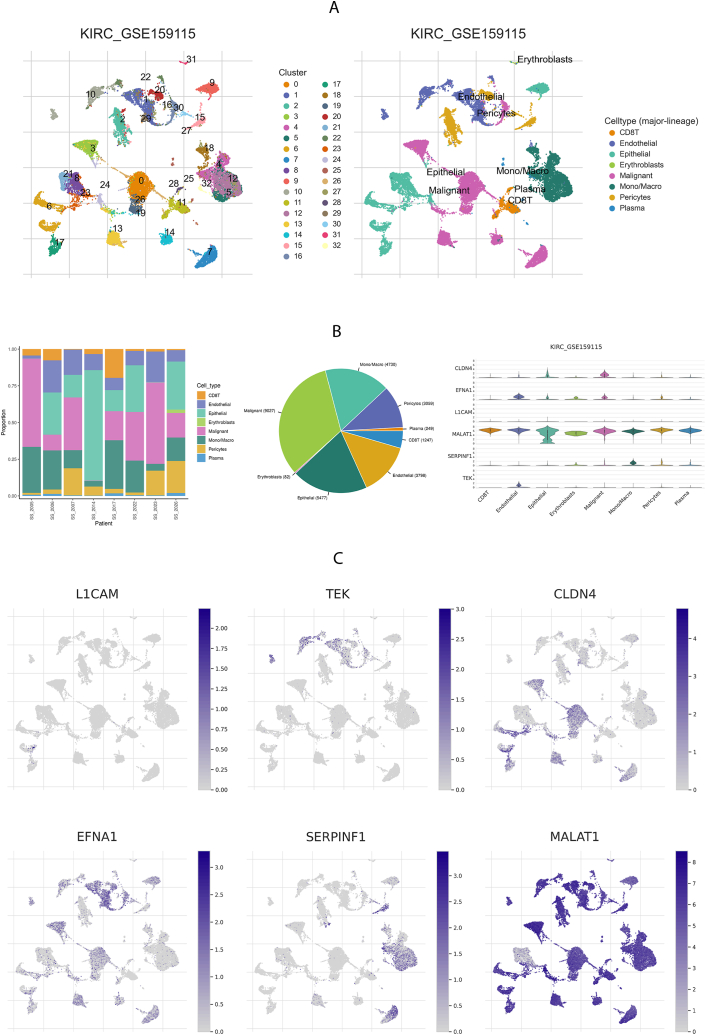
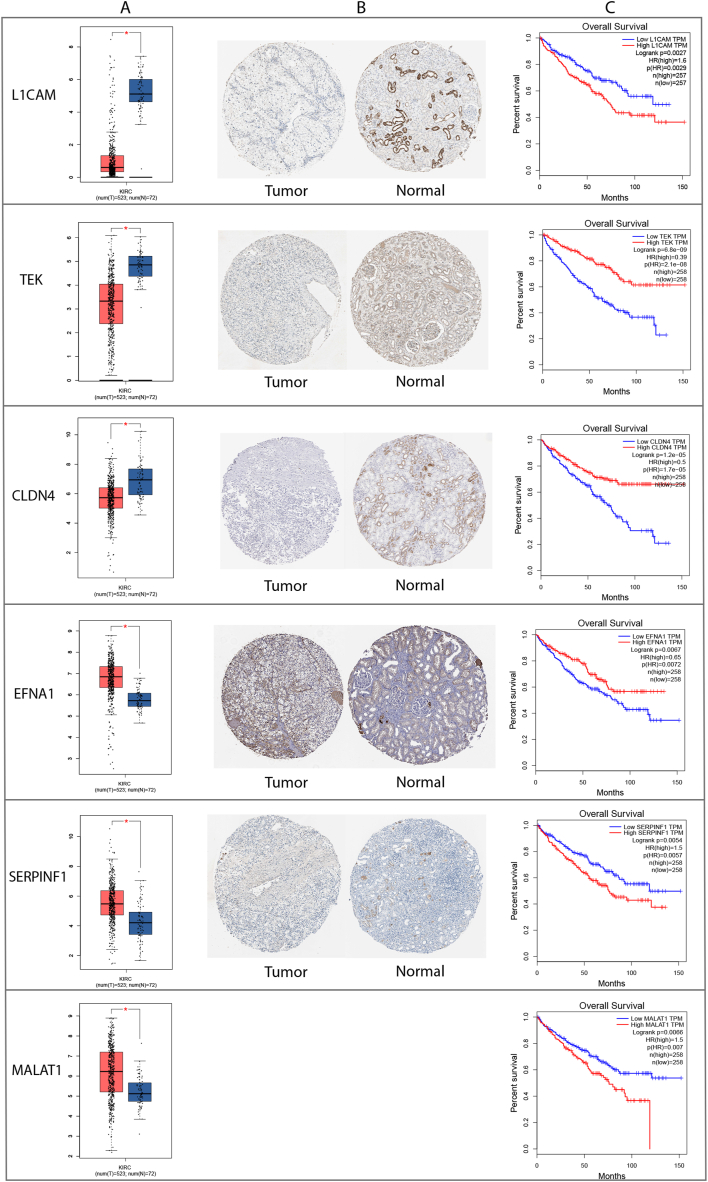
Results: Cox regression analysis and nomogram identified L1CAM, TEK, CLDN4, EFNA1, SERPINF1, and MALAT1 as independent prognostic risk factors, which could be used to stratify the ccRCC population into two risk groups with distinct immune profiles and responsiveness to immunotherapy. The results of single-cell analysis, GEPIA, HPA, and qRT-PCR validated the model genes' expression.

Conclusions: Our novel findings constructed a convenient and reliable 6 gene signatures as potential immunologic and prognostic biomarkers of VM in ccRCC.

Keywords: Clear cell renal cell carcinoma; Immune infiltration; Nomogram; Tumor microenvironment; Vasculogenic mimicry.


Conflict of interest statement

The authors declare that the research was conducted in the absence of any commercial or financial relationships that could be construed as potential conflicts of interest.

Figures

Fig. 1
Fig. 1
Expression and mutation of vasculogenic mimicry-related genes (VMRGs). (A) The differential expression of VMRGs between tumor tissue and normal tissue. (B) Heatmap showing the 109-differential expression VMRGs between normal and tumor tissues based on the expression. (C) The Cox survival analyses of differential expression VMRGs in the TCGA-KIRCC cohort and GSE29609 cohort. (D) The protein-protein interaction (PPI) network of the 44 VMRGs. (E) The incidence of somatic mutations of 44 VMRGs in ccRCC patients. (F) The CNV frequency of 44VMRGs. (G) The locus of CNV alterations of 44 VMRGs on 23 chromosomes.
Fig. 2
Fig. 2
Formation of vasculogenic mimicry-related genes clusters (VMRGs clusters). (A) The network of interactions between 44 VMRGs in the TCGA-KIRCC cohort and GSE29609 cohort, where the line thickness indicates the correlation strength. (B) All samples from the TCGA-KIRC cohort and GSE29609 cohort were divided into 2 clusters using the consensus clustering algorithm (k = 2). (C) Kaplan-Meier curves show the different overall survival (OS) between the two VMRGs clusters. (D) Principal component analysis (PCA) showed significant differences between the two VMRGs clusters. (E) VMRGs expression levels in two VMRGs clusters. (F)The heatmap showed the differences between the clusters in VMRGs expression.
Fig. 3
Fig. 3
Analysis of biological features and tumor immune infiltration in two VMRGs clusters. (A) KEGG-related GSEA analysis showing the biological pathways of two VMRGs clusters. (B) GO-related GSVA analysis showing the biological pathways of two VMRGs clusters. (C) ssGSEA analysis showing the infiltration of 23 types of immune cells in two VMRGs clusters. Adjusted p-values were shown as insignificant, **P<0.01, ***P<0.001.
Fig. 4
Fig. 4
Construction and validation of the prognostic VMRGs score model. (A) Alluvial plot shows the distribution of patients in two VMRGs clusters, two risk groups, and their survival status. (B) The differences in risk score of two VMRGs clusters. (C) Significant differences in and expression of 6 prognosis-related genes between high-risk and low-risk groups. (D) Prognostic value of VMRGs in the training set. Multivariate Cox regression via LASSO is presented, and six candidate VMRGs were selected in the training cohort. (E) Survival analysis of the overall survival (OS) for high-risk and low-risk patients in the training, testing, entire cohorts, and the E-MTAB-3267 validating cohort. (F) The ROC curves for 1-,3-, and 5-year survival of ccRCC patients in the training, testing, entire cohorts, and the E-MTAB-3267 validating cohort.
Fig. 5
Fig. 5
Construction and validation of a nomogram. (A) Multivariate Cox regression analysis of risk scores and clinicopathological factors. (B) Nomogram construction for predicting the 1-,3-, and 5-year OS of ccRCC patients. (C) Calibration curve analysis for predicting patients’ survival at 1-,3-,5-year. (D) Decision curve analysis (DCA) for predicting the clinical utility of the nomogram at 1-,3-,5-year.
Fig. 6
Fig. 6
Assessment of immune infiltration and tumor microenvironment (TME) characteristics between risk groups. (A-B) Differences in immune cell abundance. (C)Correlations between risk scores and immune cell abundance. (D) Expression levels of immune checkpoints (ICPs) in high-risk and low-risk groups. (E) Differences in Stromal score, Immune score, and ESTIMATE score between the two risk groups. (F) Correlations between 6 model genes in prognostic model and immune cell abundance. Adjusted p-values were shown as *P<0.05; **P<0.01; ***P<0.001.
Fig. 7
Fig. 7
Model genes mRNA expression of the single-cell-type clusters.
Fig. 8
Fig. 8
Validation of model gene expression identified in ccRCC. (A) Differential expression of six key genes between the kidney normal tissue and ccRCC using GEPIA online software. (B) Relative protein expressions of six key genes in the kidney normal tissue and ccRCC were measured by IHC staining from the HPA database. (C) Survival analysis of TCGA data using GEPIA online software.
Fig. 9
Fig. 9
The mRNA expression levels of 6 model genes in ccRCC cells (786-O and Caki-1) and the normal renal tubular epithelial cells HK-2. (A–F) The mRNA relative expression levels of L1CAM, TEK, CLDN4, EFNA1, SERPINF1, and MALAT1.

Similar articles

Cited by

References

    1. Barata P.C., Rini B.I. Treatment of renal cell carcinoma: current status and future directions. CA Cancer J Clin. 2017;67(6):507–524. doi: 10.3322/caac.21411. - DOI - PubMed
    1. Motzer R.J., Hutson T.E., Cella D., et al. Pazopanib versus sunitinib in metastatic renal-cell carcinoma. N. Engl. J. Med. 2013;369(8):722–731. doi: 10.1056/NEJMoa1303989. - DOI - PubMed
    1. Qu L., Ding J., Chen C., et al. Exosome-transmitted lncARSR promotes sunitinib resistance in renal cancer by acting as a competing endogenous RNA. Cancer Cell. 2016;29(5):653–668. doi: 10.1016/j.ccell.2016.03.004. - DOI - PubMed
    1. Maniotis A.J., Folberg R., Hess A., et al. Vascular channel formation by human melanoma cells in vivo and in vitro: vasculogenic mimicry. Am. J. Pathol. 1999;155(3):739–752. doi: 10.1016/S0002-9440(10)65173-5. - DOI - PMC - PubMed
    1. Xiang T., Lin Y.X., Ma W., et al. Vasculogenic mimicry formation in EBV-associated epithelial malignancies. Nat. Commun. 2018;9(1):5009. doi: 10.1038/s41467-018-07308-5. - DOI - PMC - PubMed

LinkOut - more resources