. 2024 Jul 12;11(9):uhae190.
doi: 10.1093/hr/uhae190. eCollection 2024 Sep.

Phospholipid production and signaling by a plant defense inducer against Podosphaera xanthii is genotype-dependent

Affiliations

Phospholipid production and signaling by a plant defense inducer against Podosphaera xanthii is genotype-dependent

Theoni Margaritopoulou et al. Hortic Res. .

Abstract

Biotrophic phytopathogenic fungi such as Podosphaera xanthii have evolved sophisticated mechanisms to adapt to various environments causing powdery mildews leading to substantial yield losses. Today, due to known adverse effects of pesticides, development of alternative control means is crucial and can be achieved by combining plant protection products with resistant genotypes. Using plant defense inducers, natural molecules that stimulate plant immune system mimicking pathogen attack is sustainable, but information about their mode of action in different hosts or host genotypes is extremely limited. Reynoutria sachalinensis extract, a known plant defense inducer, especially through the Salicylic acid pathway in Cucurbitaceae crops against P. xanthii, was employed to analyze the signaling cascade of defense activation. Here, we demonstrate that R. sachalinensis extract enhances phospholipid production and signaling in a Susceptible to P. xanthii courgette genotype, while limited response is observed in an Intermediate Resistance genotype due to genetic resistance. Functional enrichment and cluster analysis of the upregulated expressed genes revealed that inducer application promoted mainly lipid- and membrane-related pathways in the Susceptible genotype. On the contrary, the Intermediate Resistance genotype exhibited elevated broad spectrum defense pathways at control conditions, while inducer application did not promote any significant changes. This outcome was obvious and at the metabolite level. Main factor distinguishing the Intermediate Resistance form the Susceptible genotype was the epigenetic regulated increased expression of a G3P acyltransferase catalyzing phospholipid production. Our study provides evidence on phospholipid-based signaling after plant defense inducer treatment, and the selective role of plant's genetic background.


Figures

Figure 1
Figure 1
Rs extract stimulates transcriptomic changes in Susceptible to Podosphaera xanthii courgette genotypes. (A) Representative microscopy images (20 × magnification) of the S and IR genotype leaves where fluorescence signals detect callose deposits by Lactophenol blue staining and fluorescence microscopy. (B, C) Mean fluorescence intensity determined by ImageJ software of callose deposits area (B) and perimeter (C). Asterisks indicate statistical significance of the mean (±SE) determined in independent groups T-test, p-value <0.05. (D, E) PCA showing the transcriptomic effect of Rs and Px inoculation on the leaves of a Susceptible (D) and an Intermediate Defense (CE) courgette genotype. (F) Numbers of genes that are differentially expressed in each statistically valid group comparison. Plant treatments were performed with water (W), Rs, pathogen inoculation (Px), and combination of Rs and Px.
Figure 2
Figure 2
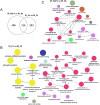
Rs extract modulates the enrichment of lipid pathways in Susceptible to Px courgette genotype. (A) Overlap between genes induced in R. sachalinensis treated, pathogen inoculated or combination of both Susceptible plant leaves. (B) Enriched GO terms of the pathogen inoculated versus water comparison in the Susceptible genotype and (C) of R. sachalinensis treated versus water comparison applying cut-offs of a ≥ 2-fold difference and padj ≤ 0.05 in expression. Node size shows GO-term significance (p-value): smaller p-value is positively correlated to larger node size. Common genes are represented with lines between nodes, and thicker lines represent larger overlap. Different node groups show GO-terms classification into functional groups. Word highlight indicates the names of the most significant GO-terms for each group. Interaction networks were constructed and visualized by Cytoscape [22]. (D) Interaction network of A. thaliana homologous proteins to C.pepo proteins of the R. sachalinensis treated versus water differential expression results. STRING was used to construct and visualize the interaction network by a minimum required interaction score of 0.7 [23].
Figure 3
Figure 3
Pathogen inoculation activates inherent defense mechanisms in Intermediate defense genotype after pathogen inoculation. (A) Overlap between genes induced by pathogen inoculation in R. sachalinensis treated or water treated Intermediate defense plant leaves. Enriched GO terms of the pathogen inoculated versus water comparison (B) and the pathogen inoculated versus control in R. sachalinensis treated plant leaves (C) in the Intermediate defense genotype applying cut-offs of a ≥ 2-fold difference and Padj≤0.05 in expression. Interaction networks were constructed and visualized by Cytoscape [22]. Node size shows GO-term significance (p-value): smaller p-value is positively correlated to larger node size. Common genes are represented with lines between nodes, and thicker lines represent larger overlap. Different node colors show GO-terms classification into functional groups. Word highlight indicates the names of the most significant GO-terms for each group.
Figure 4
Figure 4
Rs PDI regulates the enrichment of lipid pathways in Susceptible to Podosphaera xanthii genotype. (A) K-means clustering to assess similar expression profiles in the transcriptomic results illustrating ten clusters. Each subgroup corresponds to one gene cluster showing similar profile in expression. The horizontal axes correspond to the valid expression comparisons of each genotype and between genotypes. The vertical axes depict the corresponding logarithmic ratios, as derived from the transcriptomic data analysis. n = number of genes in each cluster. (B) STRING network of the interacting homologues to A. thaliana proteins of the cluster 1 subgroup. (C) Overlap between genes in cluster 5 that are highly upregulated in pathogen inoculated versus water comparison and R. sachalinensis versus water treatment in the Susceptible genotype plant leaves, and in Intermediate defense versus Susceptible water treated plant leaves. (D) Enriched GO terms of the cluster 5 subgroup. Interaction networks were constructed and visualized by Cytoscape [22]. Node size shows GO-term significance (p-value): smaller p-value is positively correlated to larger node size. Common genes are represented with lines between nodes, and thicker lines represent larger overlap. Different node groups show GO-terms classification into functional groups. Word highlight indicates the names of the most significant GO-terms for each group. (E) Relative expression PATATIN (Cp4.1LG05g11200) in leaves of Susceptible and Intermediate defense plants after R. sachalinensis treatment, pathogen inoculation and combination of both. Data represents the mean ± SEM of six biological replicates obtained from two independent experiments. p-values are determined by Brown–Forsythe ANOVA with a post hoc Dunnett’s multiple comparison test. Different letters indicate significant differences. Difference between S_Rs and S_W was determined by two-tailed Student’s t-test with Welch correction. Geometrical symbols on each sample bar represent relative to S_W normalized counts.
Figure 5
Figure 5
Rs extract increases glycerophospholipid production in a Susceptible to Podosphaera xanthii genotype. Partial least squares discriminant analysis (PLS-DA) score plot showing the metabolomic differences of the detected metabolites in the leaves of the Susceptible and Intermediate Defense genotype after Rs treatment, pathogen inoculation and combination of both in negative (A) and positive (B) ionization mode. (C) Glycerophospholipid classes that are detected and annotated in the negative ionization mode. The y axis refers to relative glycerophospholipid accumulation fold change in the statistically significant different treatments compared to S_W where LPA: Lyso-Phosphatidic acid, LPG: Lyso-Phosphatidylglycerol, LPE: Lyso-Phosphatidlyethanolamine, LPS: Lyso-Phosphatidylserine, PG: Phosphatidylglycerol. (D) Western blot of PATATIN and PLD proteins in leaves of the S and IR genotypes after the above-mentioned treatments; endogenous levels of ACTIN protein are used as internal normalization control. (E) Phosphatidylserine class that was detected in leaves of the above-mentioned treatments. Significant differences are indicated with asterisk (p-value < 0.05): ns denotes no statistical differences. (F) Glycerophospholipid classes that were detected in leaves of the above-mentioned treatments and annotated in the positive ionization mode where PS: Phosphatidylserine, PE: Phosphatidylethanolamine. (G) Phosphatidic acid that was quantified in leaves of the above-mentioned treatments.
Figure 6
Figure 6
Epigenetic upregulation of Pm-0 G3P acyltransferase in IR genotype. (A) Relative expression analysis of ATS1 was performed in leaves of the S and IR genotypes after Regalia® treatment, Px inoculation and combination of both treatments. Data represents the mean ± SEM of six biological replicates obtained from two independent experiments. p-values are determined performing one-way Analysis of Variance (ANOVA). Means were separated using the post hoc Dunnett’s multiple comparison test. Different letters indicate statistically significant differences at p-value ≤0.05. (B) ChIP on ATS1 gene genomic region. The enrichment of H3K4me3 and H3K27me3 marks in the tested locus relative to percent input was determined by ChIP-qPCR in leaves of the S and IR genotypes at control conditions. Comparison of immunoprecipitated samples was performed to their mock controls. m: no antibody ChIP samples; H3K4me3: a-H3K4me3 ChIP samples; H3K27: a-H3K27me3 ChIP.

References

    1. Burketova L, Trda L, Ott PG et al. Bio-based resistance inducers for sustainable plant protection against pathogens. Biotechnol Adv. 2015;33:994–1004. - PubMed
    1. W.H.O. Public Health Impact of Pesticides Used in Agriculture. Geneva, Switzerland: World Health Organization, 1990.
    1. Zubrod JP, Bundschuh M, Arts G et al. Fungicides: an overlooked pesticide class? Environ Sci Technol. 2019;53:3347–65. - PMC - PubMed
    1. Fisher MC, Henk DA, Briggs CJ et al. Emerging fungal threats to animal, plant and ecosystem health. Nature. 2012;484:186–94. - PMC - PubMed
    1. EPPO . PP 1/319 (1) general principles for efficacy evaluation of plant protection products with a mode of action as plant defence inducers. Bulletin OEPP/EPPO Bulletin. 2021;51:5–9.

LinkOut - more resources