. 2024 Aug 23:18:1451529.
doi: 10.3389/fninf.2024.1451529. eCollection 2024.

Interpretable machine learning comprehensive human gait deterioration analysis

Affiliations

Interpretable machine learning comprehensive human gait deterioration analysis

Abdullah S Alharthi. Front Neuroinform. .

Abstract

Introduction: Gait analysis, an expanding research area, employs non-invasive sensors and machine learning techniques for a range of applications. In this study, we investigate the impact of cognitive decline conditions on gait performance, drawing connections between gait deterioration in Parkinson's Disease (PD) and healthy individuals dual tasking.

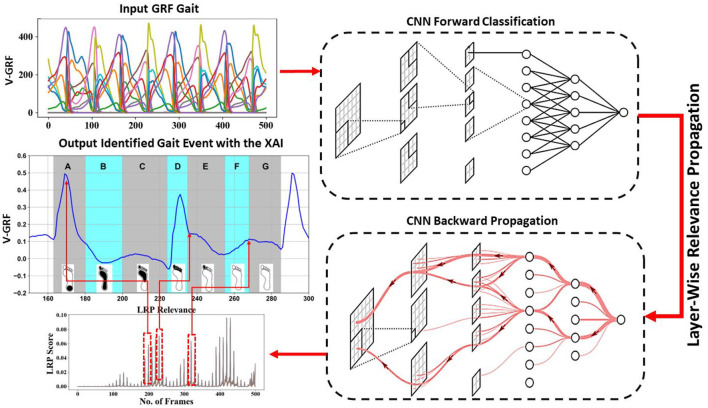
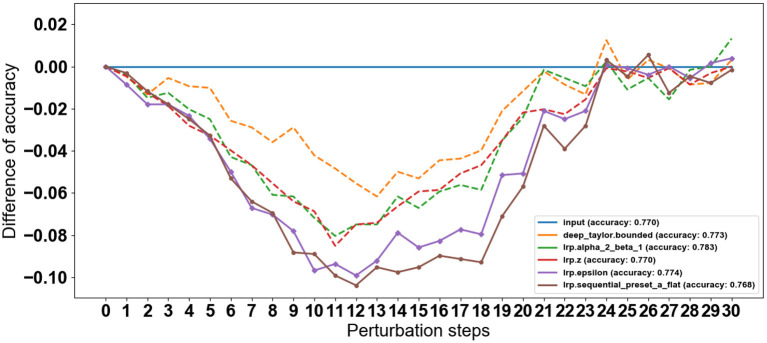
Methods: We employ Explainable Artificial Intelligence (XAI) specifically Layer-Wise Relevance Propagation (LRP), in conjunction with Convolutional Neural Networks (CNN) to interpret the intricate patterns in gait dynamics influenced by cognitive loads.

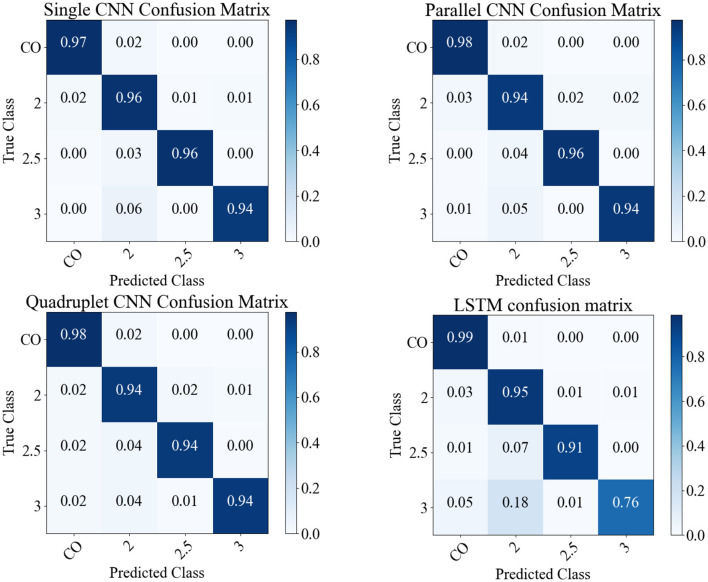
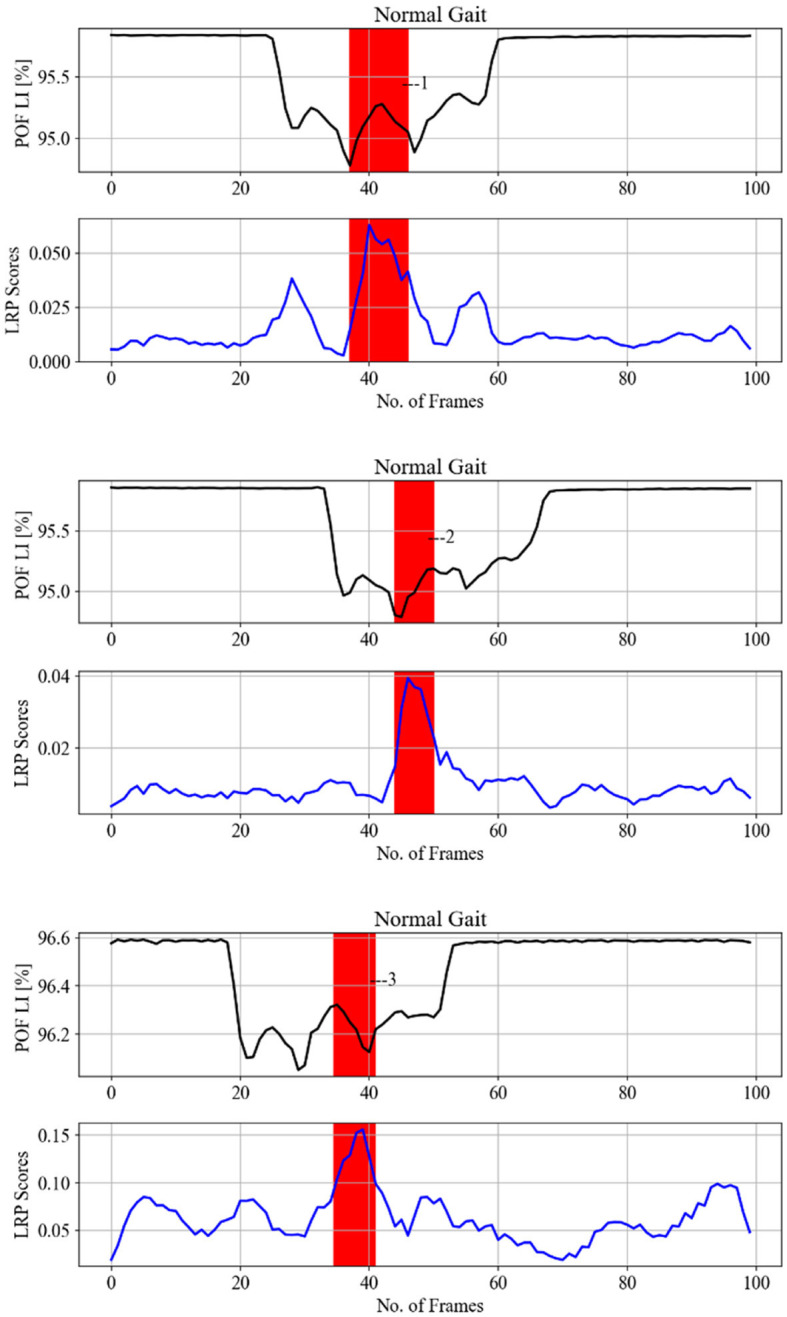
Results: We achieved classification accuracies of 98% F1 scores for PD dataset and 95.5% F1 scores for the combined PD dataset. Furthermore, we explore the significance of cognitive load in healthy gait analysis, resulting in robust classification accuracies of 90% ± 10% F1 scores for subject cognitive load verification. Our findings reveal significant alterations in gait parameters under cognitive decline conditions, highlighting the distinctive patterns associated with PD-related gait impairment and those induced by multitasking in healthy subjects. Through advanced XAI techniques (LRP), we decipher the underlying features contributing to gait changes, providing insights into specific aspects affected by cognitive decline.

Discussion: Our study establishes a novel perspective on gait analysis, demonstrating the applicability of XAI in elucidating the shared characteristics of gait disturbances in PD and dual-task scenarios in healthy individuals. The interpretability offered by XAI enhances our ability to discern subtle variations in gait patterns, contributing to a more nuanced comprehension of the factors influencing gait dynamics in PD and dual-task conditions, emphasizing the role of XAI in unraveling the intricacies of gait control.

Keywords: Parkinson's disease; deep convolutional neural networks (CNN); deep learning; gait; ground reaction forces (GRF); interpretable neural networks; perturbation.


Conflict of interest statement

The author declares that the research was conducted in the absence of any commercial or financial relationships that could be construed as a potential conflict of interest.

Figures

Figure 1
Figure 1
Important gait events and intervals in a normal gait cycle. In the center, the stance phase represents 60% of the gait cycle and the swing phase represents 40% of the gait cycle.
Figure 2
Figure 2
Overview of data acquisition and analysis of CNN. Gait data as input to CNN for classification; interpreting the CNN model by LRP, a deeper red color represents a higher contribution to the classification process. Relevance linked to the foot profile in the input single.
Figure 3
Figure 3
Proposed CNN architectures: (A) single CNN, (B) parallel CNN, (C) quadruplets CNN. The boxes: convolution layers and fully connected layers; pooling layers; concatenation layers and flattening layers; dropout layers.
Figure 4
Figure 4
Example gait data. (A) PD Gait was recorded at 100 frames per second, with a sample length of 500 timeframes. The signals represent pressure sensor signals under each foot (different colors for each of the eight sensors). (B) Cognitive Load Gait, recorded at 20 frames per second, with a sample length of 100 timeframes. The signals represent POF sensors transmitted light intensity is affected by surface bending due to pressure under each foot (different colors for each of the 116 POF sensors).
Figure 5
Figure 5
The predictions of models on the 1,281 sample shown as confusion matrices: single CNN, parallel CNN, quadruplet CNN, and LSTM.
Figure 6
Figure 6
Confusion matrix for classification under cognitive load: 21 subjects, five classes. Experiment (4) Cognitive Load Impact on Gait Variations (Binary Classification).
Figure 7
Figure 7
Perturbation effect on the proposed CNNs architectures. The decline in accuracy results from progressively removing information from the input data based on LRP-SPF and re-predicting, at each step, 30 steps total.
Figure 8
Figure 8
Validation of LRP heatmaps by perturbation technique for experiment 3 subject 13. Information with the highest relevance scores is progressively removed, and the test samples are re-predicted. A steeper initial decrease indicates better identification of gait events with the most weight in the classifications. (A) Shows the model predictions in 30 steps based on removing relevance scores using LRP sequential preset a flat (LRP-SPF) and random removal of information. (B) Shows the model performance after 300 steps of information removal.
Figure 9
Figure 9
LRP method selection by perturbation steps progressively removes information with the highest relevance scores. A steeper initial decrease indicates better identification of gait events with the most weight in the classifications.
Figure 10
Figure 10
Gait events processed SA (see Equation 7) signal top. The highlighted gray area in (A) is explained in (B) based on gait events for one foot from Figure 4 as: A—heel strike, B—loading response or flat foot, C—mid-stance or single support, D—terminal stance or heel rising, E—pre-swing or double-limb support, F—initial swing and mid-swing or toe-off, G—terminal swing.
Figure 11
Figure 11
LRP method applied on randomly selected samples for healthy gait and three PD severity ratings. SA of gait spatiotemporal signals: black; SA for LRP relevance scores (RS) over the same temporal period: blue. Vertical red bars with number labels display consistency with gait events listed below with capital letters as per Figure 1 (Table 1) and Figure 10: 1—heal strike and foot flattening (A); 2—mid-stance and single support (C); 3—loading response after the double support interval (B), 4—terminal swing and ready for the heel strike (G).
Figure 12
Figure 12
LRP methods applied on normal gait samples (from different subjects) from experiment 2 testing data, to identify gait events relevant to the CNN prediction to classify the cognitive load impact on gait. Gait events are 1,2,3—loading response or foot flat and double support.
Figure 13
Figure 13
LRP methods applied on a single subject from experiment 3 testing data (each column is one pair), to identify gait events relevant for the CNN prediction to classify the cognitive load impact on gait. SA of gait spatiotemporal signals: black; SA for LRP relevance signals over gait temporal period: blue; POF LI (plastic optical fiber light intensity). Vertical red bars with numbers display correspondence to gait events as per Figure 15: 1, 5—loading response or foot flat and double support, 2, 3, 4—loading response or foot flat and single support.
Figure 14
Figure 14
LRP methods applied on a single subject from experiment 4 testing data (each column is one pair), to identify gait events relevant for the CNN prediction to classify the cognitive load impact on gait. Gait events are as follows: 1—heel strike, 2—toe-off, 3—between foot swing and opposite heel strike, 4—between double support and toe-off.
Figure 15
Figure 15
Representative gait cycle spatial average of spatiotemporal signals (see Equation 8). Gait events recorded by iMAGiMAT sensors in a typical full gait cycle of two steps (Figure 4: A, B, C, D, E, F, G): 1—heel strike, 2—foot-flattening, 3—single support, 4—opposite heel strike, 5—opposite foot-flattening, 6—double support, 7—toe-off, 8—foot swing, 9—heel strike, 10—double support, 11—toe-off, 12—foot swing, 13—opposite heel strike, 14—single support, 15—toe-off.

References

    1. Abdulhay E., Arunkumar N., Narasimhan K., Vellaiappan E. (2018). Gait and tremor investigation using machine learning techniques for the diagnosis of Parkinson disease. Future Gener. Comput. Syst. 83, 366–373. 10.1016/j.future.2018.02.009 - DOI
    1. Adebayo J., Gilmer J., Muelly M., Goodfellow I., Hardt M., Kim B., et al. (2018). “Sanity checks for saliency maps,” in Proc. Adv Neural Information Processing Systems (NeurIPS) (San Diego, CA: ), 9505–9515.
    1. Alber M., Lapuschkin S., Seegerer P., Hägele M., Schütt K. T., Montavon G., et al. (2018). iNNvestigate Neural Networks. Available at: https://github.com/albermax/innvestigate (accessed Jun 19, 2024).
    1. Alharthi A. S., Yunas S. U., Ozanyan K. B. (2019). Deep learning for monitoring of human gait: a review. IEEE Sens. J. 19, 9575–9591. 10.1109/JSEN.2019.2928777 - DOI
    1. Alotaibi M., Mahmood A. (2015). “Improved gait recognition based on specialized deep convolutional neural network,” in 2015 IEEE Applied Imagery Pattern Recognition Workshop (AIPR) (Washington, DC: IEEE; ). 10.1109/AIPR.2015.7444550 - DOI

LinkOut - more resources