. 2024 Dec;13(1):2395565.
doi: 10.1080/21623945.2024.2395565. Epub 2024 Sep 9.

The change of epicardial adipose tissue characteristics and vulnerability for atrial fibrillation upon drastic weight loss

Affiliations

The change of epicardial adipose tissue characteristics and vulnerability for atrial fibrillation upon drastic weight loss

Eva R Meulendijks et al. Adipocyte. 2024 Dec.

Abstract

Background: Obesity increases the risk of atrial fibrillation (AF). We hypothesize that 'obese' epicardial adipose tissue (EAT) is, regardless of comorbidities, associated with markers of AF vulnerability.

Methods: Patients >40y of age undergoing bariatric surgery and using <2 antihypertensive drugs and no insulin were prospectively included. Study investigations were conducted before and 1y after surgery. Heart rhythm and p-wave duration were measured through ECGs and 7-d-holters. EAT-volume and attenuation were determined on non-enhanced CT scans. Serum markers were quantified by ELISA.

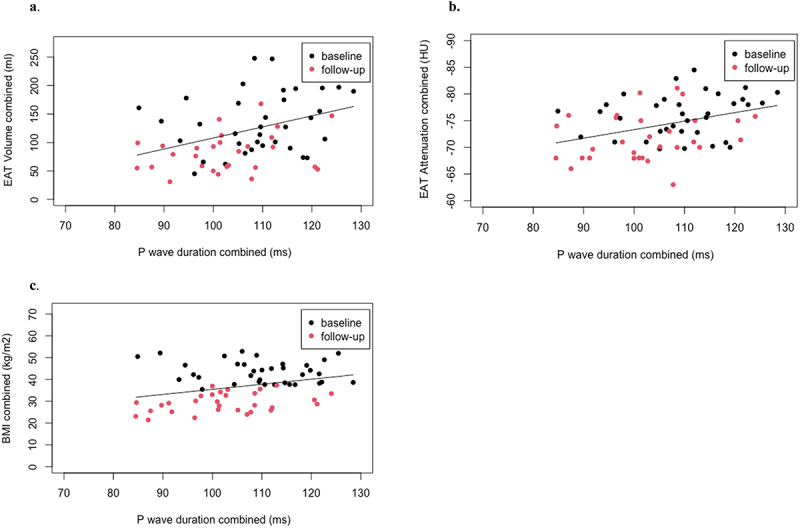
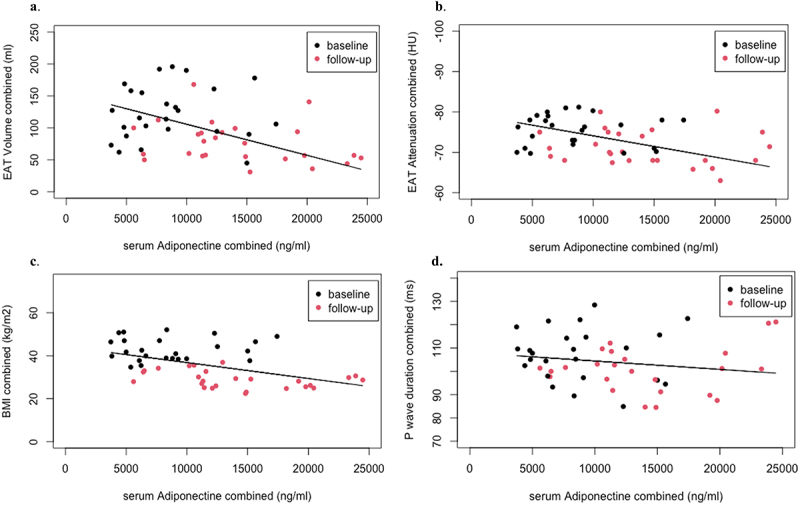
Results: Thirty-seven patients underwent surgery (age: 52.1 ± 5.9y; 27 women; no AF). Increased p-wave duration correlated with higher BMI, larger EAT volumes, and lower EAT attenuations (p < 0.05). Post-surgery, p-wave duration decreased from 109 ± 11 to 102 ± 11ms. Concurrently, EAT volume decreased from 132 ± 49 to 87 ± 52ml, BMI from 43.2 ± 5.2 to 28.9 ± 4.6kg/m2, and EAT attenuation increased from -76.1 ± 4.0 to -71.7 ± 4.4HU (p <0.001). Adiponectin increased from 8.7 ± 0.8 to 14.2 ± 1.0 μg/ml (p <0.001). However, decreased p-wave durations were not related to changed EAT characteristics, BMI or adiponectin.

Conclusion: In this explorative study, longer p-wave durations related to higher BMIs, larger EAT volume, and lower EAT attenuations. P-wave duration and EAT volume decreased, and EAT attenuation increased upon drastic weightloss. However, there was no relation between decreased p-wave duration and changed BMI or EAT characteristics.

Keywords: (epicardial) adipose tissue; Adipokines; adipose remodelling; atrial fibrillation; bariatric surgery.


Conflict of interest statement

No potential conflict of interest was reported by the author(s).

Figures

x-y graph of mixed model analyses: fitted linear line with all EAT attenuation and p-wave duration values from baseline (black) and follow-up (red) moments. x-y graph of mixed model analyses: fitted linear line with all EAT volume and p-wave duration values from baseline (black) and at follow-up (red) moments. x-y graph of mixed model analyses: fitted linear line with all BMI and p-wave duration values from baseline (black) and at follow-up (red) moments.
Figure 1.
Figure 1 shows the relation between p-wave duration on the x-axes and EAT characteristics and BMI on the y-axes. Analyses were performed with linear mixed models: 10 ms increase in p-wave relates to 1a: a 19.4 ml larger volume of EAT (p = 0.005), 1b: −1.7HU units lower EAT attenuation (p = 0.002), and 1c: a 2.4 kg/m2 higher BMI (p = 0.02).
x-y graph of mixed model analyses: fitted linear line with all EAT volume and adiponectin values from baseline (black) and follow-up (red) moments. x-y graph of mixed model analyses: fitted linear line with all EAT attenuation and adiponectin values from baseline (black) and follow-up (red) moments. x-y graph of mixed model analyses: fitted linear line with all BMI and adiponectin values from baseline (black) and follow-up (red) moments. x-y graph of mixed model analyses: fitted linear line with all p-wave duration and adiponectin values from baseline (black) and follow-up (red) moments.
Figure 2.
Figure 2 shows the relation between serum adiponectin on the x-axes and EAT characteristics and BMI on the y-axes. Analyses were performed with linear mixed models: 5.5 μg (5532 ng) higher serum adiponectin relates to 2a: the decrease of 27 ml of EAT (p < 0.001), 2b: the increase of 2.9HU units EAT attenuation (p < 0.001), 2c: the decrease of 4.1 kg/m2 BMI (p = 0.004), and 2d: unchanged p-wave duration (−2.0 ms, p = 0.22).

References

    1. Naccarelli GV, Varker H, Lin J, et al. Increasing prevalence of atrial fibrillation and flutter in the United States. Am J Cardiol. 2009;104(11):1534–11. doi: 10.1016/j.amjcard.2009.07.022 - DOI - PubMed
    1. Ncdrf C. Trends in adult body-mass index in 200 countries from 1975 to 2014: a pooled analysis of 1698 population-based measurement studies with 19.2 million participants. Lancet. 2016;387:1377–1396. doi: 10.1016/S0140-6736(16)30054-X - DOI - PMC - PubMed
    1. Tsang TS, Barnes ME, Miyasaka Y, et al. Obesity as a risk factor for the progression of paroxysmal to permanent atrial fibrillation: a longitudinal cohort study of 21 years. Eur Heart J. 2008;29(18):2227–2233. doi: 10.1093/eurheartj/ehn324 - DOI - PMC - PubMed
    1. Pathak RK, Middeldorp ME, Meredith M, et al. Long-term effect of goal-directed weight management in an atrial fibrillation cohort: a long-term follow-up study (LEGACY). J Am Coll Cardiol. 2015;65(20):2159–2169. doi: 10.1016/j.jacc.2015.03.002 - DOI - PubMed
    1. Donnellan E, Wazni OM, Elshazly M, et al. Impact of bariatric surgery on atrial fibrillation type. Circ Arrhythm Electrophysiol. 2020;13(2):e007626. doi: 10.1161/CIRCEP.119.007626 - DOI - PubMed