. 2024 Sep;13(17):e70157.
doi: 10.1002/cam4.70157.

Heat shock transcription factor 1 facilitates liver cancer progression by driving super-enhancer-mediated transcription of MYCN

Affiliations

Heat shock transcription factor 1 facilitates liver cancer progression by driving super-enhancer-mediated transcription of MYCN

Yizhe Liu et al. Cancer Med. 2024 Sep.

Abstract

Background: Heat shock transcription factors (HSFs) play crucial roles in the development of malignancies. However, the specific roles of HSFs in hepatocellular carcinoma (HCC) have yet to be fully elucidated.

Aims: To explore the involvement of the HSF family, particularly HSF1, in the progression and prognosis of HCC.

Materials & methods: We conducted a thorough analysis of HSF expression and copy number variations across various cancer datasets. Specifically focusing on HSF1, we examined its expression levels and prognostic implications in HCC. In vitro and in vivo experiments were carried out to evaluate the impact of HSF1 on liver cancer cell proliferation. Additionally, we utilized CUT&Tag, H3K27 acetylation enrichment, and RNA sequencing (RNA-seq) to investigate the super-enhancer (SE) regulatory landscapes of HSF1 in liver cancer cell lines.

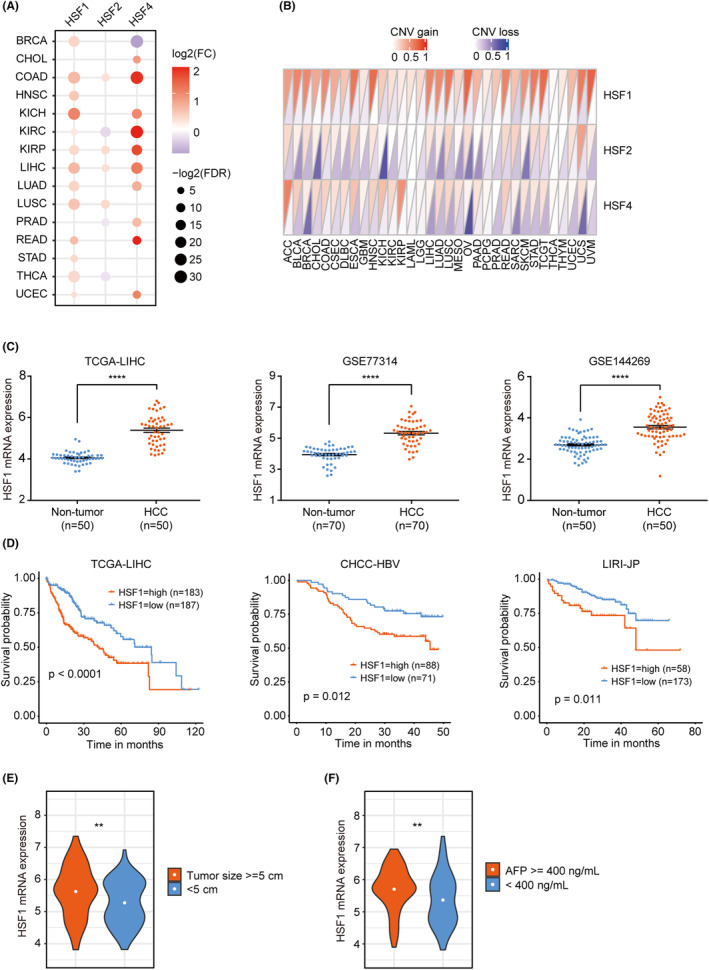
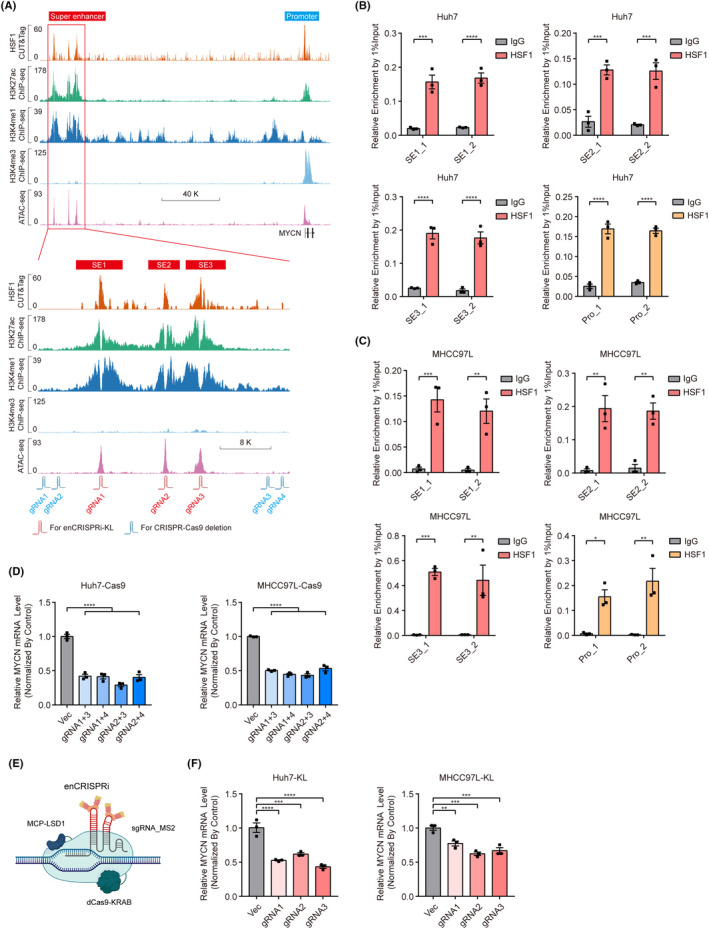
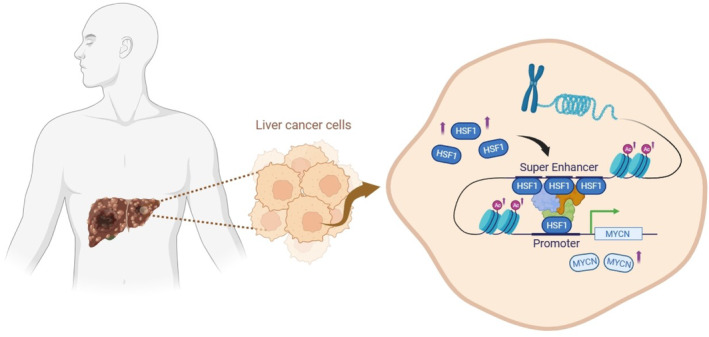
Results: HSF1 expression is elevated in HCC and is linked to poor prognosis in several datasets. HSF1 stimulates liver cancer cell proliferation both in vitro and in vivo, partly through modulation of H3K27ac levels, influencing enhancer distribution. Mechanistically, our findings demonstrate that HSF1 transcriptionally activates MYCN expression by binding to its promoter and SE elements, thereby promoting liver cancer cell proliferation. Moreover, increased MYCN expression was detected in HCC tumors and correlated with unfavorable patient outcomes.

Discussion: Our study sheds light on previously unexplored aspects of HSF1 biology, identifying it as a transcription factor capable of shaping the epigenetic landscape in the context of HCC. Given HSF1's potential as an epigenetic regulator, targeting the HSF1-MYCN axis could open up new therapeutic possibilities for HCC treatment.

Conclusion: The HSF1-MYCN axis constitutes a transcription-dependent regulatory mechanism that may function as both a prognostic indicator and a promising therapeutic target in liver cancer. Further exploration of this axis could yield valuable insights into novel treatment strategies for HCC.

Keywords: HSF1; MYCN; liver cancer; super‐enhancer; transcriptional regulation.


Conflict of interest statement

The authors declare no conflict of interest.

Figures

FIGURE 1
FIGURE 1
High expression of HSF1 correlates with poor outcomes in patients with HCC. (A) Differential expression analysis of the HSF family members HSF1, HSF2, and HSF4 in 15 cancer types. (B) Copy number variation analysis of HSF1, HSF2, and HSF4 in 33 cancer types. (C) Analysis of HSF1 expression in tumor and non‐tumor tissues from three groups of HCC patients. (D) The relationship between high and low expression of HSF1 and prognosis in three separate groups of HCC patients. (E, F) Clinical significance of HSF1 in patients with HCC; high HSF1 expression was positively correlated with tumor size (> = 5 cm) and AFP level (> = 400 ng/mL). The values are expressed as the means ± SEMs (C, E, F). **p < 0.01; ****p < 0.0001 by one‐way ANOVA or two‐tailed Student's t‐test.
FIGURE 2
FIGURE 2
High expression of HSF1 promotes liver cancer cell proliferation in vitro and in vivo. (A, B) CCK‐8 assay and colony formation assay of the two liver cancer cell lines with HSF1 knockout (n = 3). (C, D) CCK‐8 assay and colony formation assay of the Huh7 and MHCC97L cells after HSF1 overexpression (n = 3). (E) Tumor volumes and weights were assessed in both the sgHSF1 and negative control groups of xenograft mice (n = 8). (F) Images of xenografts from nude mice carrying subcutaneous xenografts derived from sgHSF1 cells or control cells are presented. The values are expressed as the means ± SEMs (A–E). **p < 0.01; ***p < 0.001; ****p < 0.0001 by one‐way ANOVA or two‐tailed Student's t‐test.
FIGURE 3
FIGURE 3
HSF1 affects the super‐enhancer (SE) variation in liver cancer cells. (A) Line plots showing CUT&Tag signals of HSF1 and ChIP‐seq signals of H3K27ac at the center of peaks in Huh7 cells. (B) Line plots showing ChIP‐seq signals of H3K27ac at the center of peaks in Huh7 cells transfected with siNC or siHSF1. (C) Venn diagram showing the lost SEs (only in the siNC group), overlapped SEs (in both the siNC and siHSF1 groups), and gained SEs (only in the siHSF1 group) and the number in each group. (D) Violin plot showing the changes in the mRNA levels of genes in the lost, overlapped, and gained SE groups. (E, F) Relative mRNA and protein expression levels of MYCN upon knock‐down of HSF1 in Huh7 and MHCC97L cells (n = 3). The values are expressed as the means ± SEMs (D, E). *p < 0.05; ***p < 0.001; ****p < 0.0001 by one‐way ANOVA or two‐tailed Student's t‐test.
FIGURE 4
FIGURE 4
HSF1 transcriptionally activates MYCN expression via occupation of its promoter and SE element. (A) Profiles of HSF1, H3K27ac, H3K4me1, and H3K4me3 occupancy and ATAC‐seq peaks at the MYCN promoter (blue rectangle) and SE (red rectangle) regions in Huh7 cells. The red box indicates the occupancy of HSF1, which contains three specific constituent SEs (SE1, SE2, and SE3). The sgRNAs were esigned on the basis of the abovementioned peaks. (B, C) ChIP–qPCR analysis of HSF1 enrichment in the promoter and SE regions of MYCN in Huh7 and MHCC97L cells (n = 3). (D) Relative MYCN mRNA levels upon knockout of the SE regions by CRISPR–Cas9 gene editing (n = 3). (E) Schematic diagram of the enCRISPRi system containing the dCas9‐KRAB fusion protein, the MCP‐LSD1 fusion protein, and a sgRNA with two MS2 hairpins. (F) Relative MYCN mRNA levels upon blocking the SE with three individual sgRNAs in Huh7‐KL and MHCC97L‐KL cells (n = 3). The values are expressed as the means ± SEMs (B–D, F). *p < 0.05; **p < 0.01; ***p < 0.001; ****p < 0.0001 by one‐way ANOVA or two‐tailed Student's t‐test.
FIGURE 5
FIGURE 5
HSF1 promoted the proliferation of liver cancer cells by regulating MYCN. (A) CCK‐8 assay of Huh7‐Cas9 and MHCC97L‐Cas9 cells infected with two independent lentiviruses containing different sgRNAs (n = 3). (B) Colony formation assay of Huh7‐Cas9 and MHCC97L‐Cas9 cells in the NC and MYCN knockout groups (n = 3). (C) Analysis of MYCN expression in tumor and non‐tumor tissues from HCC patients. (D) Relationships between high and low expression of MYCN and the prognosis of HCC patients. (E) Viability of Huh7 and MHCC97L cells treated as indicated. (F) Colony formation assays and colony counts of Huh7 and MHCC97L cells treated as indicated. The values are expressed as the means ± SEMs (A–C, E, F). (G) Gene Ontology Biological Process (GO‐BP) overrepresentation analysis of genes downregulated (fold change <2/3) by siHSF1 and siMYCN, identified via RNA‐seq. The size of each dot represents the gene ratio. The color of each dot indicates the p‐value (−log2). *p < 0.05; **p < 0.01; ***p < 0.001; ****p < 0.0001 by one‐way ANOVA or two‐tailed Student's t‐test.
FIGURE 6
FIGURE 6
Pattern diagram illustrates the mechanism of the HSF1MYCN regulatory axis. HSF1 is upregulated in liver cancer patients. HSF1 can affect the H3K27ac level and the distribution of super enhancers in liver cancer cells, and bind to the super enhancer and promoter region of MYCN to affect its transcription and promote the proliferation of liver cancer cells.

References

    1. Llovet JM, Kelley RK, Villanueva A, et al. Hepatocellular Carcinoma. Nat Rev Dis Prim. 2021;7:6. - PubMed
    1. Sung H, Ferlay J, Siegel RL, et al. Global cancer statistics 2020: GLOBOCAN estimates of incidence and mortality worldwide for 36 cancers in 185 countries. CA Cancer J Clin. 2021;71:209‐249. - PubMed
    1. Petrick JL, Florio AA, Znaor A, et al. International trends in hepatocellular carcinoma incidence, 1978‐2012. Int J Cancer. 2020;147:317‐330. - PMC - PubMed
    1. Llovet JM, Castet F, Heikenwalder M, et al. Immunotherapies for hepatocellular carcinoma. Nat Rev Clin Oncol. 2022;19:151‐172. - PubMed
    1. Wang Z, Wang Y, Gao P, Ding J. Immune checkpoint inhibitor resistance in hepatocellular carcinoma. Cancer Lett. 2023;555:216038. - PubMed

MeSH terms

Substances