. 2025 Jan;40(1):30-53.
doi: 10.1002/tox.24413. Epub 2024 Sep 9.

Suppression of Hippocampal Neurogenesis and Oligodendrocyte Maturation Similar to Developmental Hypothyroidism by Maternal Exposure of Rats to Ammonium Perchlorate, a Gunpowder Raw Material and Known Environmental Contaminant

Affiliations

Suppression of Hippocampal Neurogenesis and Oligodendrocyte Maturation Similar to Developmental Hypothyroidism by Maternal Exposure of Rats to Ammonium Perchlorate, a Gunpowder Raw Material and Known Environmental Contaminant

Yuri Sakamaki et al. Environ Toxicol. 2025 Jan.

Abstract

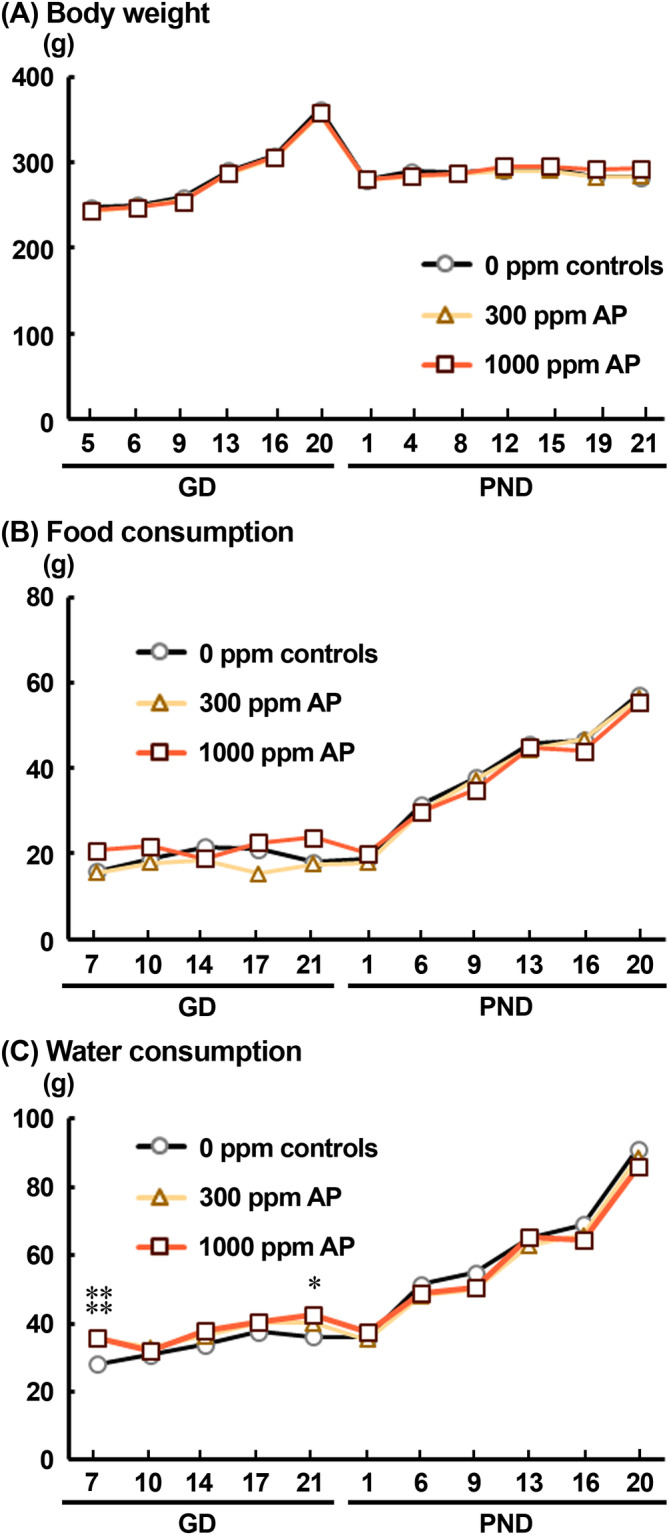
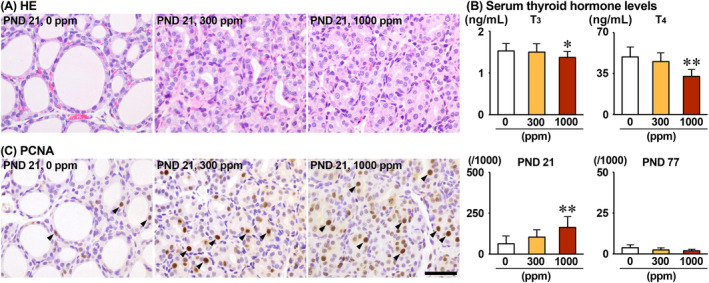
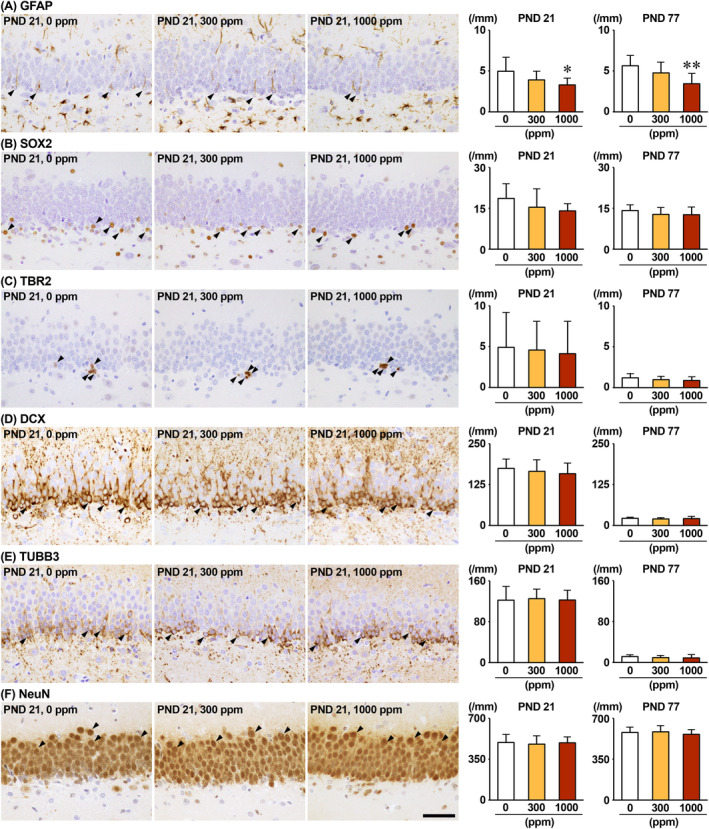
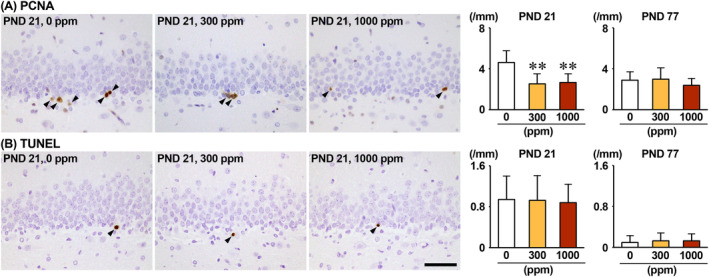
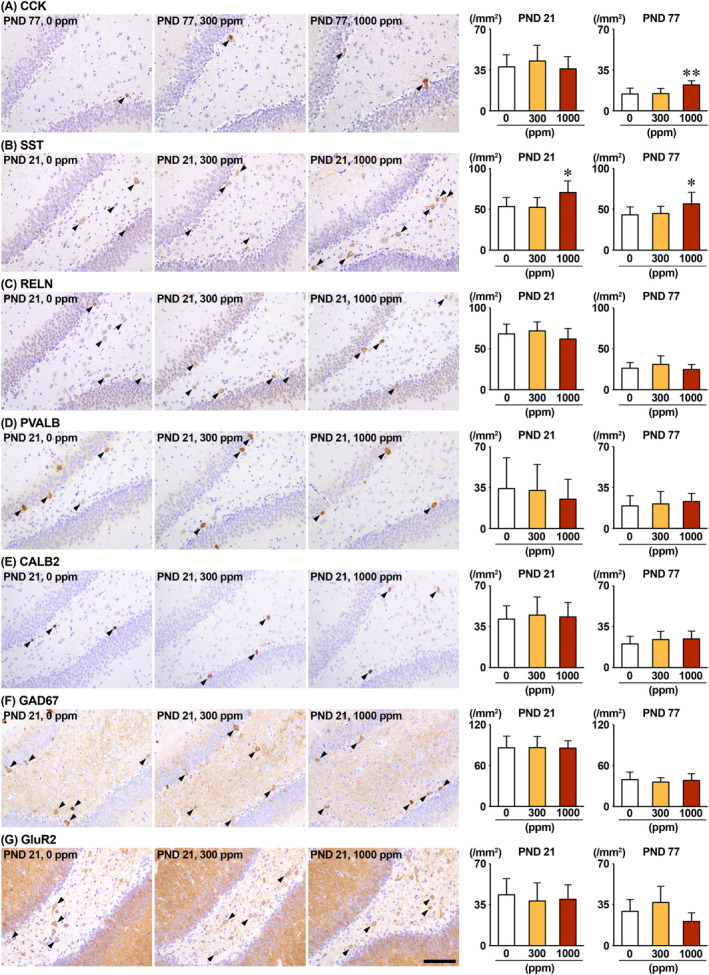
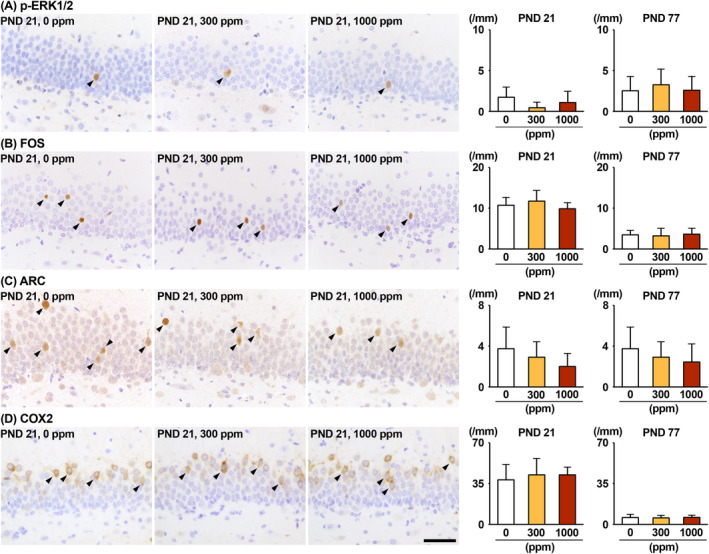
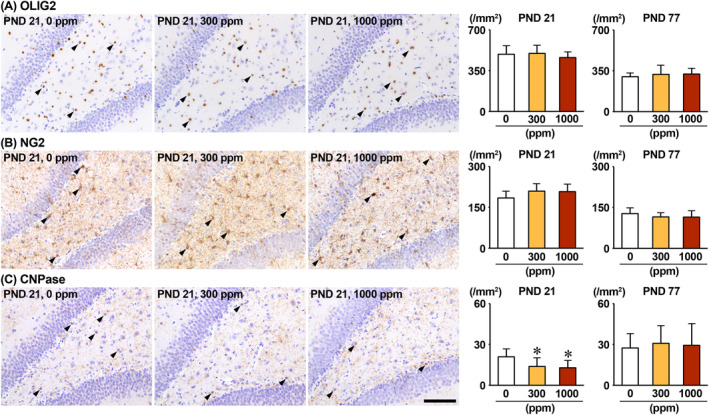
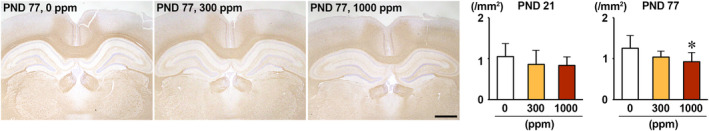
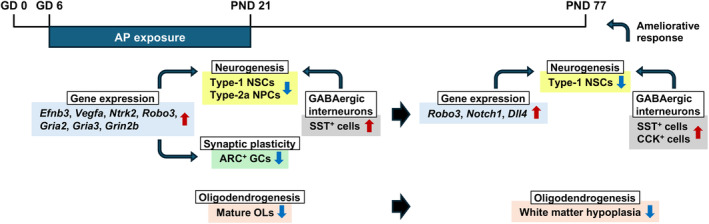
The environmental contaminant perchlorate raises concern for hypothyroidism-related brain disorders in children. This study investigated the effects of developmental perchlorate exposure on hippocampal neurogenesis and oligodendrocyte (OL) development. Pregnant Sprague-Dawley rats were administered with ammonium perchlorate (AP) in drinking water at concentrations of 0 (control), 300, and 1000 ppm from gestation day 6 until weaning [postnatal day (PND) 21]. On PND 21, offspring displayed decreased serum triiodothyronine and thyroxine concentrations at 1000 ppm and thyroid follicular epithelial cell hyperplasia at ≥300 ppm (accompanying increased proliferation activity at 1000 ppm). Hippocampal neurogenesis indicated suppressed proliferation of neurogenic cells at ≥300 ppm, causing decreases in type-1 neural stem cells (NSCs) and type-2a neural progenitor cells. In addition, an increase of SST+ GABAergic interneurons and decreasing trend for ARC+ granule cells were observed at 1000 ppm. CNPase+ mature OLs were decreased in number in the dentate gyrus hilus at ≥300 ppm. At PND 77, thyroid changes had disappeared; however, the decrease of type-1 NSCs and increase of SST+ interneurons persisted, CCK+ interneurons were increased, and white matter tissue area was decreased at 1000 ppm. Obtained results suggest an induction of hypothyroidism causing suppressed hippocampal neurogenesis (targeting early neurogenic processes and decreased synaptic plasticity of granule cells involving ameliorative interneuron responses) and suppressed OL maturation during the weaning period. In adulthood, suppression of neurogenesis continued, and white matter hypoplasia was evident. Observed brain changes were similar to those caused by developmental hypothyroidism, suggesting that AP-induced developmental neurotoxicity was due to hypothyroidism.

Keywords: ammonium perchlorate; developmental neurotoxicity; hippocampal neurogenesis; hypothyroidism; oligodendrogenesis.


Conflict of interest statement

The authors declare no conflicts of interest.

Figures

FIGURE 1
FIGURE 1
(A) Body weight, (B) food consumption, and (C) water consumption of dams during the exposure period. *p < 0.05, **p < 0.01, compared with the 0‐ppm controls by Dunnett's test or Aspin–Welch's t‐test with Bonferroni correction.
FIGURE 2
FIGURE 2
(A) Histopathological changes in the thyroid on postnatal day (PND) 21, (B) changes in serum thyroid hormone levels on PND 21, and (C) distribution of immunoreactive cells for proliferating cell nuclear antigen (PCNA) in the thyroid on PND 21 and PND 77 in female offspring after developmental exposure to ammonium perchlorate. Representative images from the 0‐ppm controls (left), 300‐ppm group (middle), and 1000‐ppm group (right). Arrowheads indicate representative immunoreactive cells. Magnification ×400; bar 50 μm. (C) Graphs show the numbers of immunoreactive cells. *p < 0.05, **p < 0.01, compared with the 0‐ppm controls by Dunnett's test or Aspin–Welch's t‐test with Bonferroni correction.
FIGURE 3
FIGURE 3
Distribution of immunoreactive cells for (A) glial fibrillary acidic protein (GFAP), (B) SRY‐box transcription factor 2 (SOX2), (C) T‐box brain protein 2 (TBR2), (D) doublecortin (DCX), (E) tubulin, beta 3 class III (TUBB3), and (F) neuronal nuclei (NeuN) in the subgranular zone (SGZ) and/or granule cell layer (GCL) of the hippocampal dentate gyrus of male offspring on postnatal day (PND) 21 and PND 77 after developmental exposure to ammonium perchlorate. Representative images from the 0‐ppm controls (left), 300‐ppm group (middle), and 1000‐ppm group (right). Arrowheads indicate representative immunoreactive cells. Magnification ×400; bar 50 μm. Graphs show the numbers of immunoreactive cells in the SGZ and/or GCL. N = 10/group, except for N = 9 in 300‐ppm for TUBB3 and NeuN, and in 1000‐ppm group for SOX2 and TBR2, and N = 8 in 1000‐ppm group for NeuN at PND 21. *p < 0.05, **p < 0.01, compared with the 0‐ppm controls by Dunnett's test or Aspin–Welch's t‐test with Bonferroni correction.
FIGURE 4
FIGURE 4
Distribution of (A) proliferating cell nuclear antigen (PCNA)+ proliferating cells and (B) terminal deoxynucleotidyl transferase dUTP nick end labeling (TUNEL)+ apoptotic cells in the subgranular zone (SGZ) of the hippocampal dentate gyrus of male offspring on postnatal day (PND) 21 and PND 77 after developmental exposure to ammonium perchlorate. Representative images from the 0‐ppm controls (left), 300‐ppm group (middle), and 1000‐ppm group (right). Arrowheads indicate representative immunoreactive cells. Magnification ×400; bar 50 μm. Graphs show the numbers of immunoreactive cells in the SGZ. N = 10/group. **p < 0.01, compared with the 0‐ppm controls by Dunnett's test or Aspin–Welch's t‐test with Bonferroni correction.
FIGURE 5
FIGURE 5
Distribution of immunoreactive cells for (A) cholecystokinin (CCK8), (B) somatostatin (SST), (C) reelin (RELN), (D) parvalbumin (PVALB), (E) calbindin‐D‐29K (CALB2), (F) glutamic acid decarboxylase 67 (GAD67), and (G) glutamate ionotropic receptor AMPA type subunit 2 (GluR2) in the hilus of the hippocampal dentate gyrus of male offspring on postnatal day (PND) 21 and PND 77 after developmental exposure to ammonium perchlorate. Representative images from the 0‐ppm controls (left), 300‐ppm group (middle), and 1000‐ppm group (right). Arrowheads indicate representative immunoreactive cells. Magnification ×200; bar 100 μm. Graphs show the numbers of immunoreactive cells in the hilus area. N = 10/group. *p < 0.05, **p < 0.01, compared with the 0‐ppm controls by Dunnett's test or Aspin–Welch's t‐test with Bonferroni correction.
FIGURE 6
FIGURE 6
Distribution of immunoreactive cells for (A) phosphorylated extracellular signal‐regulated kinase 1/2 (p‐ERK1/2), (B) Fos proto‐oncogene, AP‐1 transcription factor subunit (FOS), (C) activity‐regulated cytoskeleton‐associated protein (ARC), and (D) cyclooxygenase‐2 (COX2) in the subgranular zone (SGZ) of the hippocampal dentate gyrus of male offspring on postnatal day (PND) 21 and PND 77 after developmental exposure to ammonium perchlorate. Representative images from the 0‐ppm controls (left), 300‐ppm group (middle), and 1000‐ppm group (right). Arrowheads indicate representative immunoreactive cells. Magnification ×400; bar 50 μm. Graphs show the numbers of immunoreactive cells in the hilus area. N = 10/group, except for N = 9 for ARC and N = 8 for COX2 in 1000‐ppm group at PND 21.
FIGURE 7
FIGURE 7
Distribution of immunoreactive cells for (A) glial fibrillary acidic protein (GFAP), (B) ionized calcium‐binding adapter molecule 1 (Iba1), (C) cluster of differentiation (CD) 68, and (D) CD163 in the hilus of the hippocampal dentate gyrus of male offspring on postnatal day (PND) 21 and PND 77 after developmental exposure to ammonium perchlorate. Representative images from the 0‐ppm controls (left), 300‐ppm group (middle), and 1000‐ppm group (right). Arrowheads indicate representative immunoreactive cells. Magnification ×200; bar 100 μm. Graphs show the numbers of immunoreactive cells in the hilus area. N = 10/group, except for N = 9 in 300‐ppm group for GFAP and in 1000‐ppm group for GFAP, Iba1, CD68, and CD163 at PND 21.
FIGURE 8
FIGURE 8
Distribution of immunoreactive cells for (A) oligodendrocyte transcription factor 2 (OLIG2), (B) NG2 chondroitin sulfate proteoglycan (NG2), and (C) 2′,3′‐cyclic‐nucleotide 3′‐phosphodiesterase (CNPase) in the hilus of the hippocampal dentate gyrus of male offspring on postnatal day (PND) 21 and PND 77 after developmental exposure to ammonium perchlorate. Representative images from the 0‐ppm controls (left), 300‐ppm (middle), and 1000‐ppm (right) groups. Arrowheads indicate representative immunoreactive cells. Magnification ×200; bar 100 μm. Graphs show the numbers of immunoreactive cells in the hilus area. N = 10/group. *p < 0.05, compared with the 0‐ppm controls by Dunnett's test or Aspin–Welch's t‐test with Bonferroni correction.
FIGURE 9
FIGURE 9
Morphometrical measurement of the combined area of the corpus callosum and adjacent cingulum bundle of the cerebral hemisphere using immunostained slides for 2′,3′‐cyclic‐nucleotide 3′‐phosphodiesterase in male offspring on postnatal day (PND) 21 and PND 77. Representative images from the 0‐ppm controls (left), 300‐ppm (middle), and 1000‐ppm (right) groups. Magnification ×12.5; bar 1 mm. Graph shows measured area. N = 10/group. *p < 0.05, compared with the 0‐ppm controls by Dunnett's test or Aspin–Welch's t‐test with Bonferroni correction.
FIGURE 10
FIGURE 10
Schematic presentation of maternal exposure effects of ammonium perchlorate in rats.

Similar articles

References

    1. Alcaide Martin A. and Mayerl S., “Local Thyroid Hormone Action in Brain Development,” International Journal of Molecular Sciences 24, no. 15 (2023): 12352, 10.3390/ijms241512352. - DOI - PMC - PubMed
    1. Foster J. R., Tinwell H., and Melching‐Kollmuss S., “A Review of Species Differences in the Control of, and Response to, Chemical‐Induced Thyroid Hormone Perturbations Leading to Thyroid Cancer,” Archives of Toxicology 95, no. 3 (2021): 807–836, 10.1007/s00204-020-02961-6. - DOI - PubMed
    1. Long K. L. P., Breton J. M., Barraza M. K., Perloff O. S., and Kaufer D., “Hormonal Regulation of Oligodendrogenesis I: Effects Across the Lifespan,” Biomolecules 11, no. 2 (2021): 283, 10.3390/biom11020283. - DOI - PMC - PubMed
    1. Shibutani M., Woo G. H., Fujimoto H., et al., “Assessment of Developmental Effects of Hypothyroidism in Rats From in Utero and Lactation Exposure to Anti‐Thyroid Agents,” Reproductive Toxicology 28, no. 3 (2009): 297–307, 10.1016/j.reprotox.2009.04.011. - DOI - PubMed
    1. Marty M. S., Sauer U. G., Charlton A., et al., “Towards a Science‐Based Testing Strategy to Identify Maternal Thyroid Hormone Imbalance and Neurodevelopmental Effects in the Progeny‐Part III: How Is Substance‐Mediated Thyroid Hormone Imbalance in Pregnant/Lactating Rats or Their Progeny Related to Neurodevelopmental Effects?” Critical Reviews in Toxicology 52, no. 7 (2022): 546–617, 10.1080/10408444.2022.2130166. - DOI - PubMed

LinkOut - more resources