. 2024 Oct 4;23(10):4392-4408.
doi: 10.1021/acs.jproteome.4c00363. Epub 2024 Sep 9.

A Framework for Quality Control in Quantitative Proteomics

Affiliations

A Framework for Quality Control in Quantitative Proteomics

Kristine A Tsantilas et al. J Proteome Res. .

Abstract

A thorough evaluation of the quality, reproducibility, and variability of bottom-up proteomics data is necessary at every stage of a workflow, from planning to analysis. We share vignettes applying adaptable quality control (QC) measures to assess sample preparation, system function, and quantitative analysis. System suitability samples are repeatedly measured longitudinally with targeted methods, and we share examples where they are used on three instrument platforms to identify severe system failures and track function over months to years. Internal QCs incorporated at the protein and peptide levels allow our team to assess sample preparation issues and to differentiate system failures from sample-specific issues. External QC samples prepared alongside our experimental samples are used to verify the consistency and quantitative potential of our results during batch correction and normalization before assessing biological phenotypes. We combine these controls with rapid analysis (Skyline), longitudinal QC metrics (AutoQC), and server-based data deposition (PanoramaWeb). We propose that this integrated approach to QC is a useful starting point for groups to facilitate rapid quality control assessment to ensure that valuable instrument time is used to collect the best quality data possible. Data are available on Panorama Public and ProteomeXchange under the identifier PXD051318.

Keywords: DDA; DIA; PRM; liquid chromatography; mass spectrometry; proteomics; quality control; quantitative results; sample preparation; system suitability.


Conflict of interest statement

Conflict of interest statement

The authors declare the following competing financial interest(s): The MacCoss Lab at the University of Washington has a sponsored research agreement with Thermo Fisher Scientific, the manufacturer of the instrumentation used in this research. M.J.M. is a paid consultant for Thermo Fisher Scientific. J.D.C. is an employee of Thermo Fisher Scientific

Figures

Figure 1:
Figure 1:
We use three categories of quality controls (QC) in our proteomics experiments: system suitability, internal QCs, and external QC samples (A). The system suitability control is used to verify that the LC-MS system is functioning before and throughout sample data acquisition. Internal QCs are added to experimental samples to assess protein and peptide-level deviations in sample processing as well as instrument function. External QC samples are additional samples prepared alongside experimental samples to monitor sample processing and batch effects. These samples are ideally formulated by pooling the experimental samples and are prepared multiple times within a batch. They also contain the same internal QCs used in experimental samples. External QC samples can serve two functions: to assess the sample preparation workflow, or to evaluate normalization methods. In the context of a workflow (B), internal and external QC samples must be planned for and incorporated beginning with sample collection and processing. Before performing any data analysis, the variance of internal and external QC samples are examined. In combination, these controls can be used to evaluate sample processing and quantitative results within an experiment, as well as the LC-MS system function during an experiment and longitudinally over years.
Figure 2:
Figure 2:. Monitoring LC-MS system performance longitudinally.
System suitability tests are targeted (PRM) runs tracking the LC-MS response of consistent quantities of control peptides before, during, and after experimental runs. Raw data files are automatically uploaded and viewed online using Skyline with Panorama AutoQC. This facilitates longitudinal assessment of the system’s function via numerous metrics including precursor area, transition area, precursor/transition area ratios, retention time, mass accuracy, and more. This approach can be used to identify functional deficits that are not always apparent in the standard approach that simply monitors DDA peptide identification counts. We show system suitability runs from an Orbitrap Eclipse Tribrid from March 1, 2022 - April 10, 2022 including the instrument operator annotations and two experimental metrics: (A) the transition area of individual runs and (B) the trailing CV of the previous 5 replicates. A column and operator change occurred on March 13 (orange and blue “X”s). The transition area (A) and precursor area (not shown) dropped starting the morning of March 21st (first black “X”). The instrument operator postulated there was an issue with the LC solvents, but queued up system suitability runs to confirm the system decline. The trailing CV also clearly showed the change in the transition area (B) and precursor area (not shown). After several hours when performance had not improved, the sample pump buffer was replaced (Second black “X”). Shortly after, the system stabilized. On April 1, routine maintenance to clean the quadrupole was performed and a new set of runs were started.
Figure 3:
Figure 3:. DDA spectral counting and peptide identifications fail to detect severe instrument failure.
An Orbitrap Fusion exhibited inconsistent data collection for years. Typically, after cleaning various ion optics the system performance would be evaluated using DDA spectral counting and targeted PRM methods. Three different sessions spanning approximately 16 months from this time are shown to illustrate why targeted (PRM) system suitability runs were adopted. Major periods of maintenance in close proximity to these runs are shown in (A). We frequently, but inconsistently, observed the loss of 13C isotope peaks M+1 and M+2 precursors in the MS1 chromatograms of peptides in our PRM system suitability tests. The idotp values are printed on the chromatograms. Many peptides exhibited these issues during this time, but one representative replicate of GLILVGGYGTR (B) and LVNELTEFAK (C) are shown for brevity. Cleaning the optics in April 2015 only seemed to make the PRM chromatograms (B and C, second panels) worse. At the same time, DDA-identified PSMs increased (D) and identified peptides decreased slightly (E). The total area fragment of GLILVGGYGTR (F) and LVNELTEFAK (G) did not improve. In 2016, additional ion optics were cleaned (A). Most notable was some build up on the bent quad (q0) that was removed. At that point, the system began to improve, and we saw signal intensities improve in the 2016 batches in the DDA (D) and PRM (B-G) runs. However, it was clear that the underlying hardware issue had not been resolved as we still observed inconsistent, seemingly random loss of M+1 and M+2 signal in 2016 while the DDA-derived PSMs and peptide identifications continued to climb, suggesting these approaches do not serve to capture even significant instrumentation issues.
Figure 4:
Figure 4:. Internal QCs added to experimental samples are used to assess the entire process from lysis to LC-MS.
Four different sample preparation protocols were tested - two SP3 variants (1BD and 2BD), S-trap (STR), and in-solution (ISD). All the samples were spiked with ENO as the protein internal QC to evaluate the overall processing. The transition peak area of VNQIGTLSESIK is shown here. The run order for the 8 replicates from each condition were randomized, as shown in panel (A). At inconsistent intervals, numerous samples were missing ENO peptides, whereas the PRTC peptides looked normal (Supplementary Figure 1). The cause of the missing enolase peptides became clear when the samples were grouped by sample preparation (B), revealing that there was an issue with the ISD sample preparation method. We later found that our Rapigest stock, which was one of the only reagents different between the four protocols, was expired and could have hindered denaturation, and thus digestion, in the ISD samples.
Figure 5:
Figure 5:. The two internal QCs can help distinguish between sample preparation versus LC-MS problems.
In a series of plasma samples analyzed on an Eclipse Tribrid, one injection denoted 7 was found to have a reduced peak intensity and altered retention time across all of the internal QC peptides. One peptide from each control is shown here for brevity. In ENO, AVDDFLISLDGTANK transition areas were reduced (A), chromatography was poor (C), and the retention time was shifted (G). GLILVGGYGTR from PRTC shared a reduction in peak area (B), poor chromatography (E), and shifted retention time (H). Upon manual inspection of the LC after injection 7, the instrument operator determined that the outlet line coming from the injection valve had partially clogged. Once the repair was completed, three system suitability injections (not shown) were found to be stable and with comparable signal intensity to before the clogged line. Another sample was injected (08) and then the previous sample was reinjected into the system and is shown as 9. The transition peak areas and chromatography of AVDDFLISLDGTANK (A, D) and GLILVGGYGTR (B, F) were normal relative to the previous samples, and the retention times were again in line with other samples (G, H).
Figure 6:
Figure 6:
Combining system suitability injections and sample internal QCs facilitate real-time monitoring of the system. On an Orbitrap Lumos Tribrid, a significant turbo failure led to months of inconsistent and unpredictable data collection. A rough summary of the major maintenance steps during 5 months of troubleshooting post-turbo failure are shown here (A). Between August - December, signal intensity would unpredictably begin decreasing with each injection of two different run types. Four PRTC peptides from system suitability runs (B, white background) and sample internal QCs (B, grey background) illustrate this in four different experimental batches. Only a subset of all runs are shown here to improve visibility, but the trends are representative. The full dataset including all runs for PRTC, ENO, and BSA are available on Panorama. In August, after 7 sample injections (IQC001-IQC007) and 5 system suitability injections (SS001-SS005) the system was found to be stable. As additional samples were run (IQC009-IQC015), the signal intensity dropped significantly. This reduced performance was confirmed with system suitability injections (SS006-SS017). The system was taken offline. Additional metal debris from the turbo failure that was missed in earlier maintenance was removed, and the front optics and quads were cleaned. After calibration, the same issue of rapidly declining signal was observed in mid-October (SS018-IQC023). After taking the system down and cleaning the optics again, the system seemed stable for 75 runs (SS026-SS037) until the signal intensity declined rapidly while running samples IQC097-IQC103. The system was taken down again. In late November metal debris was found lodged in the C-trap, and it was replaced along with another thorough cleaning. We then observed a return to expected signal stability and intensity (SS038 through SS046) relative to matched sample batches run prior to the system failing.
Figure 7:
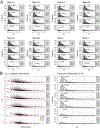
Figure 7:. Assessment of quantitative results using median normalization and batch correction of inter-batch external QC samples.
(Top panel or 7A) The effect of median normalization and batch correction of peptide and protein coefficient of variance (CV) from all the pooled lumbar CSF inter-batch external QC samples within each plate (batch). The median coefficient of variation (η) is indicated by the dashed red line. (Bottom panel or 7B) The effect of median normalization and batch correction of peptide and protein coefficient of variance from all the pooled lumbar CSF inter-batch external QC samples from all plates. The relationship between coefficient of variation and the log2 median abundance is visualized with a LOESS fit of a contoured density plot (red line).

Update of

References

    1. Tabb DL Quality Assessment for Clinical Proteomics. Clin. Biochem 2013, 46 (6), 411–420. 10.1016/j.clinbiochem.2012.12.003. - DOI - PMC - PubMed
    1. Paulovich AG; Whiteaker JR; Hoofnagle AN; Wang P The Interface between Biomarker Discovery and Clinical Validation: The Tar Pit of the Protein Biomarker Pipeline. Proteomics - Clin. Appl 2008, 2 (10–11), 1386–1402. 10.1002/prca.200780174. - DOI - PMC - PubMed
    1. Parker CE; Borchers CH Mass Spectrometry Based Biomarker Discovery, Verification, and Validation - Quality Assurance and Control of Protein Biomarker Assays. Mol. Oncol 2014, 8 (4), 840–858. 10.1016/j.molonc.2014.03.006. - DOI - PMC - PubMed
    1. Grant RP; Hoofnagle AN From Lost in Translation to Paradise Found: Enabling Protein Biomarker Method Transfer by Mass Spectrometry. Clin. Chem 2014, 60 (7), 941–944. 10.1373/clinchem.2014.224840. - DOI - PMC - PubMed
    1. Piehowski PD; Petyuk VA; Orton DJ; Xie F; Moore RJ; Ramirezrestrepo M; Engel A; Lieberman AP; Albin RL; Camp DG; Smith RD; Myers AJ Sources of Technical Variability in Quantitative LC - MS Proteomics: Human Brain Tissue Sample Analysis. J. Proteome Res 2013, 12, 2128–2137. 10.1021/pr301146m. - DOI - PMC - PubMed

LinkOut - more resources