

APOBEC family reshapes the immune microenvironment and therapy sensitivity in clear cell renal cell carcinoma
- PMID: 39249558
- PMCID: PMC11383847
- DOI: 10.1007/s10238-024-01465-2
APOBEC family reshapes the immune microenvironment and therapy sensitivity in clear cell renal cell carcinoma
Abstract
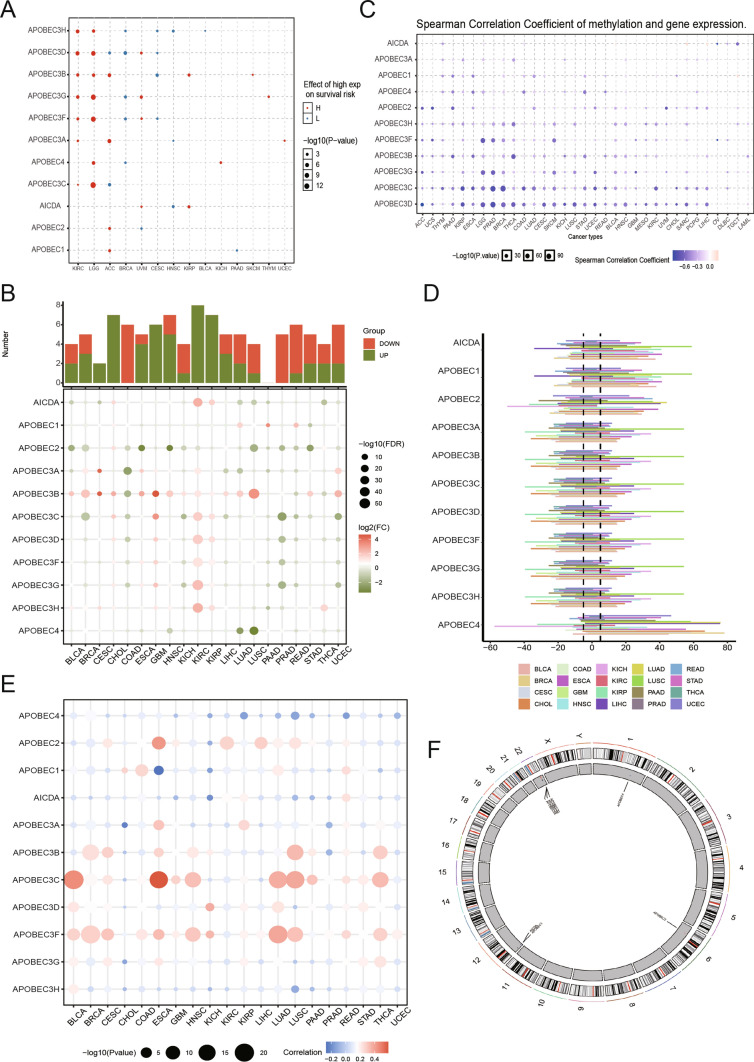
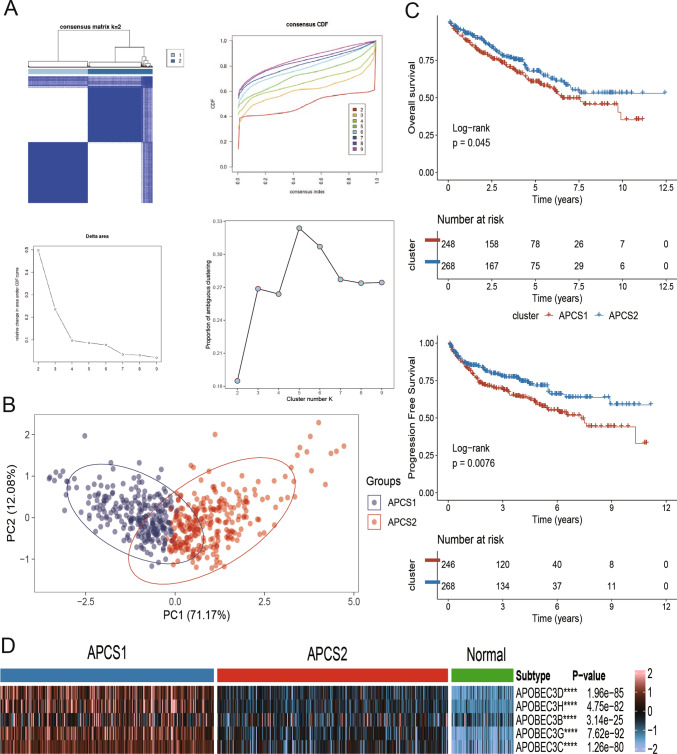
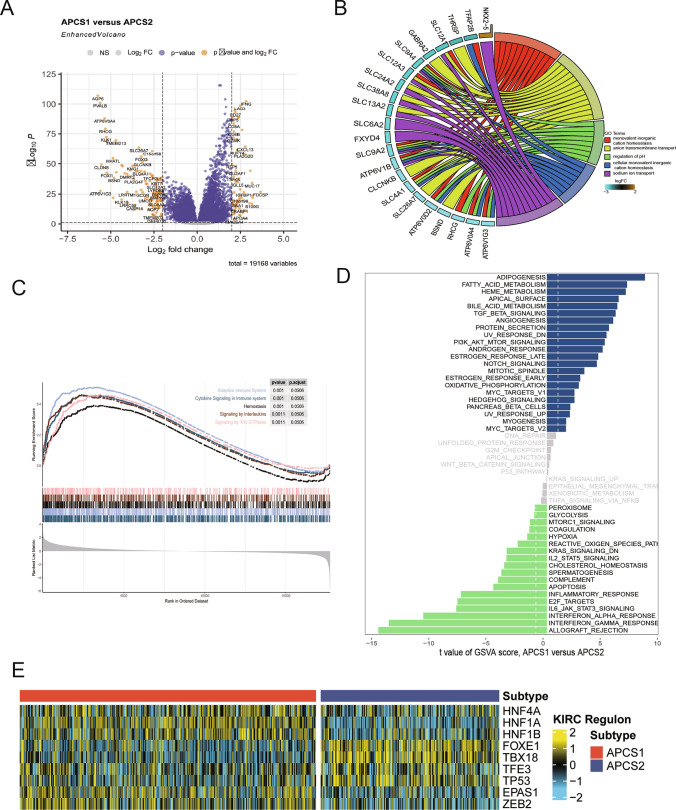
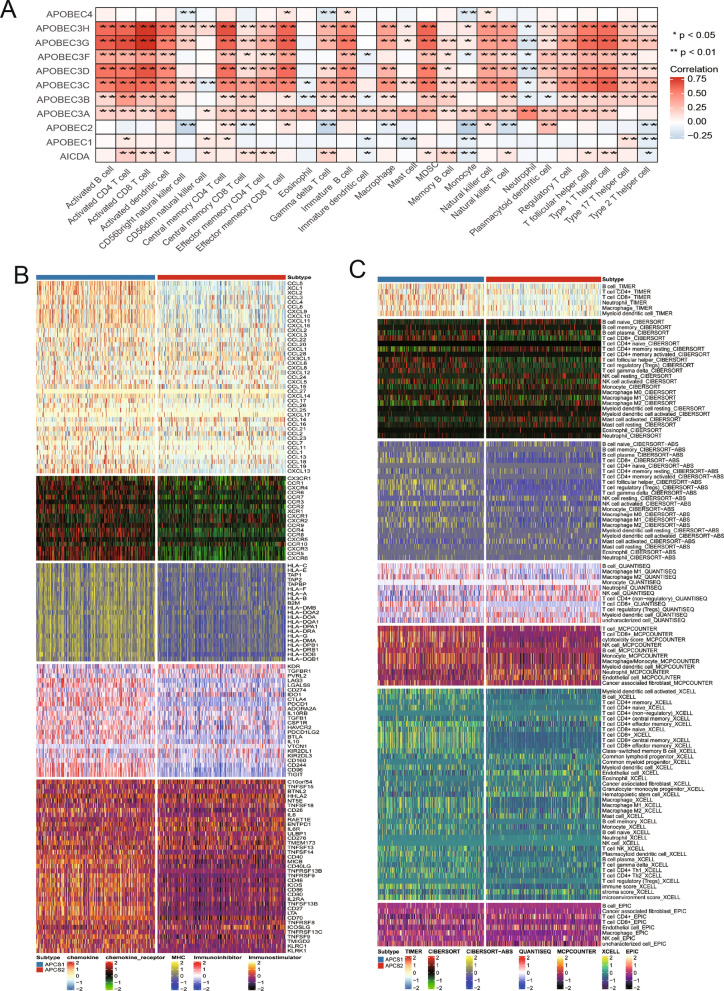
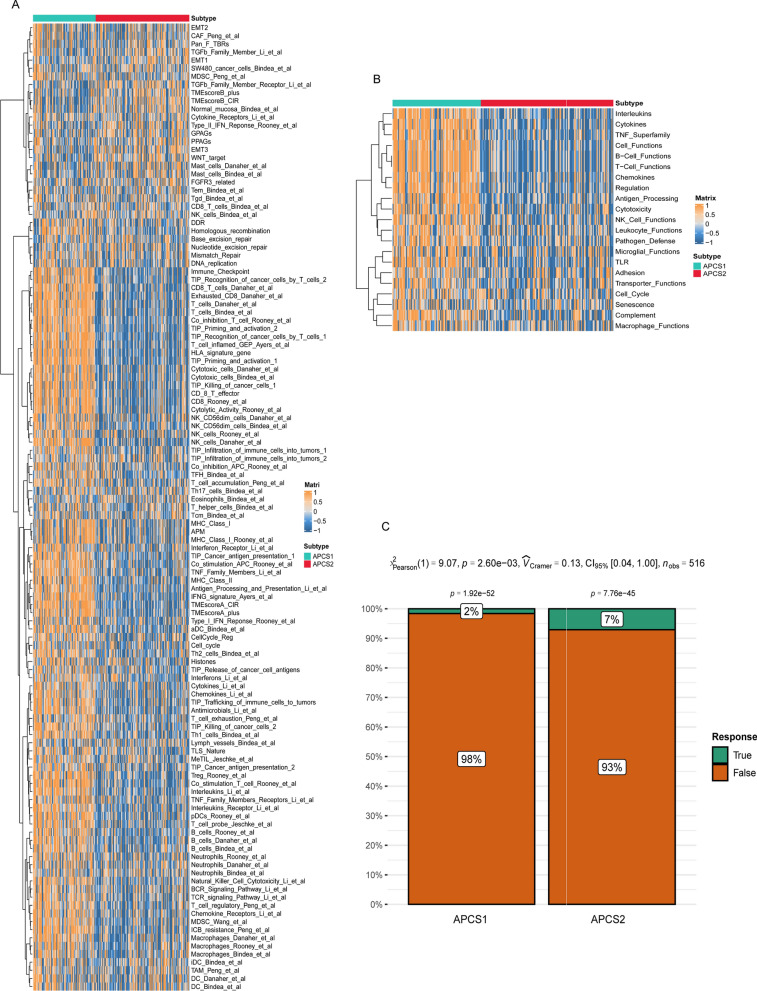
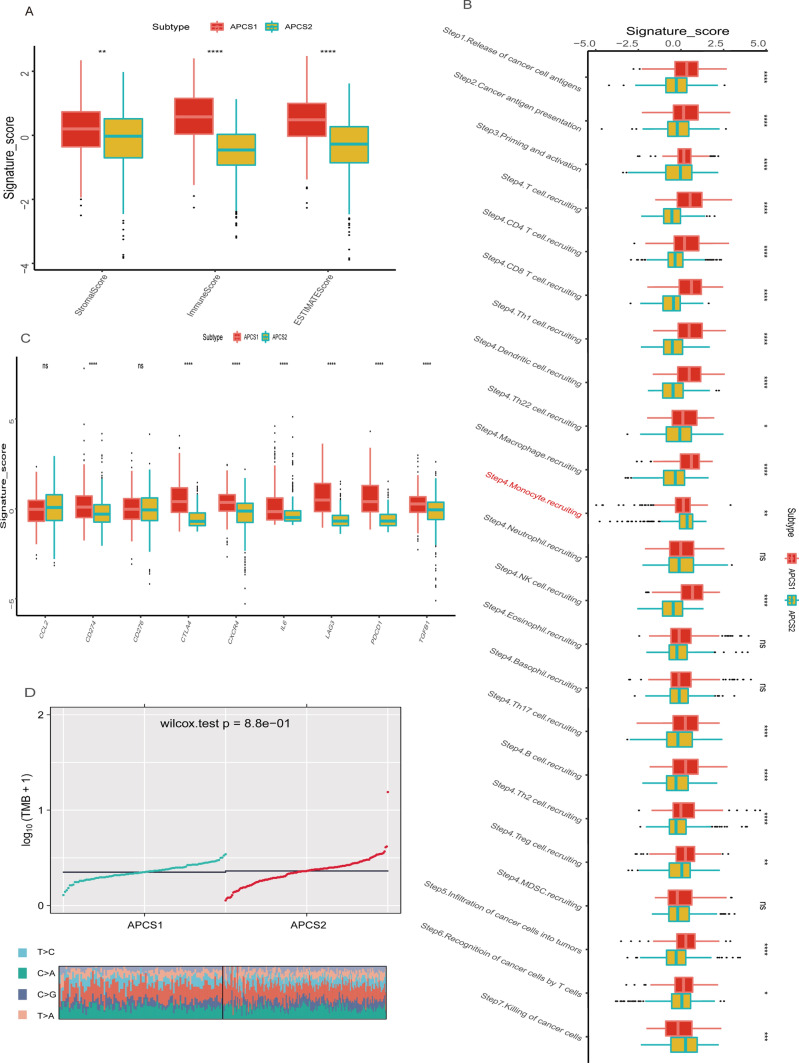
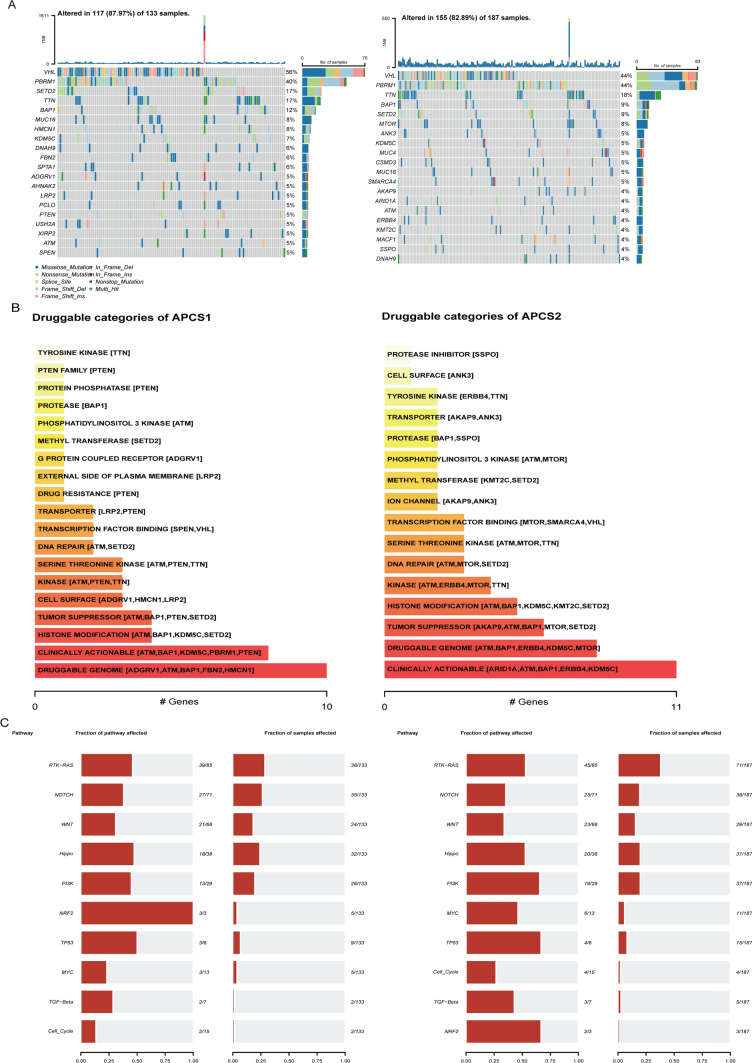
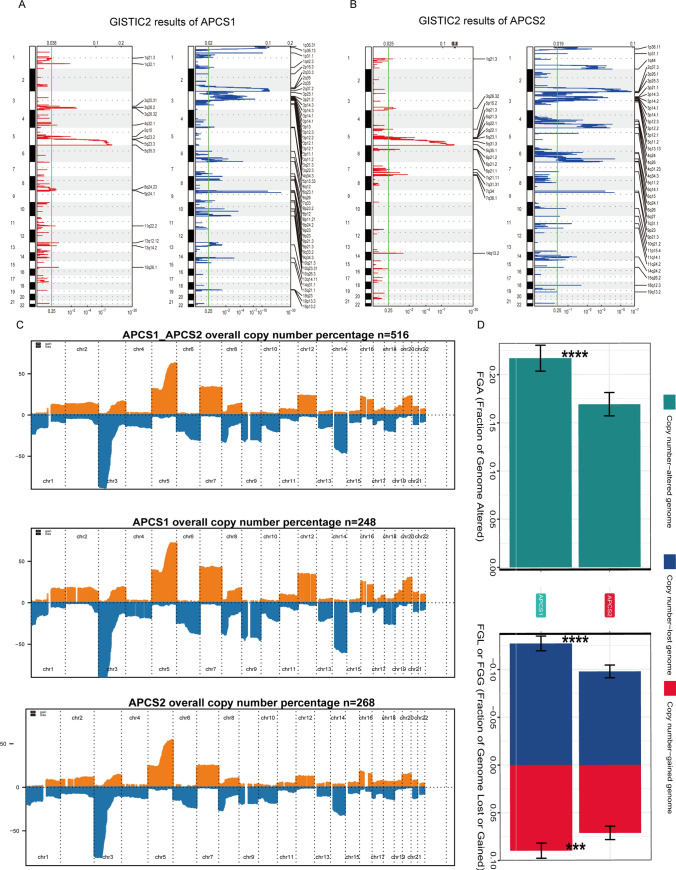
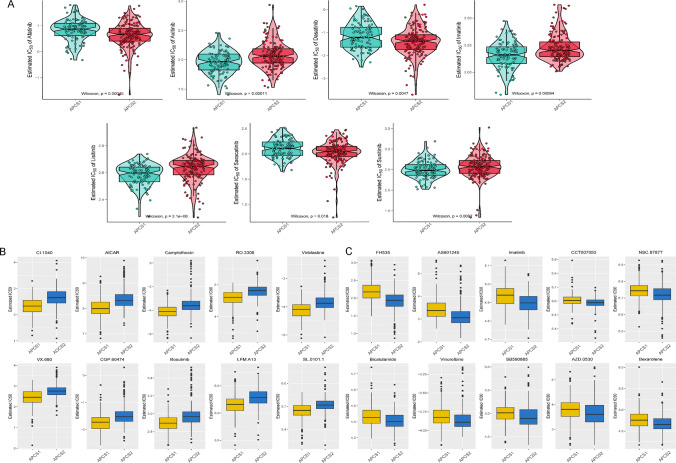
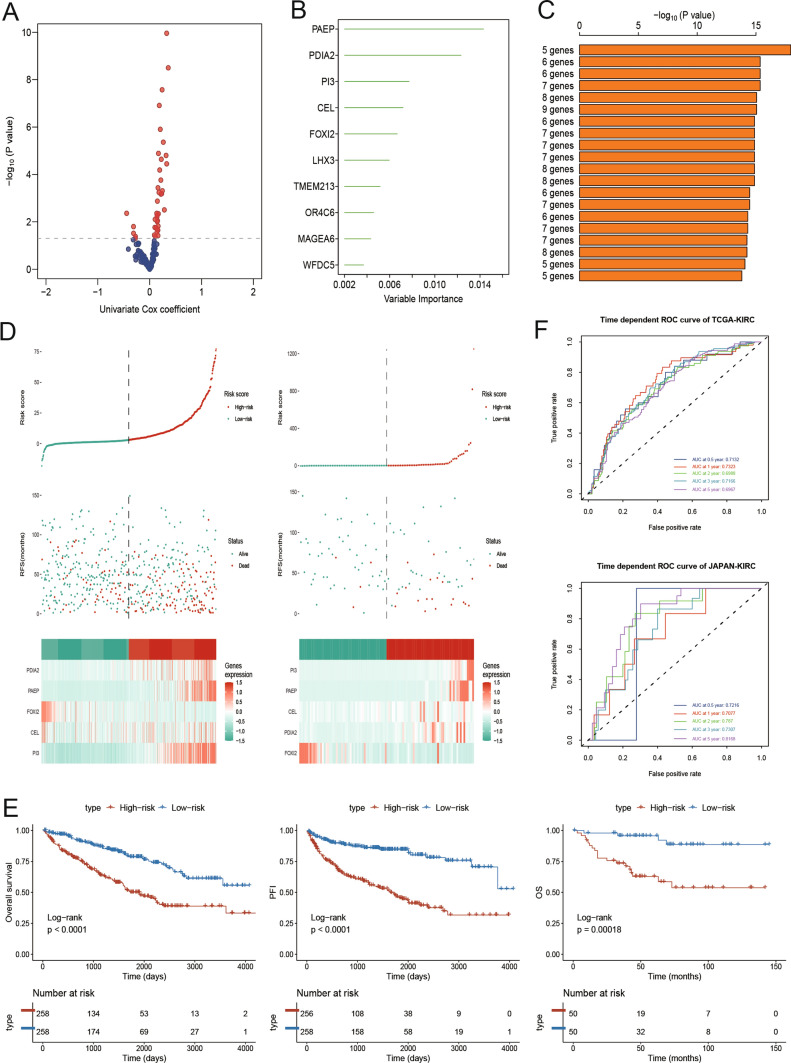
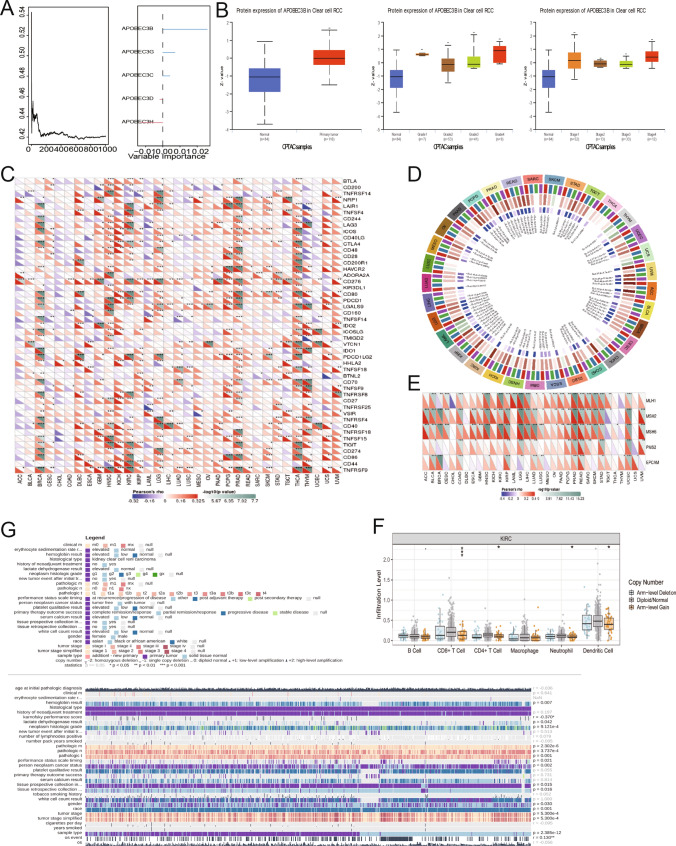
Emerging evidence suggests that the APOBEC family is implicated in multiple cancers and might be utilized as a new target for cancer detection and treatment. However, the dysregulation and clinical implication of the APOBEC family in clear cell renal cell cancer (ccRCC) remain elusive. TCGA multiomics data facilitated a comprehensive exploration of the APOBEC family across cancers, including ccRCC. Remodeling analysis classified ccRCC patients into two distinct subgroups: APOBEC family pattern cancer subtype 1 (APCS1) and subtype 2 (APCS2). The study investigated differences in clinical parameters, tumor immune microenvironment, therapeutic responsiveness, and genomic mutation landscapes between these subtypes. An APOBEC family-related risk model was developed and validated for predicting ccRCC patient prognosis, demonstrating good sensitivity and specificity. Finally, the overview of APOBEC3B function was investigated in multiple cancers and verified in clinical samples. APCS1 and APCS2 demonstrated considerably distinct clinical features and biological processes in ccRCC. APCS1, an aggressive subtype, has advanced clinical stage and a poor prognosis. APCS1 exhibited an oncogenic and metabolically active phenotype. APCS1 also exhibited a greater tumor mutation load and immunocompromised condition, resulting in immunological dysfunction and immune checkpoint treatment resistance. The genomic copy number variation of APCS1, including arm gain and loss, was much more than that of APCS2, which may help explain the tired immune system. Furthermore, the two subtypes have distinct drug sensitivity patterns in clinical specimens and matching cell lines. Finally, we developed a predictive risk model based on subtype biomarkers that performed well for ccRCC patients and validated the clinical impact of APOBEC3B. Aberrant APOBEC family expression patterns might modify the tumor immune microenvironment by increasing the genome mutation frequency, thus inducing an immune-exhausted phenotype. APOBEC family-based molecular subtypes could strengthen the understanding of ccRCC characterization and guide clinical treatment. Targeting APOBEC3B may be regarded as a new therapeutic target for ccRCC.
Keywords: APOBEC family; Clear cell renal cell carcinoma; Machine learning; Molecular subtypes; Multiomics; Tumor immunity.
© 2024. The Author(s).
Conflict of interest statement
The authors declare no competing interests.
Figures
References
MeSH terms
Substances
Grants and funding
- 81902560,81730073, 81872074/The National Natural Science Foundation of China
- 81902560,81730073, 81872074/The National Natural Science Foundation of China
- 81902560,81730073, 81872074/The National Natural Science Foundation of China
- 81902560,81730073, 81872074/The National Natural Science Foundation of China
- 2018YFA0108300/The China National Key Research and Development Program Stem Cell and Translational Research Key Projects
- 2018YFA0108300/The China National Key Research and Development Program Stem Cell and Translational Research Key Projects
- 2018YFA0108300/The China National Key Research and Development Program Stem Cell and Translational Research Key Projects
- 2018YFA0108300/The China National Key Research and Development Program Stem Cell and Translational Research Key Projects
LinkOut - more resources
Full Text Sources
Medical
