. 2024 Sep 17;121(38):e2404191121.
doi: 10.1073/pnas.2404191121. Epub 2024 Sep 9.

Microbial richness and air chemistry in aerosols above the PBL confirm 2,000-km long-distance transport of potential human pathogens

Affiliations

Microbial richness and air chemistry in aerosols above the PBL confirm 2,000-km long-distance transport of potential human pathogens

Xavier Rodó et al. Proc Natl Acad Sci U S A. .

Abstract

The existence of viable human pathogens in bioaerosols which can cause infection or affect human health has been the subject of little research. In this study, data provided by 10 tropospheric aircraft surveys over Japan in 2014 confirm the existence of a vast diversity of microbial species up to 3,000 m height, which can be dispersed above the planetary boundary layer over distances of up to 2,000 km, thanks to strong winds from an area covered with massive cereal croplands in Northeast (NE) Asia. Microbes attached to aerosols reveal the presence of diverse bacterial and fungal taxa, including potential human pathogens, originating from sewage, pesticides, or fertilizers. Over 266 different fungal and 305 bacterial genera appeared in the 10 aircraft transects. Actinobacteria, Bacillota, Proteobacteria, and Bacteroidetes phyla dominated the bacteria composition and, for fungi, Ascomycota prevailed over Basidiomycota. Among the pathogenic species identified, human pathogens include bacteria such as Escherichia coli, Serratia marcescens, Prevotella melaninogenica, Staphylococcus epidermidis, Staphylococcus haemolyticus, Staphylococcus saprophyticus, Cutibacterium acnes, Clostridium difficile, Clostridium botulinum, Stenotrophomonas maltophilia, Shigella sonnei, Haemophillus parainfluenzae and Acinetobacter baumannii and health-relevant fungi such as Malassezia restricta, Malassezia globosa, Candida parapsilosis and Candida zeylanoides, Sarocladium kiliense, Cladosporium halotolerans, and Cladosporium herbarum. Diversity estimates were similar at heights and surface when entrainment of air from high altitudes occurred. Natural antimicrobial-resistant bacteria (ARB) cultured from air samples were found indicating long-distance spread of ARB and microbial viability. This would represent a novel way to disperse both viable human pathogens and resistance genes among distant geographical regions.

Keywords: ARG; aerosols; long-distance transport; microbes; pathogens.


Conflict of interest statement

Competing interests statement:The authors declare no competing interest.

Figures

Fig. 1.
Fig. 1.
Sampling and analysis pipeline for collected air samples. Flight and ground campaigns were conducted in parallel according to the established sampling schedule in parallel. The flight trajectory was documented. One-eighth of each collected filter was used for DNA extraction, bacterial culture, and major and trace elemental analysis. Comprehensive chemical and biological analysis together with source tracking of air masses was performed.
Fig. 2.
Fig. 2.
Time-height distribution of particles and the PBL over the days of sampling. (A) Average FLEXPART time-altitude 120-h backward simulation for the composite of all 10 flights in 2014 (The X axis denotes hours since 10.000 particleslog10 scalewere thrown at 3 h steps from Tokyo; colors denote concentration of particles in the total column from the surface up to 5 km; see Methods and Analysis). (B) Same as (A) but showing the average lat-lon source dispersion plume simulated from Tokyo. (C) Path covered by the centroid of air mass particles at each time step. Colors denote days. (D) Heights of both the centroid of particles (solid line) and the PBL (dashed line) during the days of sampling. White boxes indicate the times of flights and the color intensity scale, vertical wind speed. Note the downward direction of winds and high speeds lowering the height of the PBL.
Fig. 3.
Fig. 3.
Microbial diversity and richness above the PBL and in the near-surface atmosphere. (A) The taxonomic profile of bacterial and fungal phyla represented as the total number of reads (Top) and relative abundance per sample (Bottom). (B) Two-dimensional nonmetric multidimensional scaling projection depicting the distances between microbial communities at the genus level in various samples. The scatter plot differentiates sample types with color coding (blue for ground, orange for flight) and collection months with symbols (triangles for February, circles for April). Ellipses on the Left panel group flight and ground samples, while those on the Right panel differentiate between February and April collections. PERMANOVA test results for group differences are displayed atop each panel. (C) Variations in alpha-diversity estimators for bacteria and fungi across altitude (Left) and month (Right). Significant differences, identified using an FDR-corrected Wilcoxon Rank-Sum test, are indicated with brackets (*denotes P < 0.05). (D) Number of unique bacterial and fungal genera exclusive to flight or ground samples, or found on both (Left), and unique to February or April samples, or found in both (Right).
Fig. 4.
Fig. 4.
Composition of air microbiome at high altitude and ground atmosphere. (A) Total number of read counts per sample, categorized by collection date. The top 10 most common bacterial and fungal genera are individually color-coded, with the remaining grouped in the “Other” category (blue) and unassigned reads in gray. (B) Relative abundances of the top 30 bacterial and fungal genera recovered from flight and ground samples. The size of each dot reflects the relative abundance of the genus in each sample with color indicating its corresponding class.
Fig. 5.
Fig. 5.
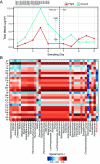
Chemical composition of air masses and associations with airborne microorganisms. (A) Line-graph comparing daily total elemental concentrations in Flight (red) and Ground (blue) samples over the 11 d sampled. (B) Element-Genus Correlation Matrix: Displays Spearman’s r values for the 40 bacterial and fungal genera most correlated (or anticorrelated) with chemical element/compound concentrations. Blue shades represent negative correlations, red shades indicate positive correlations. Cells with a “+” signify P < 0.05, and those with a “*” denote P < 0.01 for the Spearman rank correlation test.
Fig. 6.
Fig. 6.
Pathogenic species distribution across blanks and sample types. On (A) and (B), Average relative abundance of potentially pathogenic bacterial and fungal species identified across samples. Cells highlighted in red showcase the absence of a species in the given sample type, whereas blue cells denote a confirmed presence. On (C) and (D) Dot-plots representing the variability in total pathogen counts on a per-sample basis, distinguishing between bacterial and fungal pathogens, with blue dots for Ground samples and yellow dots for Flight samples. Only species with an average relative abundance of 0.01% or more in at least one of the sample groups are shown.

References

    1. Drautz-Moses D. I., et al. , Vertical stratification of the air microbiome in the lower troposphere. Proc. Natl. Acad. Sci. U.S.A. 119, e2117293119 (2022). - PMC - PubMed
    1. Behzad H., Gojobori T., Mineta K., Challenges and opportunities of airborne metagenomics. Genome Biol. Evol. 7, 1216–1226 (2015). - PMC - PubMed
    1. Klein A. M., Bohannan B. J. M., Jaffe D. A., Levin D. A., Green J. L., Molecular evidence for metabolically active bacteria in the atmosphere. Front. Microbiol. 7, 772 (2016). - PMC - PubMed
    1. Cox M. M., Battista J. R., Deinococcus radiodurans–The consummate survivor. Nat. Rev. Microbiol. 3, 882–892 (2005). - PubMed
    1. Spracklen D. V., Heald C. L., The contribution of fungal spores and bacteria to regional and global aerosol number and ice nucleation immersion freezing rates. Atmos. Chem. Phys. 14, 9051–9059 (2014).

LinkOut - more resources