. 2024 Sep 10;5(1):37.
doi: 10.1186/s43556-024-00200-3.

Gut microbiome influences efficacy of Endostatin combined with PD-1 blockade against colorectal cancer

Affiliations

Gut microbiome influences efficacy of Endostatin combined with PD-1 blockade against colorectal cancer

Jie Xu et al. Mol Biomed. .

Abstract

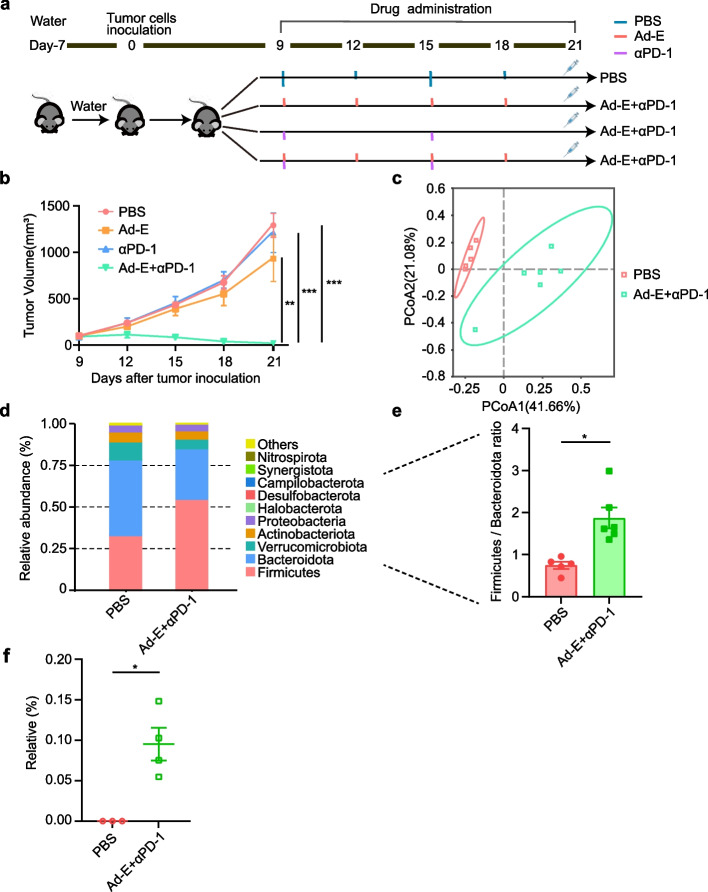
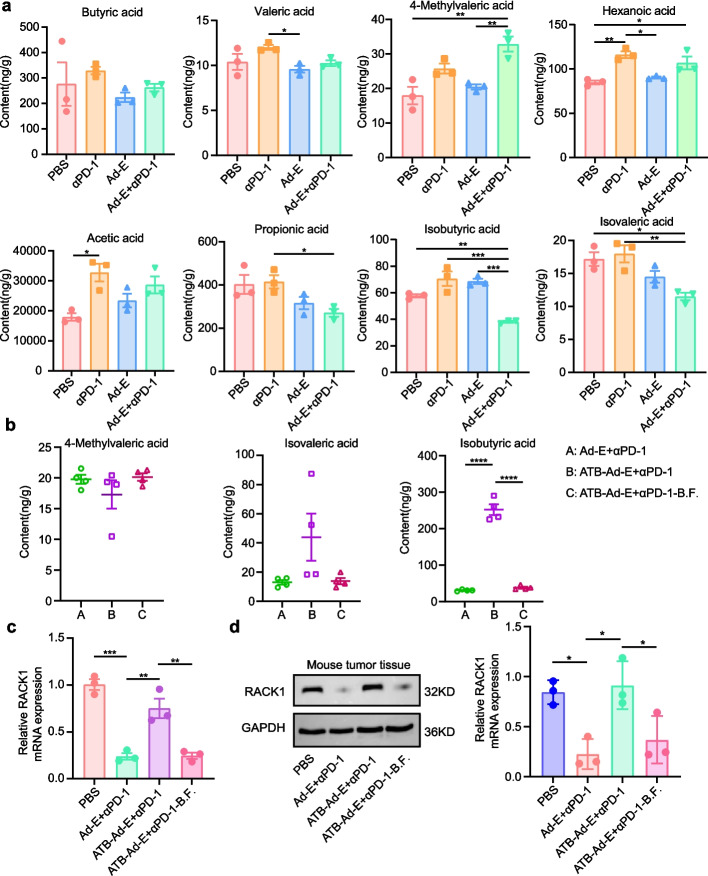
The combination of anti-angiogenic drugs and immune checkpoint inhibitors (ICIs) in the treatment of tumors is emerging as a way to improve ICIs-resistant tumor therapy. In addition, gut microbes (GMs) are involved in angiogenesis in the tumor microenvironment and are also associated with the antitumor function of immune checkpoint inhibitors. However, it is unclear whether gut microbes have a role in anti-tumor function in the combination of anti-angiogenic drugs and immune checkpoint inhibitors for cancer treatment. Endostatin, an angiogenesis inhibitor, has been widely used as an antiangiogenic therapy for cancer. We showed that combined therapy with an adenovirus encoding human endostatin, named Ad-E, and PD-1 blockade dramatically abrogated MC38 tumor growth. The structure of intestinal microbes in mice was changed after combination treatment. We found that the antitumor function of combination therapy was inhibited after the elimination of intestinal microbes. In mice with depleted microbiota, oral gavage of Bacteroides fragilis salvaged the antitumor effects of combination Ad-E and αPD-1 monoclonal antibody (mAb) to a certain extent. Further, Bacteroides fragilis could improve CD3+T cells, NK cells, and IFNγ+CD8+ T cells in the tumor microenvironment to inhibit tumor growth. Besides, Bacteroides fragilis might restore antitumor function by down-regulating isobutyric acid (IBA). Our results suggested that GMs may be involved in the combination of Ad-E and αPD-1 mAb for cancer treatment, which has oncological implications for tumor growth dynamics and cancer immune surveillance.

Keywords: Adenovirus encoding human endostatin; Anti-angiogenic therapy; Cancer therapy; Gut microbes; PD-1 blockade.


Conflict of interest statement

The authors have declared that no competing interest exists.

Figures

Fig. 1
Fig. 1
Combination treatment with Ad-E and αPD-1 mAb modulates the composition of gut microbiota. a Schematic diagram of the experimental design: mice were inoculated with 1 × 106 MC38 cells, and then treated with PBS, Ad-E, αPD-1 mAb and combination Ad-E and αPD-1 mAb treatment on day 9. b Tumor volume of MC38 tumor bearing-mice treated with PBS, Ad-E, αPD-1 mAb and combination Ad-E and αPD-1 mAb treatment, n = 5–6 mice. c PCoA of fecal samples was performed using Bray–Curtis dissimilarity. Each symbol represents a fecal sample from mice under PBS, Ad-E, αPD-1 mAb and combination Ad-E and αPD-1 mAb treatment, n = 5–6 mice. d Comparison of phylum-level proportional abundance of feces from mice under PBS, Ad-E, αPD-1 mAb and combination Ad-E and αPD-1 mAb treatment at the end of the experiments. e The ratio of Firmicutes to Bacteroidetes, n = 5–6 mice. f Relative abundance of Bacteroides fragilis, n = 5–6 mice. * p < 0.05. ** p < 0.01. *** p < 0.001
Fig. 2
Fig. 2
The effect of the combination of Ad-E and αPD-1 mAb on tumor was affected by gut microbiota. a Schematic diagram of the experimental design: mice were treated with ampicillin, polymyxin, metronidazole, streptomycin (antibiotics, ATB) or PBS, and they were inoculated with 1 × 106 MC38 cells. Next, mice that treated with antibiotics or PBS were treated by PBS or Ad-E combined αPD-1 mAb on day 9. b Body weight changes of mice in the following four groups: PBS (sterile PBS pretreatment, treated with sterile PBS), combination Ad-E and αPD-1 mAb (sterile PBS pretreatment, treated with Ad-E and αPD-1 mAb), antibiotics-PBS (antibiotic pretreatment, treated with sterile PBS), antibiotics-combination Ad-E and αPD-1 mAb (antibiotic pretreatment, treated with Ad-E and αPD-1 mAb), n = 5. c Tumor growth kinetics of mice were shown in groups, n = 5 mice per group. d Representative images of dissected tumors on day 21, n = 5. e Tumor weights of four groups on day 21, n = 5. * p < 0.05. ** p < 0.01. *** p < 0.001
Fig. 3
Fig. 3
Bacteroides fragilis rescues the antitumor effect of combination Ad-E and αPD-1 mAb treatment. a Schematic diagram of the experimental design: mice were treated with antibiotics for a week and then evenly divided into two groups. Mice in one group were given PBS, and mice in the other group were given Bacteroides fragilis. A week later, both groups of mice were injected with 1 × 106 MC38 cells and given the combination treatment on day 9 after injection. b Body weight changes of mice in the following two groups: antibiotic-combination Ad-E and αPD-1 mAb (mice have given antibiotic pretreatment, gavaged by PBS, and treated with Ad-E and αPD-1 mAb), antibiotic-combination Ad-E and αPD-1 mAb-B.F. (mice have given antibiotic pretreatment, gavaged by Bacteroides fragilis, and treated with Ad-E and αPD-1 mAb antibiotic), n = 6. c Tumor growth kinetics of mice were shown in groups, n = 6. d Representative images of dissected tumors on day 21, n = 6. e Tumor weights of two groups on day 21, n = 6. (Dead: the mice died due to tumor invasion and could not peel off the mouse tumor at the end of treatment. × : the mice tumors disappeared due to effective treatment at the treatment endpoint) * p < 0.05. ** p < 0.01. *** p < 0.001
Fig. 4
Fig. 4
Combination Ad-E and αPD-1 mAb treatment increases CD3+ T cells, NK cells and IFN-γ+CD8+ T cells in a gut microbiota-dependent manner. a Flow cytometry showed major changes in immune cells in mouse tumor, MLN, and spleen tissue. The heatmap represents the differences in immune cell and cytokine profiles. Red represents the percentage of immune cells; the deeper the color, the greater the percentage of immune cells. PBS (sterile PBS pretreatment, treated with sterile PBS), combination Ad-E and αPD-1 mAb treatment (sterile PBS pretreatment, treated with Ad-E and αPD-1 mAb), antibiotics-PBS (antibiotic pretreatment, treated with sterile PBS), antibiotics-combination Ad-E and αPD-1 mAb treatment (antibiotic pretreatment, treated with Ad-E and αPD-1 mAb), n = 3. b Representative flow cytometry plots for one mouse per group in Bacteroides fragilis experiments are shown (from left to right: CD3+ T cells, IFN-γ+CD8+ T cells, NK cells). c The percentage of tumor-infiltrating immune cells in tumors was analyzed after microbial treatment (from left to right: CD3+ T cells, IFN-γ+CD8+ T cells, NK cells), n = 3
Fig. 5
Fig. 5
Detection of blood vessels, cell proliferation and apoptosis in MC38 tumor. a Vessel density was determined via counting the number of the microvessels per high-power field within hot spot area. 9 high-power fields were counted for each group. Red arrows indicated microvessels. Scale, 20 μm. b Representative image of KI67 immunohistochemical staining. The proliferation activity of cells inside the tumor tissue was determined by calculating the number of cells proliferating per high-power field in the hot spot area. 9 high-power fields are calculated for each group. The red arrows represent proliferating cells. Scale, 20 μm. c TUNEL staining: Tumor cell apoptosis was detected by in situ TUNEL staining (Red) and DAPI counterstaining (Blue). TUNEL positive ratio was determined by calculating the percentage of apoptotic cells among tumor cells. 9 high-power fields were counted for each group. Scale bars, 50 μm
Fig. 6
Fig. 6
Bacteroides fragilis may promote antitumor effects by increasing IBA. a Relative abundance of SCFAs in the MC38-bearing model mice treated with PBS, Ad-E, αPD-1 mAb, combination Ad-E and αPD-1 mAb treatment, including butyric acid, valeric acid, 4-methylvaleric acid, hexanoic acid, acetic acid, propionic acid, IBA and isovaleric acid, n = 3 b Relative abundance of 4-methylvaleric acid, IBA and isovaleric acid, in the MC38-bearing model mice under combination Ad-E and αPD-1 treatment, antibiotic-combination Ad-E and αPD-1 treatment, antibiotic-combination Ad-E and αPD-1 treatment -B.F. groups, n = 4. c-d RT- qPCR (c) and Western blot (d) analysis of RACK1 expression in tumor tissue, n = 3

References

    1. Xiao Y, Yu D. Tumor microenvironment as a therapeutic target in cancer. Pharmacol Ther. 2021;221:107753. 10.1016/j.pharmthera.2020.107753. - PMC - PubMed
    1. Merlo LMF, Pepper JW, Reid BJ, Maley CC. Cancer as an evolutionary and ecological process. Nat Rev Cancer. 2006;6:924–35. 10.1038/nrc2013. 10.1038/nrc2013 - DOI - PubMed
    1. Topalian SL, Hodi FS, Brahmer JR, Gettinger SN, Smith DC, McDermott DF, et al. Five-Year Survival and Correlates Among Patients With Advanced Melanoma, Renal Cell Carcinoma, or Non-Small Cell Lung Cancer Treated With Nivolumab. JAMA Oncol. 2019;5:1411–20. 10.1001/jamaoncol.2019.2187. 10.1001/jamaoncol.2019.2187 - DOI - PMC - PubMed
    1. Vukadin S, Khaznadar F, Kizivat T, Vcev A,Smolic M. Molecular Mechanisms of Resistance to Immune Checkpoint Inhibitors in Melanoma Treatment: An Update. Biomedicines. 2021;9:835. 10.3390/biomedicines9070835. - PMC - PubMed
    1. Braun DA, Bakouny Z, Hirsch L, Flippot R, Van Allen EM, Wu CJ, et al. Beyond conventional immune-checkpoint inhibition - novel immunotherapies for renal cell carcinoma. Nat Rev Clin Oncol. 2021;18:199–214. 10.1038/s41571-020-00455-z. 10.1038/s41571-020-00455-z - DOI - PMC - PubMed

Publication types

MeSH terms

LinkOut - more resources