. 2024 Sep 10;15(1):7887.
doi: 10.1038/s41467-024-52151-6.

Engineered NLS-chimera downregulates expression of aggregation-prone endogenous FUS

Affiliations

Engineered NLS-chimera downregulates expression of aggregation-prone endogenous FUS

Miyuki Hayashi et al. Nat Commun. .

Abstract

Importin β-superfamily nuclear import receptors (NIRs) mitigate mislocalization and aggregation of RNA-binding proteins (RBPs), like FUS and TDP-43, which are implicated in neurodegenerative diseases. NIRs potently disaggregate RBPs by recognizing their nuclear localization signal (NLS). However, disease-causing mutations in NLS compromise NIR binding and activity. Here, we define features that characterize the anti-aggregation activity of NIR and NLS. We find that high binding affinity between NIR and NLS, and optimal NLS location relative to the aggregating domain plays a role in determining NIR disaggregation activity. A designed FUS chimera (FUSIBB), carrying the importin β binding (IBB) domain, is solubilized by importin β in vitro, translocated to the nucleus in cultured cells, and downregulates the expression of endogenous FUS. In this study, we posit that guiding the mutual recognition of NLSs and NIRs will aid the development of therapeutics, illustrated by the highly soluble FUSIBB replacing the aggregation-prone endogenous FUS.


Conflict of interest statement

The authors declare no competing interests.

Figures
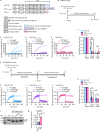
Fig. 1
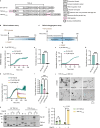
Fig. 1. M9M is the most efficient anti-aggregation and disaggregation signal for Kapβ2.
A Domain structures of FUS PY-NLS mutants. The schematic is not scaled to amino acid length. Cleavage of GST tag with TEV protease induces FUS aggregation. B Schematic of the FUS inhibition assay. Aggregation of 5 μM FUS was initiated by adding TEV protease in the presence or absence of Kapβ2. Change in turbidity at 395 nm was measured for 100 min. Sample was processed for EM imaging at the end of the reaction. CE Inhibition assays of FUS mutants: FUS WT (C), FUShPY-NLS (D), and FUSM9M (E). Each graph contains mean and standard error of mean (SEM) of three independent experiments. F Quantification of the aggregation assays in CE. Mean and SEM of n = 3 independent experiments. ns (not significant) indicates p > 0.05. **p = 0.0025 and ***p = 0.0005 by two-way ANOVA Tukey’s multiple comparisons test. G Schematic of the FUS disaggregation assays. FUS was pre-aggregated for 100 min, then Kapβ2 was added to initiate disaggregation. Change in turbidity was measured for another 100 min. HJ Disaggregation assays of FUS mutants: FUS WT (H), FUShPY-NLS (I), and FUSM9M (J). Each graph contains mean and SEM of 3 independent experiments. K Quantification of the disaggregation assays in HJ showing normalized area under the curve of each experiment between 100 and 120 min. Mean and SEM of n = 3 independent experiments. ns (not significant) indicates p > 0.05 by Two-way ANOVA Tukey’s multiple comparisons test. L GST pulldown assay of GST-tagged WT FUS, FUSNLS-hnRNPA1, and FUSM9M with Kapβ2. GST-tagged FUS that immobilized to glutathione beads was used to pulldown purified Kapβ2. A representative, Coomassie-stained gel image is shown. M molecular weight marker. M Quantification of the gel images collected in L, showing the relative Kapβ2 band intensity normalized to the band intensity of FUS. Mean and SEM of n = 3–4 independent experiments. One-way ANOVA Tukey’s multiple comparisons test.Source data are provided as a Source Data file.
Fig. 2
Fig. 2. Distance between NLS and aggregation domain modulates NIR chaperone activity.
A Domain structures for FUS N-terminal PY-NLS mutants. The N-terminal PY-NLS is separated from PrLD by GS-linker (GGSGGSG) of indicated lengths. The schematic is not scaled to amino acid lengths. B, C Aggregation of 5 μM (GS)1-FUS was initiated by adding TEV protease. Kapβ2 at the indicated concentration was either added at the beginning of the reaction to assess inhibition activity (B) or after 100 min to pre-formed aggregates to assess disaggregation activity (C). Mean and SEM of 3 (B) and 2 (C) independent experiments are plotted. D, E Aggregation of 5 μM (GS)4-FUS was initiated by adding TEV protease. Kapβ2 at the indicated concentration was either added at the beginning of the reaction to assess inhibition activity (D) or after 100 min to pre-formed aggregates to assess disaggregation activity (E). Mean and SEM of 4 independent experiments are plotted. F, G Aggregation of 5 μM (GS)10-FUS was initiated by adding TEV protease. Kapβ2 at the indicated concentration was either added at the beginning of the reaction to assess inhibition activity (F) or after 100 min to pre-formed aggregates to assess disaggregation activity (G). Mean and SEM of 3 or more independent experiments are plotted. H Quantification of the aggregation assays in B, D, and F showing normalized area under the curve (AUC) of each experiment. Mean and SEM are plotted. Each data point represents an independent experiment (n = 3 for (GS)1 and 3 to 5 for (GS)4 and (GS)10). ns = non-significant (p > 0.05) and *p = 0.0329 by two-way ANOVA Tukey’s multiple comparisons test. I Quantification of the disaggregation assays in C, E, and G showing normalized AUC of each experiment between 100 and 200 min. Mean and SEM are plotted. Each data point represents an independent experiment (n = 2 for (GS)1, 4 for (GS)4, and 3 for (GS)10). ns non-significant (p > 0.05) by two-way ANOVA Tukey’s multiple comparisons test. Source data are provided as a Source Data file.
Fig. 3
Fig. 3. Kapβ2 mitigates aggregation of TDP-43 tagged with M9M at C-terminus.
A Domain structures of TDP-43 mutants. The schematic is not scaled to amino acid length. B Schematics of the TDP-43 inhibition assay. The reaction was initiated by adding TEV protease (16 μg/mL for WT and TDP-43N-M9M; 32 μg/mL for TDP-43C-M9M) in the presence or absence of Kap β2. The change in turbidity was recorded over time. C Schematics of the TDP-43 disaggregation assay. Assembly of 5 μM TDP-43 was initiated by adding TEV protease. At 130 min, Kap β2 was added to pre-formed aggregates. Change in turbidity was recorded for another 110 min. D Inhibition assay of TDP-43N-M9M. Mean and SEM of four independent experiments. E Quantification of the inhibition assay shown in D. Mean and SEM of n = 4 independent experiments. ****p < 0.0001 by two-tailed, unpaired t test. F Inhibition assay of TDP-43C-M9M. Mean and SEM of 3 independent experiments. G Quantification of the inhibition assay shown in F. Mean and SEM of n = 3 independent experiments. ****p < 0.0001 by two-tailed, unpaired t test. H Disaggregation assay of TDP-43C-M9M. Mean and SEM of 3 independent experiments. I Quantification of the disaggregation assay shown in H. Mean and SEM of n = 3 independent experiments. *p = 0.0389, **p = 0.0081 and ***p = 0.0005 by one-way ANOVA Tukey’s multiple comparisons test (J) EM images of TDP-43 C-M9M. Disaggregation assays were performed as in H, and samples were processed for EM imaging 130 min post-Kap β2 (5 μM) addition. Scale bar: 2 μm. K Sedimentation assay of 5 μM WT TDP-43 and TDP-43C-M9M. Pre-formed TDP-43 aggregates were treated with 5 μM Kap β for 130 min, then centrifuged to separate soluble supernatant (S) and insoluble pellet (P) fractions. A representative, Coomassie-stained gel is shown. In = input and M = molecular weight marker. L Quantification of gel bands shown in K. Mean and SEM of n = 2 (TDP-43C-M9M with Kap β2) and 3 (others) independent experiments. ns = non-significant by one-way ANOVA Tukey’s multiple comparisons test. Source data are provided as a Source Data file.
Fig. 4
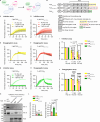
Fig. 4. Importin α/β complex mitigates aggregation of FUS cNLS mutants.
A The IBB domain occupies the NLS binding site of Imp α and prevents binding of cargoes in the absence of Imp β. The association with the NLS cargo and concomitant recruitment of Imp β frees the IBB of Imp α, leading to the assembly of a trimeric nuclear import complex (e.g., importin α/β/cargo). Created with BioRender.com released under a Creative Commons Attribution-NonCommercial-NoDerivs 4.0 International license. B Domain structures of FUS cNLS mutants. FUS PY-NLS is replaced with SV40 NLS, TDP-43 NLS, or IBB. The schematic is not scaled to amino acid length. C, D Inhibition assays of FUSNLS-SV40 (C) and FUSNLS-TDP-43 (D). Mean and SEM of 3 (C) and 4 (D) independent experiments are plotted. E, F Disaggregation assays of FUSNLS-SV40 (E) and FUSNLS-TDP-43 (F). Mean and SEM of three independent experiments are plotted. G Inhibition assay of FUSIBB. Mean and SEM of four independent experiments are plotted. H Disaggregation assay of FUSIBB. Mean and SEM of 2 (3 μM Impα/β condition) and 3 (other conditions) independent experiments are plotted. I Quantification of the aggregation assays in C, D, and G. Mean and SEM of n = 3 (FUSNLS-SV40) and 4 (others) independent experiments. Two-way ANOVA Tukey’s multiple comparisons test. J Quantification of the disaggregation assays in E, F, and H. Mean and SEM of n = 2 (3 μM Imp α/β in FUSIBB) to 3 (others) independent experiments. ***padj = 0.0003, and ****padj < 0.0001 by two-way ANOVA Tukey’s multiple comparisons test. K GST pulldown assay of GST-tagged FUS cNLS mutants with Imp α/β analyzed by Western blot. Purified Imp α/β was added to FUS mutants immobilized on glutathione beads. M = molecular weight marker. L Quantification of the Western blot images collected in K. The intensity of Imp α and β band was normalized to the intensity of the corresponding FUS band. Mean and SEM of n = 2 (FUSNLS-TDP-43) to 3 (others) independent experiments. ns = non-significant (padj > 0.05) by two-way ANOVA Tukey’s multiple comparisons test. Source data are provided as a Source Data file.
Fig. 5
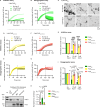
Fig. 5. Importin β alone can mitigate aggregation of FUSIBB.
A, D, F Inhibition assays of FUSIBB (A), FUSNLS-SV40 (D), and FUSNLS-TDP-43 (F). Mean and SEM of 2 (1.5 μM Imp β in D) to 3 (others) independent experiments are plotted. B, E, G Disaggregation assay of FUSIBB (B), FUSNLS-SV40 (E), and FUSNLS-TDP-43 (G). Mean and SEM of 2 (1.5 μM Imp β in E and G; 3 μM Imp β in G), 4 (No Imp β in E), and 3 (others) independent experiments are plotted. C EM images of FUSIBB with equimolar Imp β. Samples were prepared for imaging at the end of the inhibition assay as in A. Three (large, medium, and small) representative images correspond to the relative size of the aggregates observed within the sample. Scale bar = 2 μm. H Quantification for the inhibition assays in A, D, F showing normalized area under the curve of each experiment. Mean and SEM are shown. Each data point represents an independent experiment (n = 2 for 1.5 μM Imp β in FUSNLS-SV40 and 3 for others). ****padj < 0.0001 by two-way ANOVA Tukey’s multiple comparisons test. I Quantification for the disaggregation assays in B, E, G showing normalized area under the curve of each experiment between 100 and 200 min. Mean and SEM are shown. Each data point represents an independent experiment (n = 2 for 1.5 μM Imp β in FUSNLS-TDP43 and NLS-SV40 and 3 μM Imp β in FUSNLS-TDP-43; n = 3 for others). Two-way ANOVA Tukey’s multiple comparisons test. J A representative Western blot image of GST pulldown assay. Imp β was added to GST-FUS mutants immobilized to glutathione beads. M = molecular weight marker. K Quantification of the Western blot images collected in J. The intensity of Imp β band was normalized to the intensity of the corresponding FUS band. Mean and SEM of four independent experiments are shown. Two-way ANOVA Tukey’s multiple comparisons test.Source data are provided as a Source Data file.
Fig. 6
Fig. 6. Importin β transports and chaperons FUSIBB in cells independently of Imp α.
A Immunofluorescence images of HEK293 cells co-transfected with Bimax1-mRuby (or mRuby) and FLAG-tagged FUSIBB expression vector. Solid lines circle transfected cells, and dashed lines circle non-transfected cells. The experiment was repeated at least three times with similar results. Scale bars = 20 µm. B Quantification of the immunofluorescence images collected in A. Only cells that express both FUSIBB and Bimax1-mRuby (or mRuby) were quantified. Experiments were repeated at least three times with similar results. Data from one representative experiment is shown: n = 894 for cells expressing both FUSIBB and mRuby, n = 569 for cells expressing both FUSIBB and Bimax1-mRuby. Mean and standard deviation (SD). ns = non-significant (padj > 0.05) by one-way ANOVA Sidak’s multiple comparisons test. C Immunofluorescence images of HEK293 cells transfected with FLAG-tagged WT FUS or FUSIBB. The experiment was repeated at least three times with similar results. Scale bars = 20 µm. D Quantification of images shown in C. Each data point represents the percentage of stress granule-positive cells per image. Mean and SEM of n = 6 (FUSIBB) and 7 (WT FUS) images. 365 cells for WT FUS and 434 cells for FUSIBB were counted. Two-tailed, unpaired t test. Data from one representative experiment is shown. The experiment was repeated at least three times with similar results. E Immunofluorescence images of HEK293 cells transfected with FLAG-tagged WT FUS or FUSIBB and treated with sodium arsenite. The experiment was repeated at least three times with similar results. Scale bars = 20 µm. F Quantification of the G3BP1-positive puncta (stress granule) size in WT FUS and FUSIBB transfected cells shown in E. Mean and SD of n = 1380 stress granules for WT FUS, and n = 1790 stress granules for FUSIBB. ns = non-significant (p > 0.05) by two-tailed, unpaired t test. G Quantification of WT FUS and FUSIBB intensity in the stress granules shown in E. Mean and SD of n = 1415 stress granules for WT FUS, and n = 1909 stress granules for FUSIBB. Two-tailed, unpaired t test. Source data are provided as a Source Data file.
Fig. 7
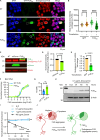
Fig. 7. FUSIBB lowers endogenous FUS expression and is not toxic to cells.
A Immunofluorescence images of HEK293 cells transfected with FLAG-tagged FUSIBB (or GFP). NT = non-transfected. Solid lines circle transfected cells, and dashed lines circle non-transfected cells. The experiment was repeated at least three times with similar results. Scale bars = 20 µm. B Quantification of endogenous FUS fluorescence intensity shown in A. Mean and SD of n = 304 for GFP non-transfected cells, n = 285 for GFP transfected cells, n = 708 for FUSIBB non-transfected cells, and n = 378 for FUSIBB transfected cells. ****padj < 0.0001 by one-way ANOVA Sidak’s multiple comparisons test. Data from one representative experiment is shown. Experiments were repeated at least three times with similar results. C Western blot of HEK293 cells transfected with FLAG-tagged FUSIBB (or mClover). NT = non-transfected. D Quantification of Western blot images in C. Mean and SEM of n = 3 independent experiment. Two-tailed, unpaired t test. E mRNA level of endogenous FUS normalized to β-Actin in GFP or FUSIBB transfected U2OS cells, measured by RT-qPCR. Mean and SEM of n = 4 independent experiments. Two-tailed, unpaired t test. F Normalized anisotropy of fluorescein-labeled BDNF RNA with different concentrations of MBP-tagged WT FUS or FUSIBB. Mean and SEM of n = 3 independent experiments. Solid lines represent the fitted curve. G The dissociation constant, Kd, fitted from the dose-response curves in F. Mean and SEM of n = 3 independent experiments. ns = non-significant (p > 0.05) by two-tailed, unpaired t test. H Representative Western blot image of the doxycycline-inducible FUSIBB cell lysates. M = molecular weight marker. β-Actin = loading control. The experiment was repeated at least twice with similar results. I Cell viability assay of doxycycline-inducible FUSIBB cells. Cell viability was estimated based on resazurin (non-fluorescent) conversion to resorufin (fluorescent). Mean and SEM of n = 4 wells from a representative experiment. The experiments were repeated at least 3 times with similar results. ***p < 0.001 and ****p < 0.0001 by two-way ANOVA Dunnett’s multiple comparisons test with Geisser-Greenhouse correction. J The model for FUSIBB expression replacing the endogenous FUS. Endogenous FUS is prone to aggregation under stress. FUSIBB can maintain nuclear localization and downregulate endogenous FUS expression, suggesting its potential as a therapeutic agent to replace disease-causing FUS. Created with BioRender.com released under a Creative Commons Attribution-NonCommercial-NoDerivs 4.0 International license.Source data are provided as a Source Data file.

References

    1. Portz, B., Lee, B. L. & Shorter, J. FUS and TDP-43 phases in health and disease. Trends Biochem. Sci.46, 550–563 (2021). 10.1016/j.tibs.2020.12.005 - DOI - PMC - PubMed
    1. Carey, J. L. & Guo, L. Liquid-liquid phase separation of TDP-43 and FUS in physiology and pathology of neurodegenerative diseases. Front. Mol. Biosci.9, 826719 (2022). 10.3389/fmolb.2022.826719 - DOI - PMC - PubMed
    1. Harrison, A. F. & Shorter, J. RNA-binding proteins with prion-like domains in health and disease. Biochem. J.474, 1417–1438 (2017). 10.1042/BCJ20160499 - DOI - PMC - PubMed
    1. Purice, M. D. & Taylor, J. P. Linking hnRNP function to ALS and FTD pathology. Front. Neurosci.12, 326 (2018). 10.3389/fnins.2018.00326 - DOI - PMC - PubMed
    1. Hock, E. M. et al. Hypertonic stress causes cytoplasmic translocation of neuronal, but not astrocytic, FUS due to impaired transportin function. Cell Rep.24, 987–1000.e1007 (2018). 10.1016/j.celrep.2018.06.094 - DOI - PubMed

Publication types

LinkOut - more resources