. 2024 Sep 9;15(1):7857.
doi: 10.1038/s41467-024-52167-y.

Glioblastoma cells increase expression of notch signaling and synaptic genes within infiltrated brain tissue

Affiliations

Glioblastoma cells increase expression of notch signaling and synaptic genes within infiltrated brain tissue

Dylan Scott Lykke Harwood et al. Nat Commun. .

Abstract

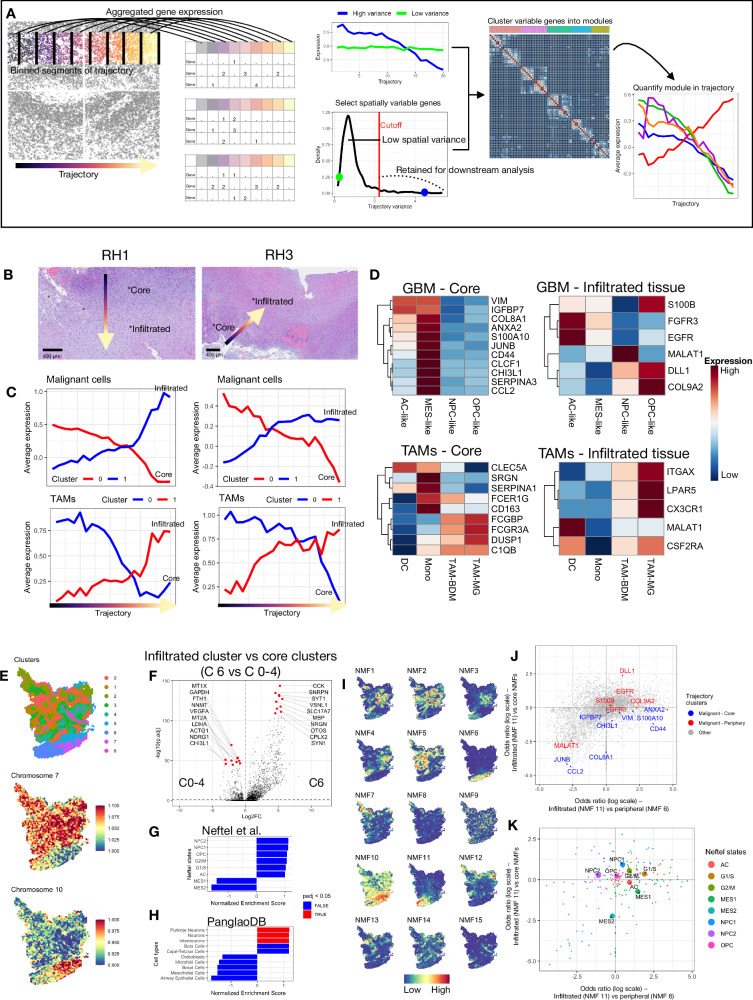
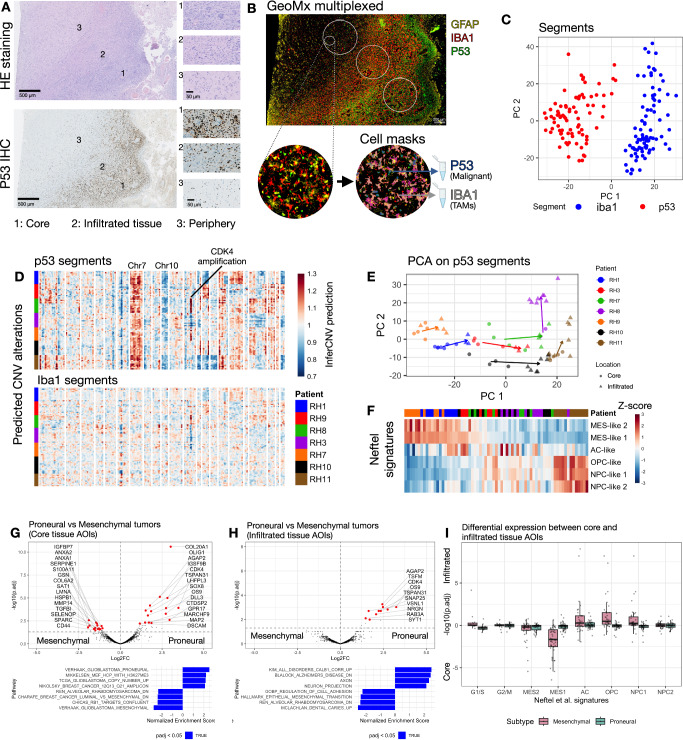
Glioblastoma remains one of the deadliest brain malignancies. First-line therapy consists of maximal surgical tumor resection, accompanied by chemotherapy and radiotherapy. Malignant cells escape surgical resection by migrating into the surrounding healthy brain tissue, where they give rise to the recurrent tumor. Based on gene expression, tumor cores can be subtyped into mesenchymal, proneural, and classical tumors, each being associated with differences in genetic alterations and cellular composition. In contrast, the adjacent brain parenchyma where infiltrating malignant cells escape surgical resection is less characterized in patients. Using spatial transcriptomics (n = 11), we show that malignant cells within proneural or mesenchymal tumor cores display spatially organized differences in gene expression, although such differences decrease within the infiltrated brain tissue. Malignant cells residing in infiltrated brain tissue have increased expression of genes related to neurodevelopmental pathways and glial cell differentiation. Our findings provide an updated view of the spatial landscape of glioblastomas and further our understanding of the malignant cells that infiltrate the healthy brain, providing new avenues for the targeted therapy of these cells after surgical resection.


Conflict of interest statement

The authors declare no competing interests.

Figures

Fig. 1
Fig. 1. Histological hallmarks of glioblastoma characterized by single-cell spatial transcriptomics.
A Illustration of the spatial transcriptomics workflow. Archived formalin-fixed paraffin-embedded tissue sections from resected patient tumors (n = 5 patients) were screened for histological hallmarks of glioblastoma tumors. Spatial Molecular Imaging (CosMx, NanoString Technologies) was performed on all tumors using both gene transcripts and cell masks for cell profiling. B Uniform Manifold Approximation and Projection (UMAP) of all cells with individual plots for each patient sample using the same UMAP coordinates for each plot. C Mean expression of modified Neftel signatures across all malignant cells. D Dotplot of differential expression testing for all cell types. Color represents the average expression and dot size is the percentage of cells expressing the gene. E Correlation matrix of the distributions of cell types and malignant states across all patient regions of interest. F Composition of cells within our study and other single-cell RNA sequencing studies. G Heatmap of cell composition in each study, with values scaled and centered for each cell type. H Proportions of selected cell types within our data (red) (n = 1) and other studies (blue) (n = 16). Box plots show interquartile range (IQR), with the middle line indicating the median, and whiskers representing 1.5-fold IQR, and all individual points are shown. Source data are provided as a Source Data file. Panel A Created with BioRender.com released under a Creative Commons Attribution-NonCommercial-NoDerivs 4.0 International license.
Fig. 2
Fig. 2. Cellular neighborhood analysis across histological hallmarks of glioblastoma.
A Cellular neighborhoods in CosMx data visualized by Uniform Manifold Approximation and Projection. B Cell type or state enrichment across neighborhoods by Fisher’s exact test. C Pearson’s correlation matrix of cellular neighborhood fraction across field of views. D Histology of Hematoxylin and Eosin stained sections from adjacent tissue sections (top), with cell polygons colored by cell annotation (middle) and pixels colored by cellular neighborhoods (bottom) on example field of views with necrosis and microvascular proliferation. Clusters are the same as in (A). E Differential expression using a two-sided Wilcoxon Rank Sum test between cells in hypoxic/necrotic areas (cells = 3768, 5 samples) (neighborhood 4) compared to other neighborhoods (cells = 44251, 5 samples), with top genes being shown in Ivy-gap data (n = 122 across 10 patient samples) (F). G Differential expression using a two-sided Wilcoxon Rank Sum test between cells surrounding microvascular proliferation (cells = 6360, 5 samples) (neighborhood 3) compared to other neighborhoods (cells = 41,659, 5 samples), with top genes being shown in Ivy-gap data (n = 122 across 10 patient samples) (H). I Sections with the highest expression of MGP and TIMP1 in a recently published spatial transcriptomics dataset (Ravi et al.). J Differentially expressed genes for each patient in transcriptional clusters with the highest expression of MGP and TIMP1. K Expression of MGP, TIMP1, and all collagen genes in the dataset aggregated for each cluster, showing high expression of many, but not all collagens within these clusters. F, H Box plots show interquartile range (IQR), with the middle line indicating the median, and whiskers representing 1.5-fold IQR, and all individual points are shown. B, E, G, J All p-values were adjusted for using Benjamini–Hochberg correction. Source data are provided as a Source Data file.
Fig. 3
Fig. 3. Spatial trajectory analysis across the border of glioblastoma tumors.
A Overview of the developed algorithm for detecting gene modules within a spatial trajectory in CosMx data. B Hematoxylin and eosin stains and selected field of views chosen for spatial trajectory analysis, along with the visualization of the spatial trajectory and identified gene modules (C). D Shared genes up- and downregulated in malignant cells and tumor-associated macrophages and microglia (TAMs) between the two patient samples. E Transcriptional clusters and predicted chromosome values (7 and 10) in a 10x Visium GBM dataset. F Volcano plot of differentially expressed genes between the infiltrated area and tumor core using a two-sided Wilcoxon Rank Sum test. G Gene set enrichment analysis of Neftel malignant state signatures (G) and PangloDB cell type signatures (H) using a two-sided Fisher’s exact test. I Non-negative matrix factorization (NMF) programmes identified in this dataset. J Odds ratio of gene weights in the invasive NMF compared to peripheral and core NMFs for previously identified genes for malignant cells, and aggregated for each Neftel cell state (K). FH All p-values were adjusted for using Benjamini–Hochberg correction. Source data are provided as a Source Data file.
Fig. 4
Fig. 4. GeoMx profiling of glioblastoma tumors.
A p53 mutated patient cohort was screened for high immunohistochemical p53 expressing tumor cells. Tumors with areas of the transition zone (tumor border) and tumor periphery (scarcity of tumor cells) were included in the study. Scale bars in smaller images are representative for all images of the same type. B GeoMx experimental overview. Immunofluorescence multiplexing of Iba1, p53, Glial Fibrillary Acidic Protein (GFAP) and DAPI. Iba1 and p53 were used to segment cells. C Principle component analysis (PCA) of areas of interest (AOIs) colored by segmentation marker. D InferCNV predicted copy number alterations in p53 and iba1 AOIs. E PCA of p53 AOIs only, with arrows illustrating the shift between core and infiltrated regions for each patient. F Heatmap of Neftel et al. signatures ranked by the PC1 axis in E. Volcano plots for differential expression analysis (DESeq2) using two-sided test between core (G) and infiltrated (H) p53 segments, divided into mesenchymal (n = 4) and proneural (n = 3) subtypes (top) followed by gene set enrichment analysis (bottom). I Gene markers found by Neftel et al. and the significance of a gene being expressed in the core or infiltrated regions of a tumor, split into mesenchymal (n = 4) and proneural (n = 3) tumors. -log10(P.adjusted) values are shown on the y-axis. To visualize whether a gene is differentially expressed across malignant programs, we assign a value equal to the sign of the LogFC (1 or −1) multiplied by -log10(p.adj). This approach allows us to distinguish between genes upregulated in the core or infiltrated regions. Genes upregulated in the core tissue appear on the bottom half of the plot, while genes upregulated in the infiltrated tissue appear on the top half. Box plots show interquartile range (IQR), with the middle line indicating the median, and whiskers representing 1.5-fold IQR, and all individual points are shown. G, H All p-values were adjusted for using Benjamini–Hochberg correction. Source data are provided as a Source Data file. Panel B Created with BioRender.com released under a Creative Commons Attribution-NonCommercial-NoDerivs 4.0 International license.
Fig. 5
Fig. 5. Analysis of differential expression of GeoMx gene modules.
A All gene modules were tested for being differentially expressed between core and infiltrated tissue areas of interest (AOI) (n = 5) using a linear mixed-effects model and ANOVA to estimate the effect on location. Box plots show interquartile range (IQR), with the middle line indicating the median, and whiskers representing 1.5-fold IQR. B Gene set enrichment analysis (GSEA) for all gene modules using Fisher’s exact test. Only significant ontologies were retained in the figure. C Correlation matrix (left) of all significantly up- or downregulated gene modules between the tumor core and infiltrated brain tissue in TCGA (The Cancer Genome Atalas) data. Modules are clustered into module clusters using hierarchical clustering. Expression heatmap of gene modules across all annotated GBMap cells (right). Rows are the same in both heatmaps. D GSEA (using fgsea) for all significant gene modules for differential expression analysis results between tumor and infiltrating cells from Darmanis et al. E Module score expression in TCGA data (left) and forest plots using multivariable Cox regression including each of the the three infiltrated tissue module clusters and covariates (MGMT- and IDH-status and age) (right). Box plots show interquartile range (IQR), with the middle line indicating the median, and whiskers representing 1.5-fold IQR, and all individual points are shown. Error bars for forest plot represent the 95% CI. *p < 0.05 after multiple hypothesis correction (A, D). All p-values were adjusted for using Benjamini–Hochberg correction. *p < 0.05, **p < 0.01. Source data are provided as a Source Data file.

References

    1. Wen, P. Y. et al. Glioblastoma in adults: a Society for Neuro-Oncology (SNO) and European Society of Neuro-Oncology (EANO) consensus review on current management and future directions. Neuro Oncol.22, 1073–1113 (2020). 10.1093/neuonc/noaa106 - DOI - PMC - PubMed
    1. Ostrom, Q. T. et al. CBTRUS Statistical Report: Primary brain and other central nervous system tumors diagnosed in the United States in 2010-2014. Neuro Oncol.19, v1–v88 (2017). 10.1093/neuonc/nox158 - DOI - PMC - PubMed
    1. Stupp, R. et al. Radiotherapy plus concomitant and adjuvant temozolomide for glioblastoma. N. Engl. J. Med.352, 987–996 (2005). 10.1056/NEJMoa043330 - DOI - PubMed
    1. Hambardzumyan, D. & Bergers, G. Glioblastoma: Defining Tumor Niches. Trends Cancer1, 252–265 (2015). 10.1016/j.trecan.2015.10.009 - DOI - PMC - PubMed
    1. Puchalski, R. B. et al. An anatomic transcriptional atlas of human glioblastoma. Science360, 660–663 (2018). 10.1126/science.aaf2666 - DOI - PMC - PubMed

Publication types

MeSH terms

Substances

LinkOut - more resources