. 2024 Sep 9;15(1):7879.
doi: 10.1038/s41467-024-51794-9.

FoxO transcription factors actuate the formative pluripotency specific gene expression programme

Affiliations

FoxO transcription factors actuate the formative pluripotency specific gene expression programme

Laura Santini et al. Nat Commun. .

Abstract

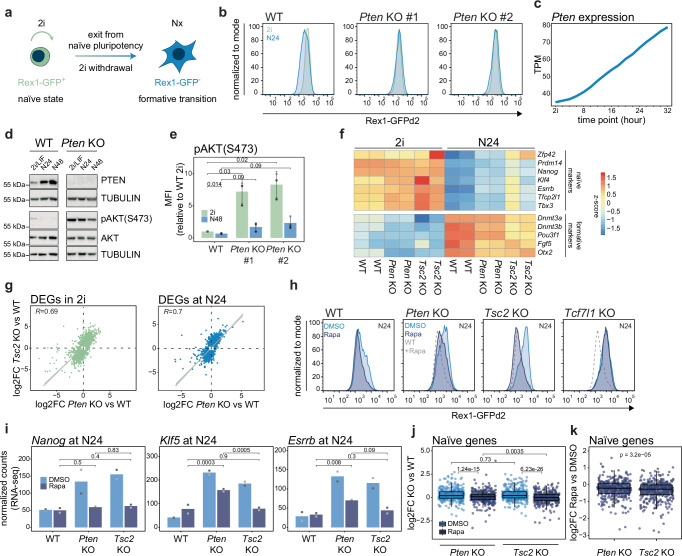
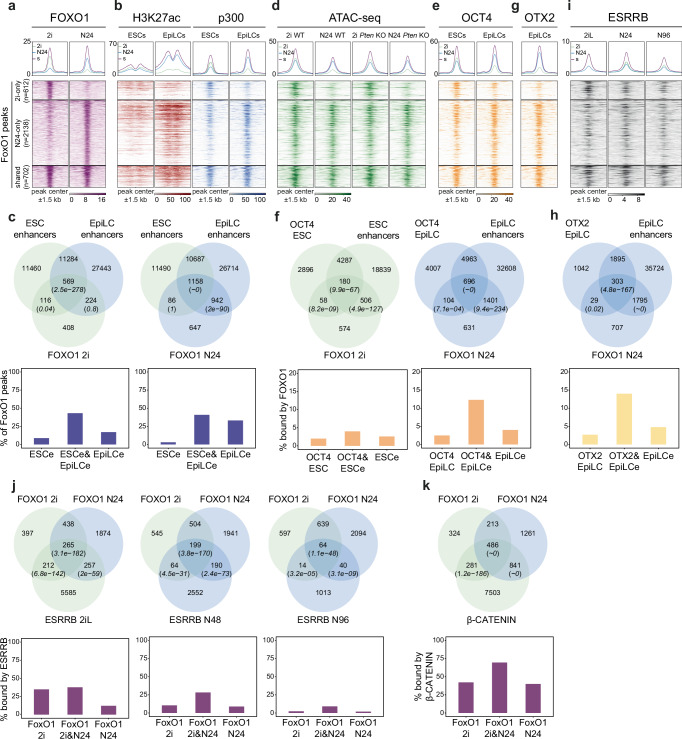
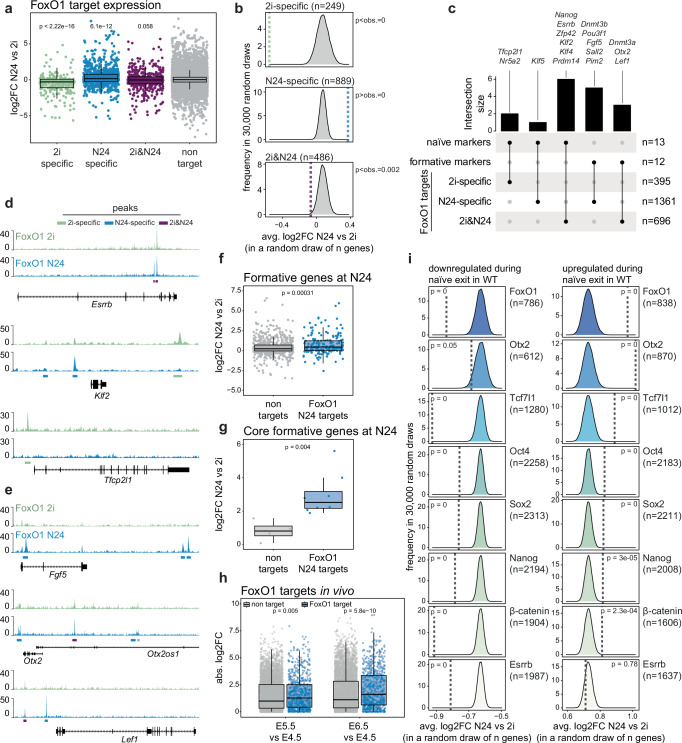
Naïve pluripotency is sustained by a self-reinforcing gene regulatory network (GRN) comprising core and naïve pluripotency-specific transcription factors (TFs). Upon exiting naïve pluripotency, embryonic stem cells (ESCs) transition through a formative post-implantation-like pluripotent state, where they acquire competence for lineage choice. However, the mechanisms underlying disengagement from the naïve GRN and initiation of the formative GRN are unclear. Here, we demonstrate that phosphorylated AKT acts as a gatekeeper that prevents nuclear localisation of FoxO TFs in naïve ESCs. PTEN-mediated reduction of AKT activity upon exit from naïve pluripotency allows nuclear entry of FoxO TFs, enforcing a cell fate transition by binding and activating formative pluripotency-specific enhancers. Indeed, FoxO TFs are necessary and sufficient for the activation of the formative pluripotency-specific GRN. Our work uncovers a pivotal role for FoxO TFs in establishing formative post-implantation pluripotency, a critical early embryonic cell fate transition.


Conflict of interest statement

The authors declare no competing interests.

Figures

Fig. 1
Fig. 1. mTORC1 inhibition only partially rescues Pten KO phenotype.
a Schematic representation of our experimental setup. Nx indicates differentiation time (x) after 2i withdrawal in N2B27 medium. b Flow cytometry analysis of Rex1-GFP levels in WT and two independent Pten KO clones in naïve pluripotency supporting conditions (2i, green) and 24 h after 2i removal (N24, blue). One representative of n = 11 independent experiments is shown. c Pten expression levels (transcript per million, TPM) from a 2 h-resolved RNA-seq differentiation time course in WT. d Western blot analysis for indicated proteins in WT and Pten KO in 2i/LIF, at N24 and N48. TUBULIN served as a loading control. e Quantification of pAKT (S473) levels by flow cytometry in indicated cells and conditions. Mean and standard deviation (SD) of mean fluorescence intensity (MFI) from n = 3 independent experiments (distinct shades of grey) are shown. p values result from paired, two-tailed t-tests. f Heatmap showing row-normalised expression values of indicated naïve and formative genes in indicated genotypes and conditions. g Scatter plots showing correlation between differentially expressed genes (DEGs, p adj. ≤ 0.05, |log2foldchange (log2FC)| ≤ 0.5) in Pten or Tsc2 KO in 2i and N24. Trend lines with 95% confidence intervals, and Pearson’s correlation coefficients (R) are shown. h Flow cytometry analysis of Rex1-GFP levels in indicated cell lines at N24, after indicated treatments. Rapamycin-treated WT cells are shown as dashed grey line. One representative of n = 5 independent experiments is shown. i Expression levels of indicated genes in indicated cell lines at N24 after indicated treatments measured by RNA-seq. p adj. values resulting from DESeq analysis are indicated in the plot. j Box plot showing expression of 377 naïve genes (naïve early and naïve late genes) in indicated KOs and conditions measured by RNA-seq. p values from two-tailed Wilcoxon signed rank tests are indicated. k Box plot showing the expression of 377 naïve genes in indicated KOs and conditions measured by RNA-seq. p value from two-tailed Wilcoxon signed rank test is indicated. All box plots in this paper show the 25th and 75th percentiles and median. Whiskers indicate minimum and maximum values.
Fig. 2
Fig. 2. FoxO TFs translocate into the nucleus upon exit from naïve pluripotency.
a Confocal microscopy images after IF, showing FOXO1 (purple) and ESRRB (green) in WT and Pten KOs in 2i and at N24. DAPI staining is shown in blue. One representative image from n = 3 independent experiments is shown. Scale bar = 20 μM. b Quantification of FOXO1 and ESRRB nuclear intensity (in arbitrary unit, arb. units) measured from confocal images of WT cells in 2i (n = 135) and 8 h (N8, n = 136), 16 h (N16, n = 88) and 24 h (N24, n = 127) after 2i withdrawal. Data were obtained from n = 2 independent experiments. p values are derived from a two-tailed Wilcoxon rank sum test. c Quantification of FOXO1 nuclear intensity (arb. units) based on images of WT (n = 189 [2i] and n = 164 [N24]) and Pten KO (n = 100 [2i] and n = 153 [N24]), as in (a). Data were obtained from n = 2 independent experiments. p values were calculated as in (b). d Confocal microscopy images after IF showing FOXO1 (white), SOX2 (green), GATA4 (red), or OTX2 (red) in WT E4.5, E4.75 and E5.5 embryos. Hoechst staining is shown in cyan. One representative image of n = 3 independent experiments is shown. Scale bar = 100 μM. e Quantification of FOXO1 nuclear intensity (arb. units) measured from confocal images of WT epiblast from E4.5 (n = 12), E4.75 (n = 12) and E5.5 (n = 8) embryos, as in (d). Data were obtained from n = 3 independent experiments. Indicated p values are derived from a two-tailed Wilcoxon rank sum test.
Fig. 3
Fig. 3. Chromatin dynamics of FoxO TFs upon exit from the naïve pluripotent state.
a Heatmap displaying FoxO1 signal within a 1.5 kb window around FoxO1 peak-centres in WT cells at 2i and N24, categorised into 2i-only (n = 612, green), N24-only (n = 2138, blue) and shared peaks (n = 702, purple). b Heatmaps showing H3K27ac (left) and p300 (right) signal in ESCs and EpiLCs in a 1.5 kb window around FoxO1 peak-centres. c Venn diagrams showing overlaps between FoxO1 peaks in 2i and N24 with ESC and EpiLC enhancers (top). Bar plots display the percentage of FoxO1 peaks overlapping with ESC-specific (ESCe), EpiLC-specific (EpiLCe) or shared (ESCe&EpiLCe) enhancers (bottom). p values are derived from hypergeometric tests. d Heatmap showing ATAC-seq signal within a 1.5 kb window around FoxO1 peak-centres in WT and Pten KOs in 2i or at N24. e Heatmaps showing Oct4 signal in ESCs and EpiLCs in a 1.5 kb window around FoxO1 peak-centres. f Venn diagrams showing the overlap between FoxO1 peaks in 2i or at N24 with Oct4 peaks in ESCs or EpiLCs (top). Bar plots showing the percentage of OCT4-bound enhancers overlapping with FoxO1 peaks (bottom). p values are derived from hypergeometric tests. g Heatmap showing Otx2 signal in EpiLCs in a 1.5 kb window around FoxO1 peak-centres. h Venn diagram showing the overlap between FoxO1 peaks at N24 with Otx2 peaks in EpiLCs (top). Bar plots showing the percentage of OTX2-bound enhancers overlapping with FoxO1 peaks (bottom). p values are derived from hypergeometric tests. i Heatmap showing Esrrb signal in WT cells in 2iL, N48 and N96 in a 1.5 kb window around FoxO1 peak-centres. j Venn diagrams showing the overlap between FoxO1 peaks in 2i and at N24 with Esrrb peaks in 2iL, N48 or N96 (top). Bar plots showing the percentage of FoxO1 peaks (2i-only, N24-only or shared) that overlap with Esrrb peaks (bottom). p values are derived from hypergeometric tests. k Venn diagrams showing the overlap between FoxO1 peaks in 2i and at N24 with β-catenin peaks (top). Barplots showing the percentage of FoxO1 peaks in indicated categories overlapping with β-catenin peaks (bottom). p values are derived from hypergeometric tests.
Fig. 4
Fig. 4. FoxO TF targets are key players in the naïve to formative pluripotency transition.
a Boxplot illustrating expression of 2i-specific (n = 249, green), N24-specific (n = 889, blue), and 2i&N24 (n = 486, purple) FoxO1 targets in WT cells at N24, measured by RNA-seq. Data show log2FC relative to 2i and p values from Wilcoxon rank sum tests. Non-targets are shown in grey. b Bootstrapping analysis (30,000 draws) for gene-sets of the same size as the sample gene-sets (2i-specific, 249 genes; N24-specific, 889 genes; 2i&N24, 486 genes). The distribution of average log2FC is plotted, with p values indicating the probability of the predicted exceeding the measured effect-size. c Upset plot showing the overlap of FoxO1 targets with core naïve and formative markers. d Genome browser snapshots displaying FoxO1 ChIP-signal in WT on selected naïve markers in 2i (green) and N24 (blue). Called peaks are indicated (2i-only: green, N24-only: blue, shared: purple). e Genome browser snapshots showing FoxO1 ChIP-signal in WT cells on selected formative markers in 2i (green) and N24 (blue). Called peaks are indicated (2i-only: green, N24-only: blue, shared: purple). f Box plot depicting expression of formative genes (n = 832) in WT cells at N24, divided into FoxO1 N24 targets (blue) or non-targets (grey), as measured by RNA-seq. Data are shown as log2FC relative to 2i. p value from two-tailed Wilcoxon rank sum tests is indicated in the plot. g Box plot showing the expression of core formative genes (n = 12) in WT cells at N24, divided into FoxO1 N24 targets (blue) or non-targets (grey), measured by RNA-seq. Data are shown as log2FC relative to 2i. p value from two-tailed Wilcoxon rank sum test is indicated. h Box plot showing the expression of FoxO1 targets (n = 726, blue) and non-targets (n = 5061, grey) in E5.5 and E6.5 embryos,. Absolute log2FC relative to E4.5 are shown. p values from two-tailed Wilcoxon rank sum test are indicated. i Similar to (b), bootstrapping analysis (30,000 draws) for gene-sets of the same size as the sample gene-sets (n = group size). The distribution of average log2FC is plotted, with p values indicating the probability of the predicted exceeding the measured effect-size.
Fig. 5
Fig. 5. Interference with FoxO1 nuclear shuttling impairs the transition from the naïve to the formative GRN.
a Flow cytometry analysis of Rex1-GFP levels in WT cells transfected with control (siGFP and siScr, grey) or siRNAs targeting FoxO1 (siFoxO1, red). One representative of n = 3 independent experiments is shown. b Volcano plot showing RNA-seq data of WT cells at N24, treated with siRNA against FoxO1. DEGs (p adj. ≤ 0.2) that are bound by FoxO1 are colour coded depending on whether they are bound only in 2i (green), only at N24 (blue) or in both conditions (purple). Selected naïve and formative genes are indicated in the plot. For each quadrant, percentages (%) of FoxO1 2i-only, N24-only and 2i&N24 targets are indicated. c CUT&RUN analysis of H3K27ac levels on indicated enhancers after FoxO1 siRNA treatment. Signal was normalised to a genomic background region that did not exhibit any H3K27ac signal in WT cells. Data were further normalised to a H3K27ac peak found in Drosophila spike-in cells. Data are shown as relative to siScr control. n = 2 biological replicates. An independent experiment with further n = 2 biological replicates shown in Supplementary Fig. 5g.
Fig. 6
Fig. 6. Enforcing nuclear FoxO1 shuttling impairs the transition from the naïve to the formative GRN.
a Venn diagrams showing the overlap between FoxO1 targets (purple) and genes differentially expressed upon MK-2206 treatment in 2i (top) or at N24 (bottom) (DEGs, p value ≤ 0.05, grey). p values derived from hypergeometric tests of the overlaps are indicated. b Bootstrapping analysis (30,000 draws) of gene-sets of the same size as the sample gene sets (2i-specific, 200 genes; N24-specific, 731 genes; 2i&N24, 420 genes). The distribution of average log2FC is plotted. Empirical p values for the observed log2FC changes in FoxO1 target gene groups are shown. c Box plot showing the expression of core formative genes (n = 12) in WT cells after MK-2206 treatment in 2i, divided into FoxO1 N24 targets (blue) and non-targets (grey). Data are shown as log2FC relative to NT cells. p value from two-tailed Wilcoxon rank sum test is indicated. d Box plot showing the expression of core formative genes (n = 12) in WT cells after MK-2206 treatment at N24, divided into FoxO1 N24 targets (blue) or non-targets (grey). Data are shown as log2FC relative to NT cells. p value from two-tailed Wilcoxon rank sum test is indicated. e Box plot showing the expression of formative genes (n = 814) in WT cells treated with MK-2206 in 2i, divided into FoxO1 N24 targets (blue) or non-targets (grey). Data are shown as log2FC relative to NT cells. p value from two-tailed Wilcoxon rank sum test is shown. f Box plot showing the expression of naïve genes (n = 411) in WT cells treated with MK-2206 in 2i, divided into FoxO1 N24 targets (blue) or non-targets (grey). Data are shown as log2FC relative to NT cells. p value from two-tailed Wilcoxon rank sum test is indicated.
Fig. 7
Fig. 7. AKT signalling regulation of the naïve to formative pluripotency transition through FoxO TFs.
Schematic illustration of the proposed model of FoxO TF action at the exit from naïve pluripotency.

References

    1. Boroviak, T., Loos, R., Bertone, P., Smith, A. & Nichols, J. The ability of inner-cell-mass cells to self-renew as embryonic stem cells is acquired following epiblast specification. Nat. Cell Biol.16, 513–525 (2014).10.1038/ncb2965 - DOI - PMC - PubMed
    1. Kinoshita, M. & Smith, A. Pluripotency deconstructed. Dev. Growth Differ.60, 44–52 (2018). 10.1111/dgd.12419 - DOI - PubMed
    1. Kinoshita, M. et al. Capture of mouse and human stem cells with features of formative pluripotency. Cell Stem Cell28, 453–471.e8 (2021). 10.1016/j.stem.2020.11.005 - DOI - PMC - PubMed
    1. Nichols, J. & Smith, A. Naive and primed pluripotent states. Cell Stem Cell4, 487–492 (2009). 10.1016/j.stem.2009.05.015 - DOI - PubMed
    1. Smith, A. Formative pluripotency: the executive phase in a developmental continuum. Development144, 365–373 (2017). 10.1242/dev.142679 - DOI - PMC - PubMed

Publication types

MeSH terms

Associated data