. 2024 Sep 9;15(1):7885.
doi: 10.1038/s41467-024-51831-7.

Defective N-glycosylation of IL6 induces metastasis and tyrosine kinase inhibitor resistance in lung cancer

Affiliations

Defective N-glycosylation of IL6 induces metastasis and tyrosine kinase inhibitor resistance in lung cancer

Chun-Hua Hung et al. Nat Commun. .

Abstract

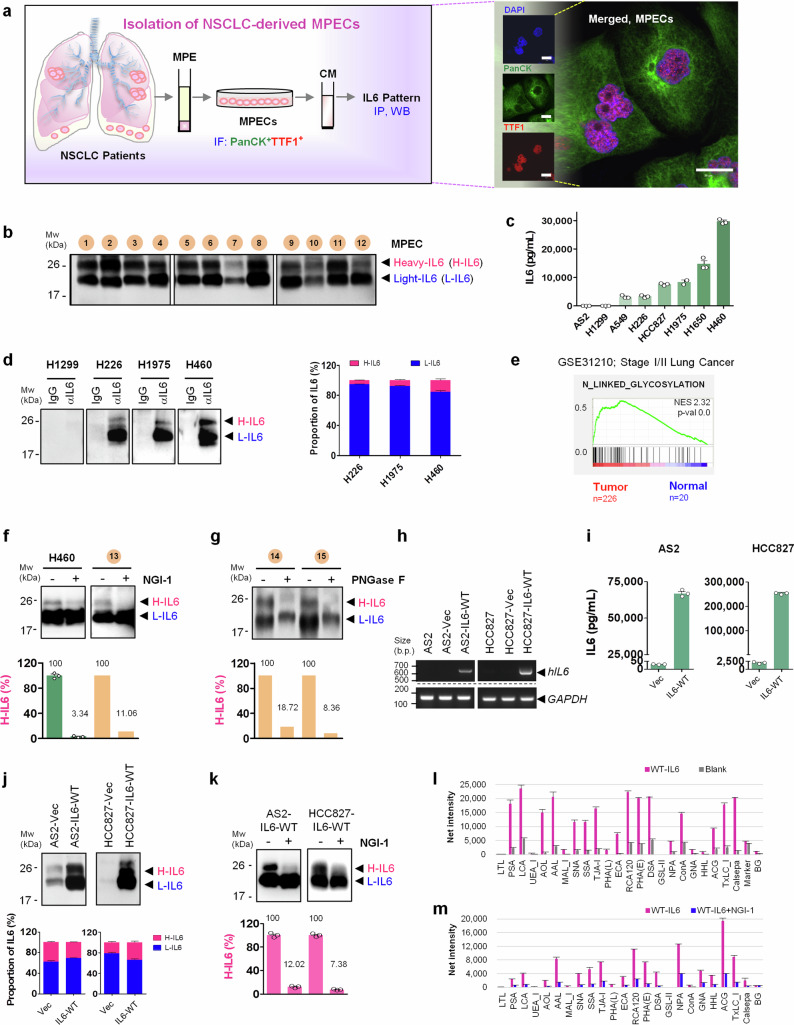
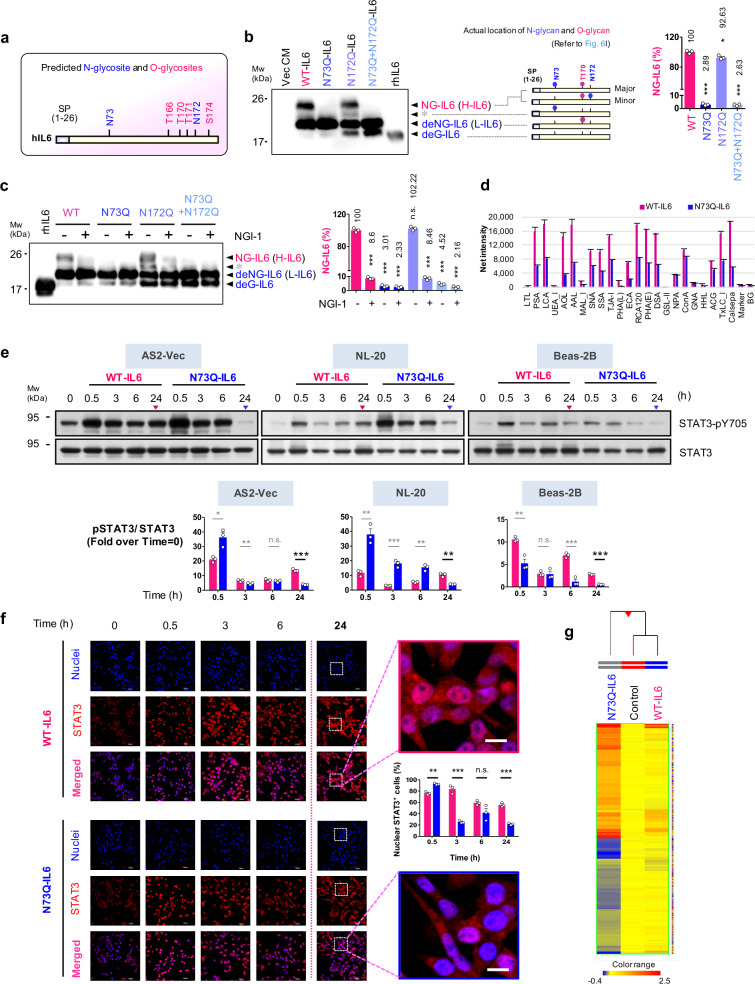
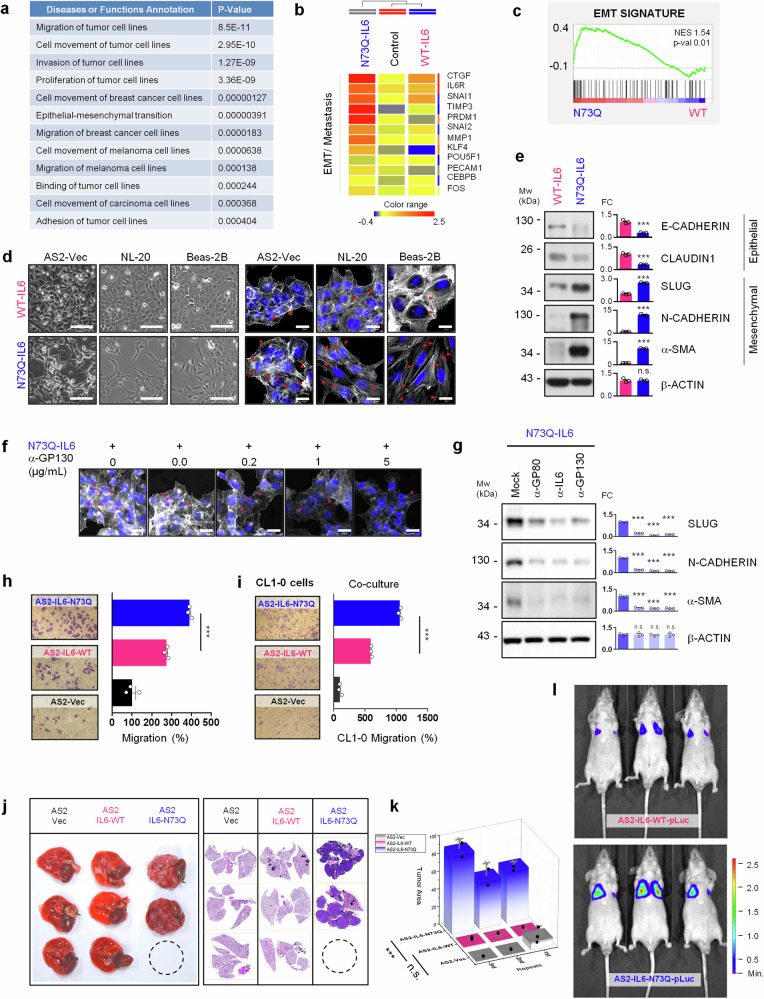
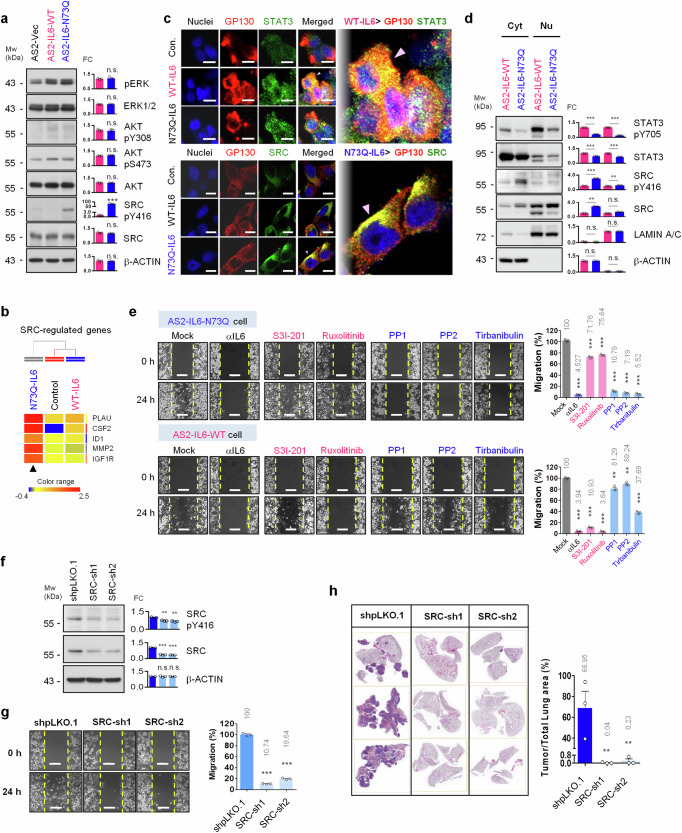
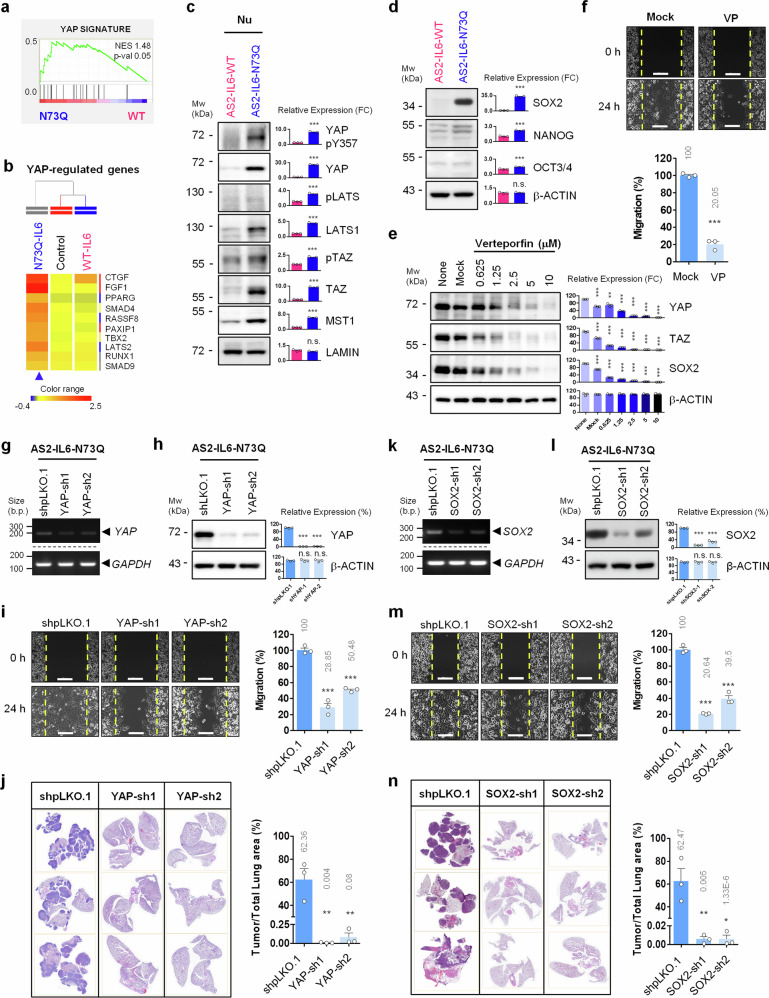
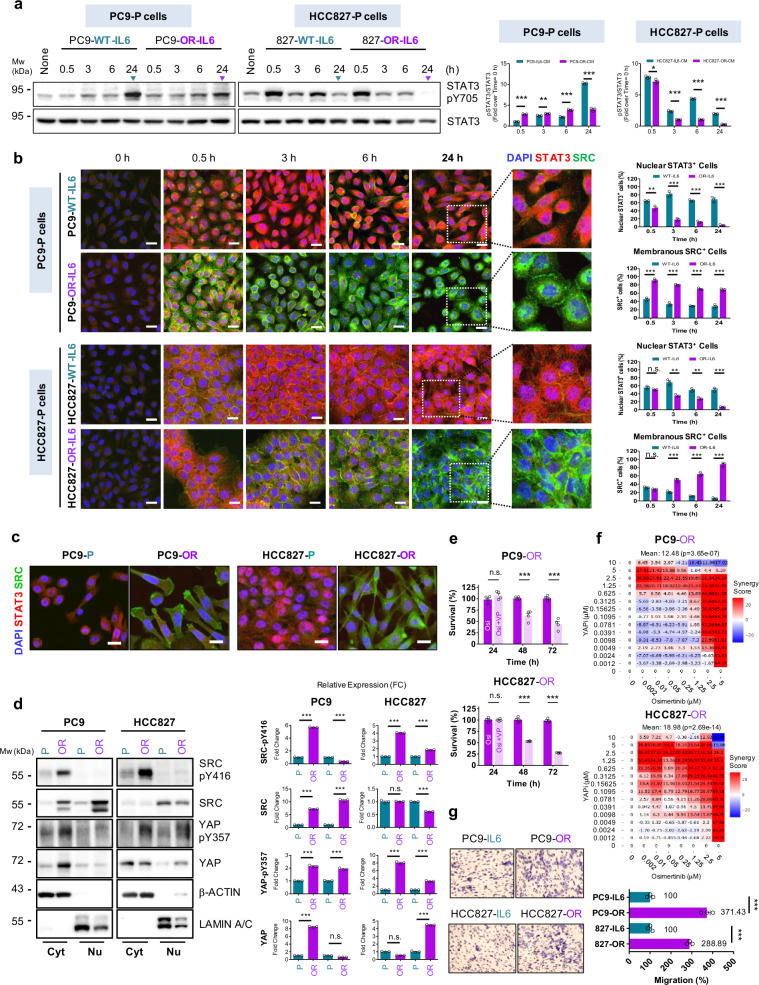
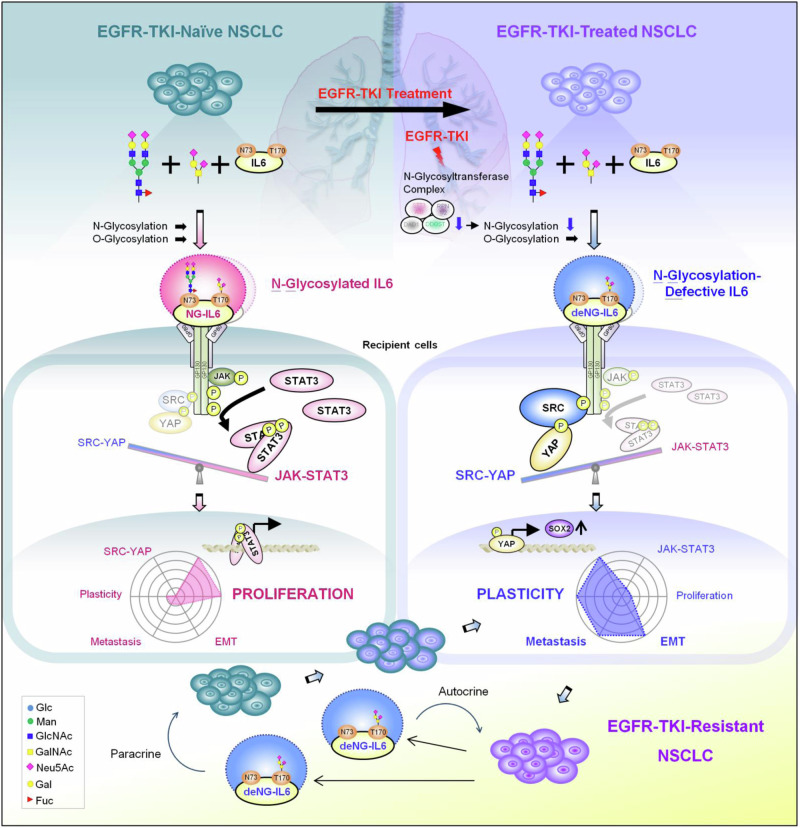
The IL6-GP130-STAT3 pathway facilitates lung cancer progression and resistance to tyrosine kinase inhibitors. Although glycosylation alters the stability of GP130, its effect on the ligand IL6 remains unclear. We herein find that N-glycosylated IL6, especially at Asn73, primarily stimulates JAK-STAT3 signaling and prolongs STAT3 phosphorylation, whereas N-glycosylation-defective IL6 (deNG-IL6) induces shortened STAT3 activation and alters the downstream signaling preference for the SRC-YAP-SOX2 axis. This signaling shift induces epithelial-mesenchymal transition (EMT) and migration in vitro and metastasis in vivo, which are suppressed by targeted inhibitors and shRNAs against SRC, YAP, and SOX2. Osimertinib-resistant lung cancer cells secrete a large amount of deNG-IL6 through reduced N-glycosyltransferase gene expression, leading to clear SRC-YAP activation. deNG-IL6 contributes to drug resistance, as confirmed by in silico analysis of cellular and clinical transcriptomes and signal expression in patient specimens. Therefore, the N-glycosylation status of IL6 not only affects cell behaviors but also shows promise in monitoring the dynamics of lung cancer evolution.


Conflict of interest statement

The authors declare no competing interests.

Figures

Fig. 1
Fig. 1. IL6 Is Modified by N-Glycosylation in NSCLC.
a Process of lung cancer cell isolation from malignant pleural effusions (MPEs) from lung cancer patients (generating MPE cells, MPECs). PanCK and TTF1 in MPECs were stained by immunofluorescence (IF). Images are representative of three technical replicates. Scale bar, 20 μm. b Pattern of immunoprecipitated (IP) secreted IL6 in the CM of MPECs (MPEC Nos. 1-12), as determined by Western blotting (WB). n = 1. The same process was used to analyze secreted IL6 throughout the study. c Quantity of total secreted IL6 in the NSCLC cell lines as measured by ELISAs. n = 3 technical replicates, mean ± SEM. d Patterns of secreted IL6 of NSCLC cell lines. n = 3 independent experiments, mean ± SEM. e Gene set enrichment analysis (GSEA) enrichment plot of N-linked glycosylation in cancerous lung tissue vs. normal lung tissue in the dataset GSE31210. NES, Nominal Enrichment Score. Nominal p-value was one-tailed test on the appropriate side of the null distribution. f Pattern of secreted IL6 in H460 cells (n = 3 independent experiments, mean ± SEM) and MPECs (MPEC No. 13, n = 1) treated with or without NGI-1 (10 μM) for 48 h. g Pattern of secreted IL6 in MPECs (MPEC Nos. 14 and 15) with or without PNGase F digestion (n = 1). h IL6 mRNA levels in the AS2 and HCC827 cells stably expressing full-length WT-hIL6 (namely, AS2-IL6-WT and HCC827-IL6-WT cells), as measured by RT-PCR. GAPDH was the internal control. i Quantity of total IL6 in the CM of AS2-IL6-WT and HCC827-IL6-WT cells, as measured by ELISAs (n = 3 technical replicates, mean ± SEM). j Pattern of secreted IL6 in AS2-IL6-WT and HCC827-IL6-WT cells. The percentage proportions of H-IL6 and L-IL6 were quantified in the segmented histogram. n = 3 independent experiments (mean ± SEM). k Effect of NGI-1 (10 μM) on the pattern of secreted IL6 in the CM of AS2-IL6-WT and HCC827-IL6-WT cells. n = 3 independent experiments (mean ± SEM). l Quantitative characterization of N-glycans on purified secreted WT-IL6 from CM of AS2-IL6-WT cells by lectin microarray, as assessed with GlycoStationTM Reader 1200 (GlycoTechnica). The raw data was calculated and output automatically by GlycoStation Tools Pro Suite 1.5 software. n = 3 technical replicates, mean ± S.D. See also Supplementary Table 1. m Quantitative characterization of N-glycans on purified secreted WT-IL6 from CM of AS2-IL6-WT cells treated with NGI-1 (10 μM) by lectin microarray, as assessed with GlycoStationTM Reader 1200 (GlycoTechnica). The raw data was calculated and output automatically by GlycoStation Tools Pro Suite 1.5 software. n = 3 technical replicates, mean ± S.D. See also Supplementary Table 1. Source data are provided as a Source Data file.
Fig. 2
Fig. 2. N-glycosylated IL6 promotes the tyrosine phosphorylation and nuclear retention of STAT3.
a Graphical depiction of N- and O- glycosites on the full-length human IL6 (hIL6) peptide. b Patterns of IL6 with various mutations in N-glycosites. Secreted WT-IL6, N73Q-IL6, N172Q-IL6, and N73Q + N172Q-IL6 were quantified and immunoprecipitated, and the pattern of IL6 was analyzed on the same WB with rhIL6 expressed in E. coli. NG-IL6: N-glycosylated IL6; deNG-IL6: N-glycosylation- defective IL6; deG-IL6: glycosylation-deficient IL6. The stick diagram connecting to each form of IL6 band labeled by dotted line showed the locations of glycan chains on N-glycosites and O-glycosites. n = 3 independent experiments, mean ± SEM, two-tailed unpaired t-test, ***p < 0.0001, *p = 0.0182, ***p < 0.0001. c Patterns of secreted IL6 in AS2-IL6-WT, AS2-IL6-N73Q, AS2-IL6-N172Q, and AS2-IL6-N73Q + N172Q cells with or without NGI-1 (10 μM) pretreatment for 48 h. n = 3 independent experiments, mean ± SEM, two-tailed unpaired t-test, ***p < 0.0001, ***p < 0.0001, ***p < 0.0001, n.s. p = 0.3423, ***p < 0.0001, ***p < 0.0001, ***p < 0.0001. d Quantitative characterization of N-glycans on purified secreted WT-IL6 and N73Q-IL6 by lectin microarray, as assessed with GlycoStationTM Reader 1200 (GlycoTechnica). The raw data was calculated and output automatically by GlycoStation Tools Pro Suite 1.5 software. n = 3 technical replicates, mean ± S.D. See also Supplementary Table 1. e STAT3 and STAT3-pY705 levels induced by WT-IL6-CM or N73Q-IL6-CM (both IL6 = 1 ng/mL) over time in AS2-Vec, Beas-2B, and NL-20 cells. n = 3 independent experiments, mean ± SEM, two-tailed unpaired t-test, AS2-Vec: *p = 0.0139, **p = 0.0282, n.s. 0.3663, ***0.0001; NL20: **0.0029, ***0.0004, **0.0014, **0.0010; Beas-2B: **0.0054, n.s. 0.9142, ***0.0006, ***<0.0001. The samples derived from the same experiment but different gels for STAT3 and STAT3-pY705 were processed in parallel. f STAT3 intracellular localization under treatment with WT-IL6-CM or N73Q-IL6-CM (both IL6 = 1 ng/mL) over time in AS2-Vec cells, as determined by IF. The magnified insets show STAT3 localization at 24 h. Scale bars, 20 μm. n = 3 independent experiments, mean ± SEM, two-tailed unpaired t-test, **p = 0.0012, ***p = 0.0002, n.s. p = 0.0939, ***p = 0.0001. g Transcriptome of AS2-Vec cells treated with WT-IL6-CM or N73Q-IL6-CM over time (see also Supplementary Fig. 10). Hierarchical clustering showed differentially expressed genes at 3 h. Source data are provided as a Source Data file.
Fig. 3
Fig. 3. deNG-IL6 Induces EMT, Migration, and Metastasis in NSCLC.
a IPA-identified “Disease and Functional Annotation” in the N73Q-IL6-CM-treated cells. A significant correlation was defined as p < 0.001, evaluated by a right-tailed Fisher’s Exact Test. b Hierarchical clustering of the IPA-enriched EMT/metastasis-related genes. c GSEA enrichment plot of EMT process-related genes in the AS2-Vec cells under WT-IL6-CM and N73Q-IL6-CM treatment. Nominal p-value was one-tailed test on the appropriate side of the null distribution. d The morphology of (bright field, left panel, scale bars, 200 μm) and F-ACTIN stress fibers (IF, right panel, scale bars, 20 μm) in AS2-Vec, Beas-2B, and NL-20 cells under WT-IL6-CM or N73Q-IL6-CM treatment (24 h) are shown. F-ACTIN was stained with phalloidin-TRITC (gray) and detected with an FV3000 microscope (60x). e Expression of EMT-associated proteins in AS2-Vec cells treated with WT-IL6-CM or N73Q-IL6-CM for 24 h. n = 3 independent experiments, mean ± SEM, two-tailed unpaired t-test, E-CADHERIN: ***p = 0.0005; CLAUDIN1: ***p < 0.0001; SLUG: ***p < 0.0001; N-CADHERIN: ***p < 0.0001; α-SMA: ***p < 0.0001; β-ACTIN: n.s. p = 0.9997. The samples derived from the same experiment but different gels for E-CADHERIN, CLAUDIN1, SLUG, N-CADHERIN, α-SMA, and β-ACTIN were processed in parallel. f Stress fibers in the AS2-Vec cells under N73Q-IL6-CM treatment (24 h) with or without α-GP130 neutralizing Ab pretreatment (2 h). Images are representative of three independent experiments. Scale bars, 20 μm. See also Supplementary Fig. 12. g Expression of mesenchymal proteins in AS2-Vec cells under N73Q-IL6-CM treatment (24 h) with α-GP80, α-IL6, and α-GP130 neutralizing Ab pretreatment for 2 h. n = 3 independent experiments, mean ± SEM, two-tailed unpaired t-test, SLUG: ***p < 0.0001, ***p < 0.0001, ***p < 0.0001; N-CADHERIN: ***p < 0.0001, ***p = 0.0001, ***p < 0.0001; α-SMA: ***p = 0.0001, ***p < 0.0001, ***p < 0.0001; β-ACTIN: n.s. p = 0.9926, n.s. p = 0.6517, n.s. p = 0.8847. The samples derived from the same experiment but different gels for SLUG, N-CADHERIN, α-SMA, and β-ACTIN were processed in parallel. h Migration of AS2-Vec, AS2-IL6-WT, and AS2-IL6- N73Q cells through Transwell membranes n = 3 independent experiments, mean ± SEM, two-tailed unpaired t-test, ***p = 0.0001. i Migration of CL1-0 cells in a Transwell coculture system cocultured with AS2-Vec, AS2-IL6-WT, and AS2-IL6-N73Q cells. n = 3 independent experiments, the percentage of migrated CL1-0 cells is presented as the mean ± SEM, two-tailed unpaired t-test, ***p < 0.0001. j In vivo metastasis of AS2-Vec, AS2-IL6-WT, and AS2-IL6-N73Q cells injected intravenously into nude mice (n = 3 per cell type, 3 repeated independent experiments; see also Supplementary Fig. 15) evaluated by gross anatomical examination (left) and TissueFAXS-imaged H&E staining (right). Each replicate experiment was terminated upon the death of the first animal; the necrotic lungs in these mice are indicated by dashed circles and were not used in further experiments. k The tumor area over the total lung area from (J), as quantified by HistoQuest. n = 3 independent animals for each glycoform in each experiment, 3 independent experiments, mean ± SEM, two-way ANOVA. l In vivo metastasis of AS2-IL6-WT-pLuc and AS2-IL6-N73Q-pLuc cells in nude mice after i.v. injection (n = 3 per cell type) detected with IVIS. Source data are provided as a Source Data file.
Fig. 4
Fig. 4. deNG-IL6 Switches the GP130 Signaling Preference from the JAK-STAT3 Axis to the SRC-YAP Axis.
a Expression of proteins indicating the activation of ERK, AKT, and SRC in AS2-Vec, AS2-IL6-WT, and AS2-IL6-N73Q cells. n = 3 independent experiments, mean ± SEM, two-tailed unpaired t-test, pERK: n.s. p = 0.5646; ERK1/2: n.s. p = 0.9914; AKTpY308: n.s. p = 0.6477; AKTpS473: n.s. p = 0.0967; AKT: n.s. p = 0.7452; SRCpY416: ***p < 0.0001; SRC: n.s. 0.2598; β-ACTIN: n.s. p = 1.000. FC: fold change relative to AS2-IL6-WT. The samples derived from the same experiment but different gels for pERK, ERK1/2, AKTpY308, AKTpY473, AKT, SRCpY416, SRC, and β-ACTIN were processed in parallel. b Hierarchical clustering of N73Q-IL6-induced genes downstream of SRC identified by IPA. c Recruitment of STAT3 and SRC to WT-IL6- and N73Q-IL6-activated GP130 determined based on IF images acquired with an FV3000 microscope (60x). Images are representative of three technical replicates. Scale bars, 20 μm. d Expression of proteins indicating the activation of STAT3 and SRC in the cytosolic and nuclear fractions of the AS2-IL6-WT and AS2-IL6-N73Q cells. n = 3 independent experiments, mean ± SEM, two-tailed unpaired t-test, STAT3pY705: ***p < 0.0001, ***p < 0.0001; STAT3: ***p < 0.0001, ***p < 0.0001; SRCpY416: ***p < 0.0001, **p = 0.0065; SRC: ***p < 0.0001, **p = 0.0075; LAMIN A/C: n.s. p = 0.1567, n.s. p = 1.0000; β-ACTIN: n.s. p = 1.0000, n.s. p = 1.0000. FC: fold change relative to AS2-IL6-WT. The samples derived from the same experiment but different gels for STAT3pY705, STAT3, SRCpY416, SRC, LAMIN A/C, and β-ACTIN were processed in parallel. e Effect of IL6 antibody (5 μg/mL), JAK-STAT3 inhibitors (S3I-201 = 10 μM, ruxolitinib = 2.5 μM), and SRC inhibitors (PP1 = 10 μM, PP2 = 10 μM, tirbanibulin = 10 μM) on the migration of AS2-IL6-WT and AS2-IL6-N73Q cells through the space made by culture inserts. Images were obtained at 0 and 24 h. Scale bars, 200 μm. Quantitative results are next to the images. n = 3 independent experiments, mean ± SEM, two-tailed unpaired t-test, AS2-IL6-N73Q cells: ***p < 0.0001, ***p < 0.0001, ***p < 0.0001, ***p < 0.0001, ***p < 0.0001, ***p < 0.0001; AS2-IL6-WT cells: ***p < 0.0001, ***p < 0.0001, ***p < 0.0001, **p = 0.0026, **p = 0.0082, ***p < 0.0001. f Expression of SRC in the AS2-IL6-N73Q cells transduced with shSRC-bearing VSV-G particles. n = 3 independent experiments, mean ± SEM, one-tailed unpaired t-test, SRCpY416: **p = 0.0022, **p = 0.0011; SRC: ***p < 0.0001, ***p < 0.0001; β-ACTIN: n.s. p = 0.4500, n.s. p = 0.4267. FC: fold change relative to shpLKO.1. The samples derived from the same experiment but different gels for STAT3pY705, STAT3, SRCpY416, SRC, and β-ACTIN were processed in parallel. g Migration of the SRC-silenced AS2-IL6-N73Q cells. Scale bars, 200 μm. n = 3 independent experiments, mean ± SEM, one-tailed unpaired t-test, ***p < 0.0001, ***p < 0.0001. h In vivo metastasis of SRC-silenced AS2-IL6-N73Q cells injected intravenously into nude mice (n = 3 per cell type). TissueFAXS-acquired images of H&E-stained lungs are shown (left). The tumor area over the total lung area was quantified by HistoQuest. n = 3 animals in each group, mean ± SEM, one-tailed unpaired t-test, **p = 0.0062, **p = 0.0062. Source data are provided as a Source Data file.
Fig. 5
Fig. 5. SOX2 Contributes to deNG-IL6-Induced SRC-YAP Axis-Promoted Migration and Metastasis.
a GSEA enrichment plot for the conserved YAP signature in the AS2-Vec cells under WT-IL6 and N73Q-IL6 treatment. Nominal p-value was one-tailed test on the appropriate side of the null distribution. b Hierarchical clustering of the N73Q-IL6-induced YAP downstream genes identified by IPA. c Expression of YAP pathway-associated proteins in the nuclear fraction of the AS2-IL6-WT and AS2- IL6-N73Q cells. n = 3 independent experiments, mean ± SEM, two-tailed unpaired t-test, YAPpY357: ***p < 0.0001; YAP: ***p < 0.0001; pLATS: ***p = 0.0001; LATS1: ***p < 0.0001; pTAZ: ***p = 0.0001; TAZ: ***p < 0.0001; MST1: ***p < 0.0001; LAMIN A/C: n.s. p = 0.0779. FC: fold change relative to AS2-IL6-WT. The samples derived from the same experiment but different gels for YAPpY357, YAP, pLATS, LATS1, pTAZ, TAZ, MST1, and LAMIN A/C were processed in parallel. d Expression of stemness-associated proteins in the AS2-IL6-WT and AS2-IL6-N73Q cells. n = 3 independent experiments, mean ± SEM, two-tailed unpaired t-test, SOX2: ***p < 0.0001; NANOG: ***p < 0.0001; OCT3/4: ***p = 0.0010; β-ACTIN: n.s. p = 0.9814. FC: fold change relative to AS2-IL6-WT. The samples derived from the same experiment but different gels for SOX2, NANOG, OCT3/4, and β-ACTIN were processed in parallel. e Expression of stemness-associated proteins in the AS2-IL6-N73Q cells treated with YAPi VP at increasing doses. n = 3 independent experiments, percentage expression relative to none, mean ± SEM, two-tailed unpaired t-test, YAP: ***p < 0.0001, **p = 0.0013, ***p < 0.0001, ***p < 0.0001, ***p < 0.0001, ***p < 0.0001; TAZ: ***p = 0.0001, ***p < 0.0001, ***p < 0.0001, ***p < 0.0001, ***p < 0.0001, ***p < 0.0001; SOX2: ***p < 0.0001, ***p < 0.0001, ***p < 0.0001, ***p < 0.0001, ***p < 0.0001, ***p < 0.0001; β-ACTIN: n.s. p = 0.5000, n.s. p = 0.5000, n.s. p = 0.5000, n.s. p = 0.5000, n.s. p = 0.5000, n.s. p = 0.5000. The samples derived from the same experiment but different gels for YAP, TAZ, SOX2, and β-ACTIN were processed in parallel. f Migration of the AS2-IL6-N73Q cells under VP treatment. n = 3 independent experiments, mean ± SEM, one-tailed unpaired t-test, ***p < 0.0001. g Expression of the YAP gene (g) and YAP protein (h) in the AS2-IL6-N73Q cells transduced with shSRC-bearing VSV-G particles. n = 3 independent experiments, percentage expression relative to shpLKO.1, mean ± SEM, one-tailed unpaired t-test, YAP: ***p < 0.0001, ***p < 0.0001; β-ACTIN: n.s. p = 0.5000, n.s. p = 0.5000. The cDNA or protein samples derived from the same experiment but different gels for YAP, GAPDH, YAP, and β-ACTIN were processed in parallel. i Migration of the YAP-silenced AS2-IL6-N73Q cells. Scale bars, 200 μm. n = 3 independent experiments, mean ± SEM, one-tailed unpaired t-test, ***p = 0.0001, ***p < 0.0001. j In vivo metastasis of the YAP-silenced AS2-IL6-N73Q cells injected intravenously into nude mice (n = 3 per cell type). TissueFAXS-acquired images of H&E-stained lungs are shown (left). The tumor area over the total lung area was quantified by HistoQuest. n = 3 animals in each group, mean ± SEM, one-tailed unpaired t-test, **p = 0.0015, **p = 0.0015. k Expression of SOX2 mRNA (k) and protein (l) in the SOX2-silenced AS2-IL6-N73Q cells. n = 3 independent experiments, percentage expression relative to shpLKO.1, mean ± SEM, one-tailed unpaired t-test, SOX2: ***p < 0.0001, ***p < 0.0001; β-ACTIN: n.s. p = 0.5000, n.s. p = 0.5000. The cDNA or protein samples derived from the same experiment but different gels for SOX2, GAPDH, SOX2, and β-ACTIN were processed in parallel. m Migration of the SOX2-silenced AS2-IL6-N73Q cells. Scale bars, 200 μm. n = 3 independent experiments, mean ± SEM, one-tailed unpaired t-test, *** p < 0.0001, ***p = 0.0001. n In vivo metastasis of the SOX2-silenced AS2-IL6-N73Q cells intravenously injected into nude mice (n = 3 per cell type). TissueFAXS-acquired images of H&E-stained lungs are shown (left). The tumor area over the total lung area was quantified by HistoQuest. n = 3 animals in each group, mean ± SEM, one-tailed unpaired t-test, **p = 0.0023, *p = 0.0023. Source data are provided as a Source Data file.
Fig. 6
Fig. 6. Inhibition of osimertinib-induced deNG-IL6 restores TKI sensitivity in TKI-resistant NSCLC.
a Survival of parental and OR PC9 and HCC827 cells with osimertinib treatment (72 h). n = 6 independent experiments per data point, mean ± SEM. b Levels of IL6 secreted by the parental and OR PC9 and HCC827 cells after 72 h of attachment. n= 3 technical replicates, mean ± SEM, two-tailed unpaired t-test, PC9-OR: ***p < 0.0001; HCC827-OR: ***p < 0.0001. c mRNA expression of IL6 in OR cells transduced with shIL6-expressing VSV-G particles. The samples were derived from the same experiment for IL6 and GAPDH were seperated in the same gel. d Quantity of total secreted IL6 in OR-shIL6 cells as measured by ELISAs. n = 3 technical replicates, mean ± SEM, one-tailed unpaired t-test, PC9-OR: ***p < 0.0001; HCC827-OR: ***p < 0.0001. e Morphology of OR and OR-shIL6 cells treated with osimertinib (5 μM) for 72 h. Scale bar, 100 μm. f Survival of PC9-OR-shIL6 and HCC827-OR-shIL6 cells treated with osimertinib at 5 μM (72 h). n = 3 independent experiments, mean ± SEM, two-tailed unpaired t-test, PC9-OR: ***p < 0.0001; HCC827-OR: ***p < 0.0001. g Pattern of secreted IL6 in the parental and OR PC9 and HCC827 cells. Because the PC9-P and HCC827-P cells secreted little IL6, which prevented analysis of its glycosylation pattern, we established PC9-IL6-WT and HCC827-IL6-WT cells as control cell lines. The proportions of heavy IL6 in these cells were quantified and are shown in the right panel. n = 3 independent experiments, mean ± SEM, two-tailed unpaired t-test, PC9-OR: ***p < 0.0001; HCC827-OR: ***p < 0.0001. h GSEA of N-linked glycosylation pathways and EMT, SRC and YAP activation statuses in the transcriptome dataset GSE106765 from the HCC827-OR-Taka cells. Nominal p-value was one-tailed test on the appropriate side of the null distribution. i Expression of N-OST genes in the parental and OR PC9 and HCC827 cells, as detected by qPCR. n = 3 independent experiments, mean ± SEM, one-tailed unpaired t-test, PC9-OR: **p = 0.0065, *p = 0.0193, n.s. p = 0.1579, ***p < 0.0001, **p = 0.0099, **p = 0.0047; HCC827-OR: 827-OR: ***p < 0.0001, ***p < 0.0001, *p = 0.0160, ***p = 0.004, **p = 0.0025, **p = 0.0014. j N-glycosylated IL6 detected by lectin blotting with wheat germ agglutinin (WGA). The proportions of WGA-detected NG-IL6 in WT-IL6 or OR-IL6 were quantified and are shown in the right panel. n = 3 independent experiments, mean ± SEM, one-tailed unpaired t-test, PC9-OR: ***p < 0.0001; HCC827-OR: ***p < 0.0001. k Quantitative characterization of N-glycans on purified secreted WT-IL6 or OR-IL6 from CM of PC9 or HCC827 cell derivatives by lectin microarray, as assessed with GlycoStationTM Reader 1200 (GlycoTechnica). The raw data was calculated and output automatically by GlycoStation Tools Pro Suite 1.5 software. n = 3 technical replicates, mean ± S.D. See also Supplementary Table 1. l Characterization of glycosylation in IL6 by MS. See also Supplementary Fig. 22. m Pattern of secreted WT-IL6 or OR-IL6 with or without PNGase F digestion. The percentage proportions of H-IL6 and L-IL6 were quantified in the segmented histogram. n = 3 independent experiments, mean ± SEM. Source data are provided as a Source Data file.
Fig. 7
Fig. 7. Osimertinib-induced deNG-IL6 activates the SRC-YAP-SOX2 axis and migration in TKI-resistant NSCLC.
a STAT3 and STAT3-pY705 levels induced by PC9-IL6-CM, PC9-OR-CM, HCC827-IL6-CM, or HCC827-OR-CM (IL6 = 1 ng/mL) over time in PC9-P or HCC827-P cells. n = 3 independent experiments, mean ± SEM, two-tailed unpaired t-test, PC9: ***p < 0.0001, **p = 0.0044, ***p < 0.0001, ***p = 0.0001; HCC-827: *p = 0.0324, ***p < 0.0001, ***p < 0.0001, ***p < 0.0001. The samples derived from the same experiment but different gels for STAT3 and STAT3-pY705 were processed in parallel. b Intracellular localization of STAT3 and SRC in PC9-P or HCC827-P cells treated with PC9-IL6-CM, PC9-OR-CM, HCC827-IL6-CM, or HCC827-OR-CM (IL6 = 1 ng/mL) over time, as determined by IF. The magnified insets show STAT3 or SRC localization at 24 h. Scale bars, 20 μm. n = 3 independent experiments, mean ± SEM, two-tailed unpaired t-test, PC9-STAT3: **p = 0.0085, ***p = 0.002, ***p < 0.0001, ***p < 0.0001; PC9-SRC: ***p = 0.0002, ***p < 0.0001, ***p < 0.0001, ***p = 0.0002; HCC827-STAT3: n.s. p = 0.1262, **p = 0.0018, **p = 0.0025, ***p = 0.0001; HCC827-SRC: n.s. p = 0.0803, ***p = 0.0007, ***p < 0.0001, ***p < 0.0001. c Intracellular localization of STAT3 and SRC in PC9-OR and HCC827-OR cells as determined based on IF images acquired with an FV3000 microscope (60x). Images are representative of n = 3 independent experiments. Scale bars, 20 μm. d Expression of proteins indicating the activation of SRC and YAP in the cytosolic and nuclear fractions of the parental and OR PC9 and HCC827 cells. n = 3 independent experiments, expression fold change (FC) relative to corresponding parental cells, mean ± SEM, two-tailed unpaired t-test, PC9-SRCpY416: ***p < 0.0001, ***p < 0.0001; PC9-SRC: ***p < 0.0001, ***p < 0.0001; PC9-YAPpY357: ***p < 0.0001, ***p < 0.0001; PC9-YAP: ***p < 0.0001, ***p = 0.0004; HCC827-SRCpY416: ***p < 0.0001, ***p < 0.0001; HCC827-SRC: n.s. p = 0.8569, ***p < 0.0001; HCC827-YAP-pY357: ***p < 0.0001, ***p < 0.0001; HCC827-YAP: ***p < 0.0001, ***p < 0.0001. The samples derived from the same experiment but different gels for SRCpY416, SRC, YAPpY357, YAP, β-ACTIN, and LAMIN A/C were processed in parallel. e Time-dependent survival of the PC9-OR and HCC827-OR cells under treatment with osimertinib (5 μM) in combination with VP (5 μM). n = 4 independent experiments, mean ± SEM, two-tailed unpaired t-test, PC9-OR: n.s. p = 0.7764, ***p = 0.0006, ***p = 0.0001; HCC827-OR: n.s. p = 0.9049, ***p < 0.0001, ***p < 0.0001. f Analysis of the synergistic effect in PC9-OR and HCC827-OR cells treated with osimertinib in combination with DMSO or VP at various concentration combinations by Synergy Finder Plus under the two-tailed Zero interaction potency (ZIP) model. g Migration of PC9-IL6, PC9-OR, HCC827-IL6, and HCC827-OR cells through Transwell membranes. n = 4 independent experiments, mean ± SEM, two-tailed unpaired t-test, PC9: ***p = 0.0001, HCC827: ***p < 0.0001. Source data are provided as a Source Data file.
Fig. 8
Fig. 8. EGFR TKI-resistant NSCLC patients show high deNG-IL6 expression and a shift signaling preference from JAK-STAT3 to the SRC-YAP axis.
a Pattern of secreted IL6 in MPECs derived from MPE of EGFR-TKI-naïve (TN01-TN04) and EGFR-TKI-resistant (TR01-TR05) patients as detected by WB (n = 1). b N-glycosylated IL6 detected by lectin blotting with WGA (n = 1). c Percentage proportions of NG-IL6 and deNG-IL6 in the CM of EGFR-TKI-naïve and EGFR-TKI-resistant MPECs (n = 1). d GSEA enrichment plot showing genes related to the N-glycosylation process derived from transcriptome data for patient tumors before and after the development of osimertinib resistance named OSTu and ORTu, respectively. Sequential process by which 15 patients were selected according to the indicated criteria (left panel). The right panel shows the GSEA enrichment plots for N-glycosylation signature genes (right panel, top) and heatmaps for the enrichment scores (right panel, bottom) of selected patients (determined by Morpheus). Nominal p-value was one-tailed test on the appropriate side of the null distribution. e Expression and intracellular location of STAT3 and SRC in paired lung cancer tissues from six NSCLC patients (TKI_01-TKI_06) before (TKI-naïve) and after development of resistance (TKI resistant) to EGFR TKI as determined by TissueFAXS-imaged IF (see also Supplementary Fig. 28 for H&E staining). The paired tissues from the same patient were attached to the same slide to perform IF staining. Images are selected magnified region from the full tissue. Scale bars, 20 μm. f Expression of nuclear STAT3 and membranous SRC as quantified by TissueQuest. Source data are provided as a Source Data file.
Fig. 9
Fig. 9. Long-Term EGFR TKI Treatment Induces deNG-IL6 to Drive Resistance.
In non-small cell lung cancer (NSCLC) cells, autocrine IL6 (NG-IL6) predominantly exhibits N-glycosylation at residue N73 and O-glycosylation at residue T170 in an EGFR TKI-naïve environment. NG-IL6 predominantly activates the canonical JAK-STAT3 axis, promoting cell proliferation. However, long-term treatment with EGFR TKIs leads to increased secretion of IL6 while concurrently suppressing the expression of N-glycosyltransferase complex components, primarily STT3A or STT3B, RPN1/2, DAD1, and DDOST. This suppression results in diminished N-glycosylation at N73 of NG-IL6, which subsequently reduces N-glycosylation at N73 of NG-IL6. Consequently, the proportion of NG-IL6 decreases, while the proportion of deNG-IL6 increases upon the acquisition of resistance. deNG-IL6, in turn, shifts signaling preference from the JAK-STAT3 axis to the SRC-YAP-SOX2 axis. The alternatively activated SRC-YAP-SOX2 signaling facilitates cellular plasticity and contributes to the development of drug resistance.

References

    1. Yu, H., Lee, H., Herrmann, A., Buettner, R. & Jove, R. Revisiting STAT3 signalling in cancer: new and unexpected biological functions. Nat. Rev. Cancer14, 736–746 (2014). 10.1038/nrc3818 - DOI - PubMed
    1. Jones, S. A. & Jenkins, B. J. Recent insights into targeting the IL-6 cytokine family in inflammatory diseases and cancer. Nat. Rev. Immunol.18, 773–789 (2018). 10.1038/s41577-018-0066-7 - DOI - PubMed
    1. Rose-John, S. The soluble interleukin 6 receptor: advanced therapeutic options in inflammation. Clin. Pharmacol. Therapeut.102, 591–598 (2017). 10.1002/cpt.782 - DOI - PubMed
    1. Trikha, M., Corringham, R., Klein, B. & Rossi, J. F. Targeted anti-interleukin-6 monoclonal antibody therapy for cancer: a review of the rationale and clinical evidence. Clin. Cancer Res.9, 4653–4665 (2003). - PMC - PubMed
    1. Hunter, C. A. & Jones, S. A. IL-6 as a keystone cytokine in health and disease. Nat. Immunol. 16, 448–457 (2015). 10.1038/ni.3153 - DOI - PubMed

Publication types

MeSH terms

Substances