. 2024 Sep 9;15(1):7860.
doi: 10.1038/s41467-024-52069-z.

Identification of an embryonic differentiation stage marked by Sox1 and FoxA2 co-expression using combined cell tracking and high dimensional protein imaging

Affiliations

Identification of an embryonic differentiation stage marked by Sox1 and FoxA2 co-expression using combined cell tracking and high dimensional protein imaging

Geethika Arekatla et al. Nat Commun. .

Abstract

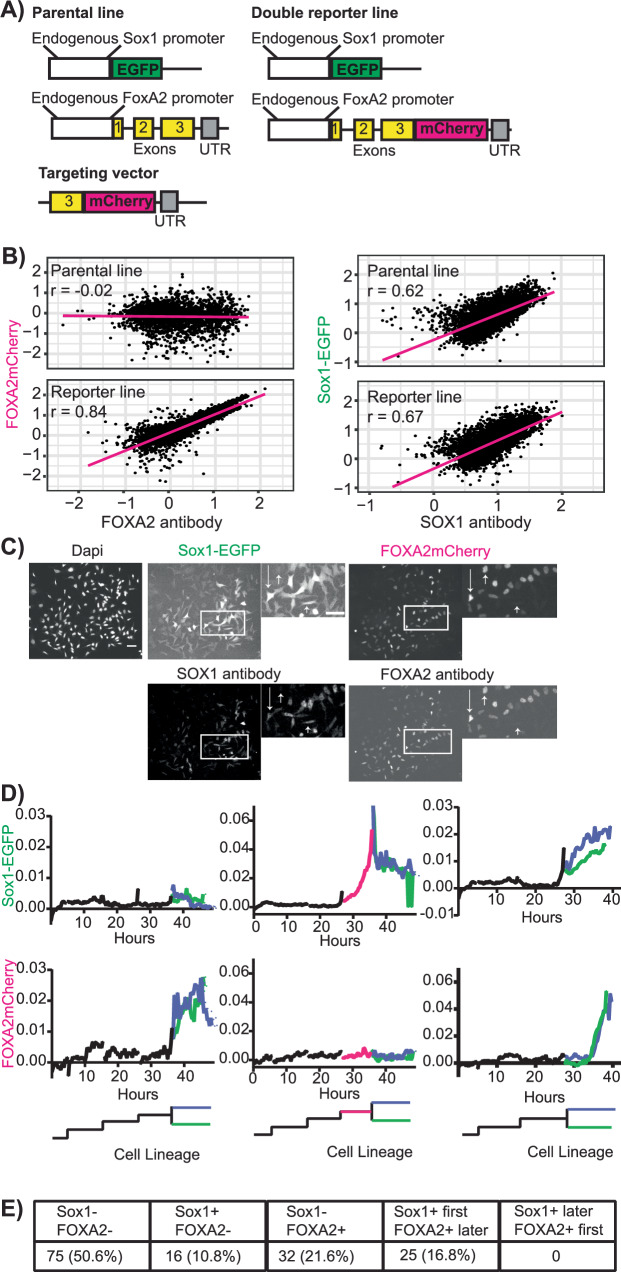
Pluripotent mouse embryonic stem cells (ESCs) can differentiate to all germ layers and serve as an in vitro model of embryonic development. To better understand the differentiation paths traversed by ESCs committing to different lineages, we track individual differentiating ESCs by timelapse imaging followed by multiplexed high-dimensional Imaging Mass Cytometry (IMC) protein quantification. This links continuous live single-cell molecular NANOG and cellular dynamics quantification over 5-6 generations to protein expression of 37 different molecular regulators in the same single cells at the observation endpoints. Using this unique data set including kinship history and live lineage marker detection, we show that NANOG downregulation occurs generations prior to, but is not sufficient for neuroectoderm marker Sox1 upregulation. We identify a developmental cell type co-expressing both the canonical Sox1 neuroectoderm and FoxA2 endoderm markers in vitro and confirm the presence of such a population in the post-implantation embryo. RNASeq reveals cells co-expressing SOX1 and FOXA2 to have a unique cell state characterized by expression of both endoderm as well as neuroectoderm genes suggesting lineage potential towards both germ layers.


Conflict of interest statement

The authors declare no competing interests.

Figures

Fig. 1
Fig. 1. Combined timelapse and Imaging Mass Cytometry of differentiating ESCs reveals heterogeneous protein expression even between closely related individual cells in the same media conditions.
A Experimental workflow. B Imaging data reveals heterogeneous protein expression at the single cell level. Representative example in RA medium. Nucleus labelled by iRFPnucmem in timelapse images. Scale bar 50 um. Lineage data and NANOGVenus quantification over 46 h and 5 generations. Branches terminating before 46 h due to cell death (X) also shown. Corresponding cell and progeny (pink circles) highlighted in primary imaging data. See also Supplementary Fig. 1B for complete field of view of this zoomed-in image. C Quantification of protein expression in different media conditions obtained by IMC at 46 h, plotted as distribution of expression profile of each protein per condition n > 9000 cells per media condition from 2 biological replicates. D UMAP dimensionality reduction fails to separate cells into distinct fate marker enriched populations. Cells colored by culture media (top left) or antibody expression levels (rest). Dimensions used include all 37 protein markers. n > 34000 cells from 2 biological replicates. E Representative example of thresholding proteins upregulated upon differentiation (SOX1 from IMC quantification). Threshold value (pink) and % SOX1+ cells in per condition. n > 9000 cells per condition from two biological replicates. F Representative example of threshold determination for proteins downregulated during differentiation (NANOG from IMC). Bimodal expression fitted with gamma distributions (yellow) and threshold value (pink) at intersection of the two distributions. Proportions of cells in NANOG+ class per condition as indicated. n > 9000 cells per condition from two biological replicates.
Fig. 2
Fig. 2. Nanog dynamics, cell motility and lifetime are not indicators of neuroectoderm marker Sox1 expression.
A, B Live cell NANOG reporter expression per generation. Manual threshold (black). N > 25000/ > 40000 data points from complete lifetimes of each tracked cell in 52/71 trees from 2/2 biological replicates in A (SerumLIF)/B (RA). C NANOG downregulation occurs two generations prior to, but is not sufficient for, Sox1 expression. Ancestral NANOG levels of SOX1+ Decision Cells (left) and SOX1- cells (right). Decision Cells (rectangle box) detected as shown graphically (see Methods). “+-” means current cell is NANOG+ and its mother cell is NANOG-, and so on. N = 66 Decision Cells and 294 SOX1- cells from two biological replicates. *p = 0.04, **p = 0.007, ns: not significant p = 0.06, 0.87, 0.31 (2, 3, 4 gen up), Two-sided Fisher’s exact test, with cells in yellow as category 1 and all other combinations grouped together. D ESCs in SerumLIF have longer cell lifetimes. N > 850 cells per condition from 2 biological replicates. Dotted lines represent 25th, 50th and 75th percentile values. ****p < 0.0001, Two-tailed unpaired t-test. E Difference in cell lifetime persists over generations. From generation 1–4, n = 102, 200, 325, 233 cells in SerumLIF and from generation 1–5, n = 136, 246, 398, 517, 259 cells in RA from 2 biological replicates. Error bars: means ± SDs. ****p < 0.0001, ***p = 0.0002, 0.0005 (Gen 1, 2), 2-way ANOVA corrected for multiple comparisons. F SOX1+ and SOX1- cells in RA have similar lifetimes. N = 120 SOX1+ and n > 1500 SOX1- cells from 2 biological replicates. Dotted lines: 25th, 50th and 75th percentile values. *p = 0.02, Two-tailed unpaired t-test. G Cells in RA are more motile. N > 900 cells per condition from 2 biological replicates. Dotted lines: 25th, 50th and 75th percentile values. ****p < 0.0001, Two-tailed unpaired t-test. Graph magnified. Original in Supplementary Fig. 3E. H Difference in cell motility in persists over generations. From generation 0-4, n = 52, 102, 200, 325, 233 cells in SerumLIF and from generation 0-5, n = 70, 136, 246, 398, 517, 259 cells in RA from 2 biological replicates. Error bars: means ± SDs. ****p = 6.76E-06, 6.45E-09, 1.23E-13, 4.55E-05 (Gen1, 2, 3, 4), ns: not significant p = 0.71, 2-way ANOVA corrected for multiple comparisons. I SOX1+ and SOX1- cells in RA have similar speeds. n > 300 SOX1+ and n > 3000 SOX1- cells from 2 biological replicates Dotted lines represent 25th, 50th and 75th percentile values. ns: not significant p = 0.95, Two-tailed unpaired t-test.
Fig. 3
Fig. 3. A cell population co-expressing canonical ectoderm and endoderm lineage markers.
A No significant differences in pluripotency marker and signaling molecule expression of SOX1+ /SOX1- sister pairs. n = 28 sister pairs from two biological replicates. ****p < 0.0001 where indicated, else non-significant p > 0.99, 2-way ANOVA corrected for multiple corrections. B Neuroectoderm marker Sox1 does not get upregulated at a specific cell cycle stage. C A significant proportion of cells in neuroectoderm promoting RA media express the FOXA2 endoderm marker. Rare cells co-express SOX1 and FOXA2 (arrows). FOXA2 is not co-expressed with endoderm marker SOX17 or primitive endoderm marker GATA6 (shown dim signals for both are only background). n > 4000 NANOG- cells from 2 biological replicates. Scale bar 50 um. D Observed SOX1+FOXA2+ cells are closely related to single positive or other double positive cells, but never to SOX1-FOXA2- cells, indicating a potential progenitor population of uni-marker expressing cells. Phenotype frequencies of sisters of SOX1+FOXA2+ cells (bottom). n = 24 sister pairs from 2 biological replicates. E The parental line R1WT also differentiates into SOX1+FOXA2+ (arrows), -+ and +- cells. Representative immunostaining images after 48 h in RA, n = 2 biological replicates. Scale bar 50 um. F Cell state classification based on NANOG, FOXA2 AND SOX1 immunostaining quantification after 48 h in different media conditions. NANOG threshold (pink) assigned based on NANOG expression in SerumLIF (top) and FOXA2 (second from top) and SOX1 (second from bottom) threshold based on their expression in N2B27 alone. Same thresholds used for SOX1+FOXA2+ population in RA media (bottom). n > 700 cells per condition from one biological replicate. G SOX1+FOXA2+ cells are generated in different RA concentrations. Proportion of cells in R1WT (top) and NG4 (bottom) ESC lines. Thresholds as shown in F) and G). n > 700 cells per condition per cell line from 1 biological replicate each. A 2nd replicate yielded similar numbers (Supplementary Fig. 4L).
Fig. 4
Fig. 4. Sox1 expressing cells can still differentiate into a FOXA2 positive endodermal marker state.
A Knock-in targeting strategy to obtain a Sox1-EGFP/FOXA2mCherry double reporter line using Crispr-Cas9. B The Sox-EGFP/FoxA2mCherry line accurately reports FOXA2 and SOX1 protein expression. Expression quantified 2 days post RA differentiation. Log transformed data plotted. Linear regression line (pink) and Pearson correlation coefficient (r) as indicated. n > 2500 cells per line from two biological replicates. C Representative images of data quantified in B) showing SOX1 and FOXA2 reporter expression as well as SOX1 and FOXA2 immunostaining data for the same cells. Inset shows images at higher magnification. Scale bars 50 um. Overlay images in Supplementary Fig. 5B. D Quantification of Sox1-EGFP (top) and FOXA2mCherry (bottom) expression dynamics in single cells. Timelapse imaging and cell tracking during RA differentiation. Only partial cell pedigrees shown for clarity. Representative examples show upregulation of FOXA2 alone (left), SOX1 alone (middle) and both SOX1 and FOXA2 (right). E SOX1+ cells upregulate FOXA2 but not vice versa. n = 148 cells from two biological replicates.
Fig. 5
Fig. 5. Sox1+FOXA2+ cells express both neuroectodermal and endodermal markers at intermediate levels compared to Sox1+FoxA2- and Sox1-FOXA2+ cells.
A Experimental workflow. Cells were either differentiated for 2/4/6 days in RA medium prior to sorting and bulk RNASeq. Or differentiated for 2 days, sorted and cultured in RA medium for another 2/4 days before RNASeq. B Populations sorted by marker expression cluster together in transcriptome PCA analysis, with increasing distance as differentiation time increases. Sox1+FOXA2+ cells and its progeny occupy an intermediate position in PCA space with respect to corresponding Sox1-FOXA2+ and Sox1+FOXA2- cells. n = 3 biological replicates per condition. B–G S: Sox1, F: FoxA2. C, D Sox1-FOXA2+ versus Sox1+FOXA2- cells exhibit a progressively stronger visceral/parietal endoderm versus neuroectoderm gene signature with increased differentiation time. Sox1+FoxA2+ cells exhibit intermediate expression for key markers of both endoderm and neuroectoderm. C Relative gene expression per population as indicated, following z-score transformation of normalized counts by row. D Unscaled gene counts, normalized only to library size. n = 3 biological replicates per condition. Error bars represent means ± SDs. E, F Progeny of Sox1-FOXA2+ versus Sox1+FOXA2- acquire a progressively stronger visceral/parietal endoderm versus neuroectodermal gene signature with increased differentiation time. In contrast, Sox1+FoxA2+ progeny exhibit intermediate expression for key markers of endoderm and neuroectoderm. E Relative gene expression per population as indicated, following z-score transformation of normalized counts by row. F Unscaled RNA counts over time per population. n = 3 biological replicates per condition. Error bars represent means ± SDs. G Sox1+FOXA2+ cells give rise to cells with two distinct morphologies: flat, elongated characteristic of neuronal cells (arrows, D6 S+F- progeny), versus epithelial-like morphology (rectangle, D6 S-F+ progeny) characteristic of endoderm cells. N = 2 biological replicates per condition. Scale bar 50 um.
Fig. 6
Fig. 6. Immunofluorescence staining of whole E7.5 embryos and E8.5 embryo neural tube slices confirms the presence of a SOX1+FOXA2+ population in vivo and suggests SOX1+FOXA2+ cells as precursors to p3 neural progenitors.
A Representative image of E7.5 Embryo stained for SOX1 and FOXA2. SOX1 expression was detected in the neural groove and neurectoderm as expected. Bottom images are optical cross sections of the neural groove when rotating the embryo 90 degrees around the left-right axis. FOXA2 expression was detected as expected in the visceral endoderm and node,, and also in the ventral tip of the neural groove. SOX1+FOXA2+ cells were detected ventrally in the neural groove (marked with arrowheads). Representative images from 5 embryos shown. A: anterior, D: distal, P: posterior, V: ventral. hf: head fold, n: node, ng: neural groove, ve: visceral endoderm. B Optical section along the anterior-posterior axis, cutting through the midline of the E7.5 embryo in A) shows that SOX1+FOXA2+ cells could be found along the whole length of the neural groove. C Representative image of neural tube slice from an E8.5 embryo stained for SOX1, FOXA2, and the marker for p3 neural progenitors NKX2.2. SOX1 expression was detected in the neural tube as expected and FOXA2 expression was detected in the floor plate and notochord as expected,. SOX1+FOXA2+ cells were still present at E8.5, located ventrally, and found to co-express NKX2.2, a marker for p3 neural progenitors. N = 3 embryos.

References

    1. Keller, G. Embryonic stem cell differentiation: emergence of a new era in biology and medicine. Genes Dev.19, 1129–1155 (2005). 10.1101/gad.1303605 - DOI - PubMed
    1. Kim, J., Chu, J., Shen, X., Wang, J. & Orkin, S. H. An extended transcriptional network for pluripotency of embryonic stem cells. Cell132, 1049–1061 (2008). 10.1016/j.cell.2008.02.039 - DOI - PMC - PubMed
    1. Zhou, Q., Chipperfield, H., Melton, D. A. & Wing, H. W. A gene regulatory network in mouse embryonic stem cells. Proc. Natl Acad. Sci.104, 16438–16443 (2007). 10.1073/pnas.0701014104 - DOI - PMC - PubMed
    1. Ying, Q. L., Stavridis, M., Griffiths, D., Li, M. & Smith, A. Conversion of embryonic stem cells into neuroectodermal precursors in adherent monoculture. Nat. Biotechnol.21, 183–186 (2003). 2003 21:2. 10.1038/nbt780 - DOI - PubMed
    1. Thomson, M. et al. Pluripotency factors in embryonic stem cells regulate differentiation into germ layers. Cell145, 875–889 (2011). 10.1016/j.cell.2011.05.017 - DOI - PMC - PubMed

MeSH terms

Associated data