. 2024 Sep 9;15(1):7863.
doi: 10.1038/s41467-024-51353-2.

Local administration of regulatory T cells promotes tissue healing

Affiliations

Local administration of regulatory T cells promotes tissue healing

Bhavana Nayer et al. Nat Commun. .

Abstract

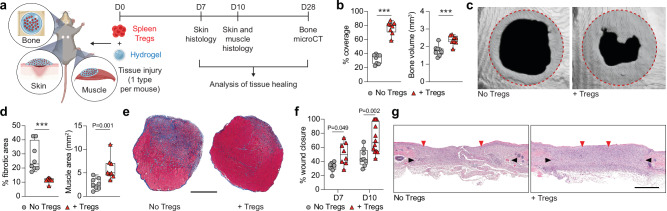
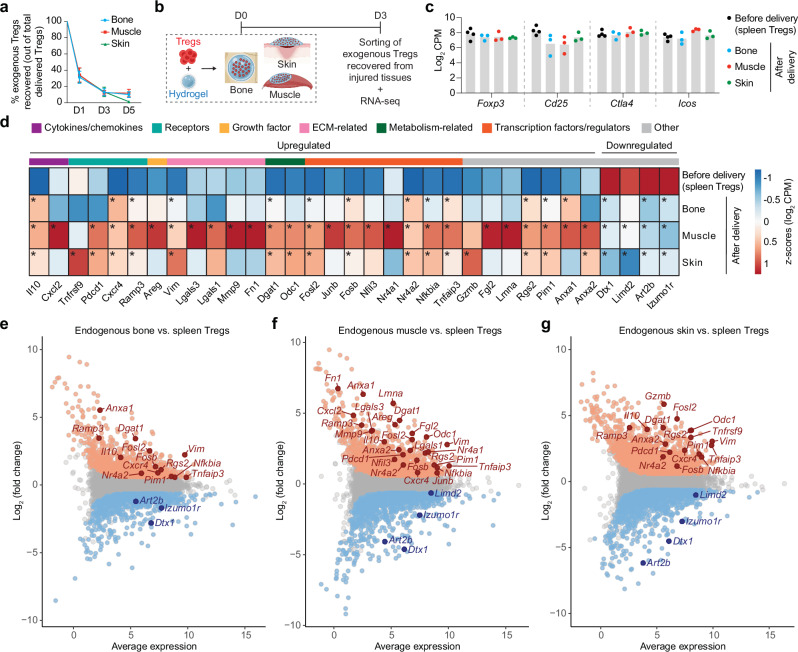
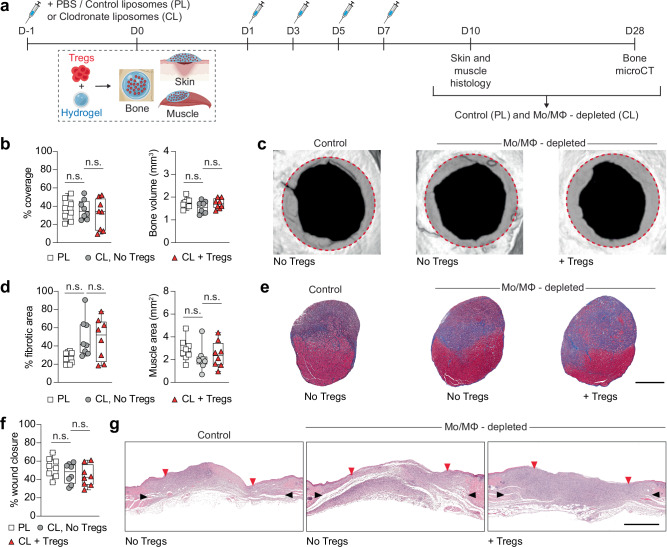
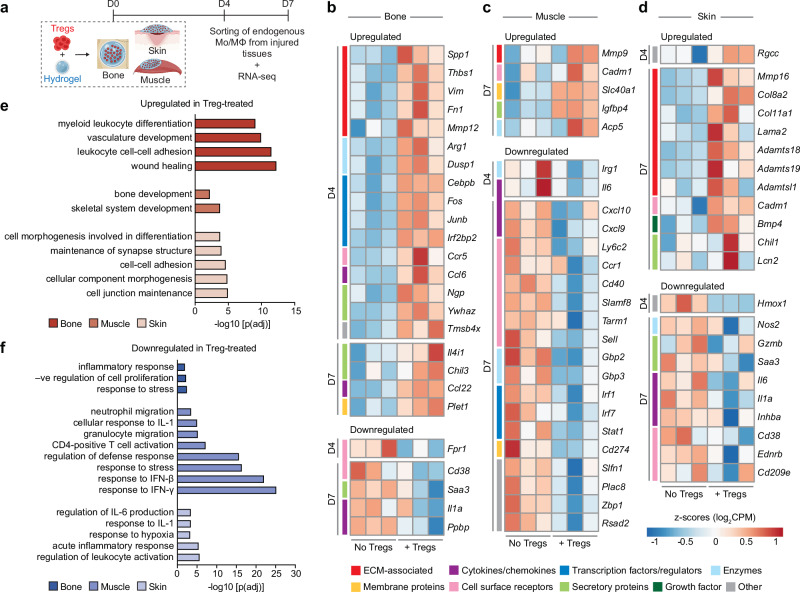
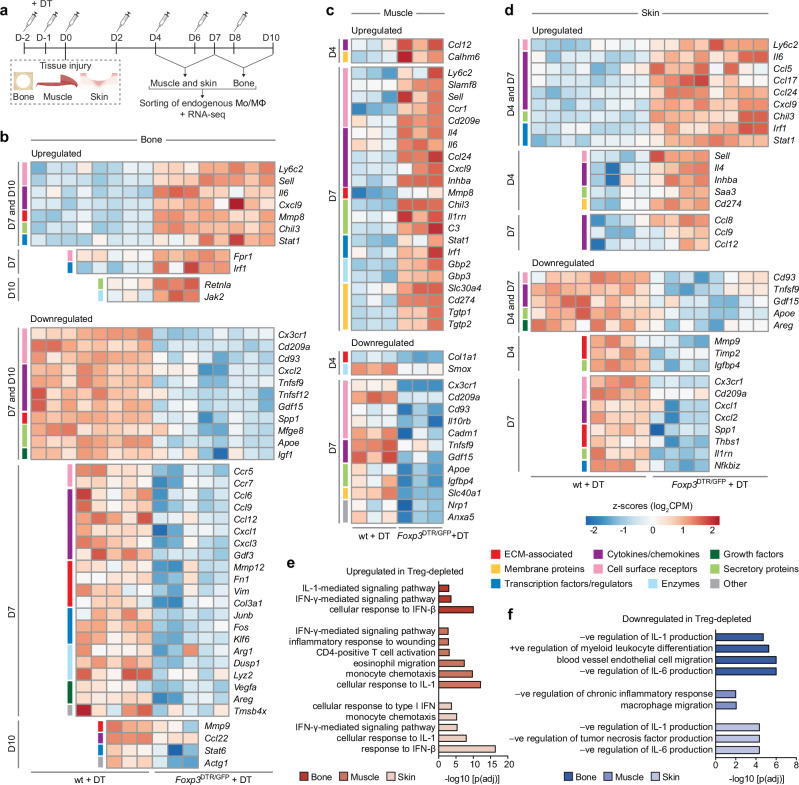
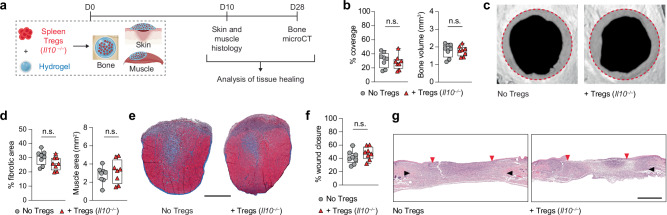
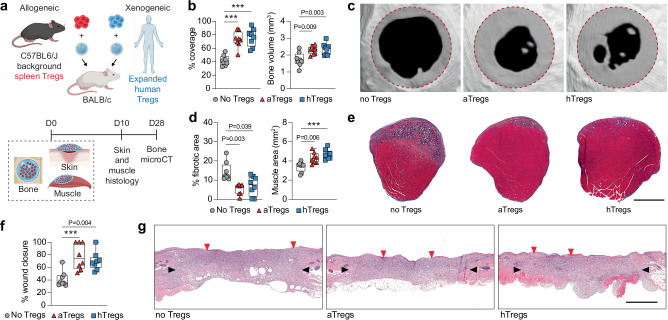
Regulatory T cells (Tregs) are crucial immune cells for tissue repair and regeneration. However, their potential as a cell-based regenerative therapy is not yet fully understood. Here, we show that local delivery of exogenous Tregs into injured mouse bone, muscle, and skin greatly enhances tissue healing. Mechanistically, exogenous Tregs rapidly adopt an injury-specific phenotype in response to the damaged tissue microenvironment, upregulating genes involved in immunomodulation and tissue healing. We demonstrate that exogenous Tregs exert their regenerative effect by directly and indirectly modulating monocytes/macrophages (Mo/MΦ) in injured tissues, promoting their switch to an anti-inflammatory and pro-healing state via factors such as interleukin (IL)-10. Validating the key role of IL-10 in exogenous Treg-mediated repair and regeneration, the pro-healing capacity of these cells is lost when Il10 is knocked out. Additionally, exogenous Tregs reduce neutrophil and cytotoxic T cell accumulation and IFN-γ production in damaged tissues, further dampening the pro-inflammatory Mo/MΦ phenotype. Highlighting the potential of this approach, we demonstrate that allogeneic and human Tregs also promote tissue healing. Together, this study establishes exogenous Tregs as a possible universal cell-based therapy for regenerative medicine and provides key mechanistic insights that could be harnessed to develop immune cell-based therapies to enhance tissue healing.


Conflict of interest statement

The authors declare no competing interests.

Figures

Fig. 1
Fig. 1. Local delivery of exogenous Tregs promotes healing of injured mouse tissues.
a Critical-size cranial defects, quadriceps volumetric muscle loss defect or full-thickness dorsal skin wounds were performed in wildtype C57BL6/J mice and treated with a fibrin hydrogel only, or hydrogel containing exogenous spleen Tregs. Tissue healing was assessed at different time points for each tissue. b Bone regeneration evaluated by microCT analysis of cranial defects expressed as defect coverage and new bone volume at D28 post-injury (n = 8 defects). c Representative cranial reconstructions. The original defect area is shaded with a dashed red outline. d Muscle regeneration represented by the percentage of fibrotic area and muscle area measured by histomorphometric analysis of tissue sections at D10 post-injury (n = 8 defects). e Representative muscle histology of a transverse section of the rectus femoris stained with Masson’s trichrome at D10 post-injury. Muscle tissue is stained in red, and the fibrotic area is in blue. Scale bar = 1 mm. f Percentage wound closure at D7 and D10 post-injury evaluated by histomorphometric analysis of tissue sections (n = 8 wounds for D7, n = 8 wounds for D10 ‘No Tregs’ and n = 12 wounds for D10 ‘+ Tregs’). g Representative histology of skin tissue stained with haematoxylin and eosin at D10 post-injury. Black arrows indicate wound edges and red arrows indicate tips of epithelium tongue. The epithelium (if any) is stained in purple, underneath which the granulation tissue is stained in pink–violet, with dark purple granulocyte nuclei. Scale bar = 1 mm. Data are plotted in box plots showing the median (central line) and IQR (bounds) with whiskers extending to the minimum and maximum values. Two-tailed unpaired Student’s t-test was used in (b), two-tailed Mann–Whitney U test for non-parametric data was used in (d). Two-way ANOVA with Bonferroni post hoc test was used in (f) for multiple comparisons. P values are indicated; ***P ≤ 0.001. a Created with BioRender.com released under a Creative Commons Attribution-NonCommercial-NoDerivs 4.0 International license (https://creativecommons.org/licenses/by-nc-nd/4.0/deed.en).
Fig. 2
Fig. 2. Exogenous Tregs delivered locally in injured tissues adopt an expression profile similar to endogenous Tregs.
Critical-size cranial defects, quadriceps volumetric muscle loss defect or full-thickness dorsal skin wounds were performed in wildtype C57BL6/J mice, and treated with a fibrin hydrogel only, or hydrogel containing exogenous spleen Tregs. a Percentage of delivered (exogenous) Tregs remaining in injured bone, muscle, and skin, on D1, D3, and D5 post-delivery (data are mean ± SD, n = 3 mice/time point for bone, n = 5 mice/time point for muscle and skin). b On D3 post-delivery, exogenous Tregs were sorted from injured tissues for RNA sequencing. c Log2 CPM values of genes classically expressed by Tregs in exogenous spleen Tregs before delivery (n = 4 mice) and exogenous Tregs recovered from injured tissues at D3 post-delivery (n = 3 mice/tissue). d Heat map depicting standardised expression values of selected differentially expressed genes (DEGs) in exogenous Tregs before delivery (n = 4 mice) and exogenous Tregs recovered from injured tissues at D3 post-delivery (n = 3 mice/tissue; average of replicates is shown). Genes marked with * are significantly up- or downregulated. Colour key above the heat map denotes the functional category of the genes. Endogenous Tregs were sorted from injured bone, muscle, and skin, on D7 post-injury for RNA sequencing. MA plots depict selected DEGs (FDR adjusted p value < 0.05) in endogenous tissue Tregs sorted from injured bone (e), muscle (f), and skin (g), compared to spleen Tregs sorted from uninjured (healthy) mice (n = 3 replicates/tissue, each comes from a pool of >2 mice). Genes marked in orange and blue represent significantly up- and downregulated genes respectively (FDR adjusted p value < 0.05). DEGs common between D7 endogenous Tregs and D3 exogenous Tregs from (d) are labelled on the MA plot for each tissue. b Created with BioRender.com released under a Creative Commons Attribution-NonCommercial-NoDerivs 4.0 International license (https://creativecommons.org/licenses/by-nc-nd/4.0/deed.en).
Fig. 3
Fig. 3. Treg-mediated tissue healing depends on Mo/MΦ.
Wildtype C57BL6/J mice were depleted of Mo/MΦ using clodronate liposomes (CL), compared to control liposomes (PBS liposomes, PL), and tissue healing was assessed for critical-size cranial defects, quadriceps volumetric muscle loss defect or full-thickness dorsal skin wounds in response to Treg delivery. a Schematic of the macrophage depletion experiment. bc Cranial regeneration assessed by microCT. Defect coverage and new bone volume at D28 post-injury in (b) (n = 8 defects). Representative cranial reconstructions in (c). The original defect area is shaded with a dashed red outline. de Muscle regeneration evaluated by histomorphometric analysis of tissue sections. Fibrotic area and muscle area at D10 post-injury in (d) (n = 8 defects). Representative histology of a transverse section of the rectus femoris stained with Masson’s trichrome at D10 post-injury in (e). Muscle tissue is stained in red, and the fibrotic area is in blue. Scale bar = 1 mm. fg Skin wound closure measured by histomorphometric analysis of tissue sections. Wound closure at D10 post-injury in (f) (n = 8 wounds). Representative histology of haematoxylin and eosin staining at D10 post-injury in (g). Black arrows indicate wound edges and red arrows indicate tips of epithelium tongue. Scale bar = 1 mm. Data are plotted in box plots showing the median (central line) and IQR (bounds) with whiskers extending to the minimum and maximum values. One-way ANOVA with Bonferroni post hoc test was used in (b, d, f) for multiple comparisons; n.s.: non-significant. (PL: PBS/control liposomes, CL: clodronate liposomes, Mo/MΦ: monocytes/macrophages). a Created with BioRender.com released under a Creative Commons Attribution-NonCommercial-NoDerivs 4.0 International license (https://creativecommons.org/licenses/by-nc-nd/4.0/deed.en).
Fig. 4
Fig. 4. Mo/MΦ display a pro-healing transcriptomic profile upon Treg delivery.
a Wildtype C57BL6/J mice with bone, muscle or skin injuries were treated with fibrin hydrogel only or hydrogel containing exogenous Tregs. bf Endogenous Mo/MΦ from injured tissues were sorted for RNA sequencing on D4 and D7 post-injury. Heat maps depicting standardised gene expression values of selected significantly upregulated and downregulated genes (FDR adjusted p value < 0.05) in Mo/MΦ from Treg-treated bone (b), muscle (c), and skin (d) injuries, compared to untreated controls (n = 3 mice/tissue per time point; individual replicates are shown). Colour key denotes the functional category of the genes. Gene ontology terms depicting enriched biological processes in significantly upregulated (e) and downregulated (f) genes in Treg-treated tissues, from both D4 and D7 macrophages combined (FDR < 0.01, adjusted by Benjamini–Hochberg correction). (Mo/MΦ: monocytes/ macrophages). a Created with BioRender.com released under a Creative Commons Attribution-NonCommercial-NoDerivs 4.0 International license (https://creativecommons.org/licenses/by-nc-nd/4.0/deed.en).
Fig. 5
Fig. 5. Mo/MΦ from Treg-depleted mice show an increased pro-inflammatory transcriptional signature.
a Wildtype (wt) C57BL6/J and Foxp3DTR/GFP mice were treated with diphtheria toxin (DT) to deplete Tregs in Foxp3DTR/GFP mice, and injuries were performed in bone (critical-size cranial defects), muscle (quadriceps volumetric muscle loss defect) or skin (full-thickness dorsal skin wounds). bf Mo/MΦ were sorted from the injured tissues at two different time points per tissue for RNA sequencing. Heat maps depicting standardised gene expression values of selected significantly upregulated and downregulated DEGs (FDR adjusted p value < 0.05) in Mo/MΦ from Treg-depleted bone (b), muscle (c) and skin (d) injuries, compared to the wildtype controls, including DEGs that were both shared and unique, across both time points per tissue (n = 3–5 mice/tissue per time point; individual replicates are shown). Colour key on the left of the heat map denotes the functional category of the genes. Gene ontology terms depicting enriched biological processes in the significantly upregulated (e) and downregulated (f) genes in the Treg-depleted tissues, from both time points combined (FDR < 0.01, adjusted by Benjamini–Hochberg correction). (Mo/MΦ: monocytes/macrophages). a Created with BioRender.com released under a Creative Commons Attribution-NonCommercial-NoDerivs 4.0 International license (https://creativecommons.org/licenses/by-nc-nd/4.0/deed.en).
Fig. 6
Fig. 6. Treg-mediated acceleration of tissue healing depends on their production of IL-10.
a Critical-size cranial defects, quadriceps volumetric muscle loss defect or full-thickness dorsal skin wounds were performed in wildtype C57BL6/J mice and treated with a fibrin hydrogel only, or hydrogel containing exogenous IL10-deficient (Il10−/−) spleen Tregs. Tissue healing was assessed at different time points for each tissue. b Bone regeneration evaluated by microCT analysis of cranial defects expressed as defect coverage and new bone volume at D28 post-injury (n = 8 defects). c Representative cranial reconstructions. The original defect area is shaded with a dashed red outline. d Muscle regeneration represented by the percentage of fibrotic area and muscle area measured by histomorphometric analysis of tissue sections at D10 post-injury (n = 8 defects). e Representative muscle histology of a transverse section of the rectus femoris stained with Masson’s trichrome at D10 post-injury. Muscle tissue is stained in red, and the fibrotic area is in blue. Scale bar = 1 mm. f Percentage wound closure at D10 post-injury evaluated by histomorphometric analysis of tissue sections (n = 8 wounds). g Representative histology of skin tissue stained with haematoxylin and eosin at D10 post-injury. Black arrows indicate wound edges and red arrows indicate tips of epithelium tongue. The epithelium (if any) is stained in purple, underneath which the granulation tissue is stained in pink–violet, with dark purple granulocyte nuclei. Scale bar = 1 mm. Data are plotted in box plots showing the median (central line) and IQR (bounds) with whiskers extending to the minimum and maximum values. Two-tailed unpaired Student’s t-test was used in (b, d, f). n.s.: non-significant. a Created with BioRender.com released under a Creative Commons Attribution-NonCommercial-NoDerivs 4.0 International license (https://creativecommons.org/licenses/by-nc-nd/4.0/deed.en).
Fig. 7
Fig. 7. Local delivery of allogeneic and xenogeneic Tregs promotes tissue healing.
a Skin, bone or muscle injuries were performed in BALB/c mice and treated with a fibrin hydrogel only, or hydrogel containing sorted spleen Tregs from C57BL6/J mice (allogeneic delivery), or hydrogel containing human Tregs isolated from peripheral blood and expanded in vitro (xenogeneic delivery). Tissue healing was assessed at different time points for each tissue. b Cranial regeneration at D28 post-injury evaluated by microCT and expressed as defect coverage and new bone volume (n = 8 defects). c Representative cranial reconstructions. The original defect area is shaded with a dashed red outline. d Muscle regeneration represented by the percentage of fibrotic area and muscle area measured by histomorphometric analysis at D10 post-injury (n = 8 defects). e Representative muscle histology of a transverse section of the rectus femoris stained with Masson’s trichrome at D10 post-injury. Muscle tissue is stained in red, and the fibrotic area is in blue. Scale bar = 1 mm. f Wound closure at D10 post-injury evaluated by histomorphometric analysis (n = 8 wounds). g Representative histology of skin tissue stained with haematoxylin and eosin at D10 post-injury. Black arrows indicate wound edges and red arrows indicate tips of epithelium tongue. The epithelium (if any) is stained in purple as a homogeneous keratinocyte layer on top of the wounds, underneath which the granulation tissue is stained in pink–violet, with dark purple granulocyte nuclei. Scale bar = 1 mm. Data are plotted in box plots showing the median (central line) and IQR (bounds) with whiskers extending to the minimum and maximum values. One-way ANOVA with Bonferroni post hoc test was used in (b, d: right) and a two-sided Kruskal–Wallis with Dunn’s post hoc test was used for non-parametric data in (d: left, f) for multiple comparisons. P values are indicated; ***P ≤ 0.001. (aTregs: allogeneic Tregs; hTregs: human Tregs). a Created with BioRender.com released under a Creative Commons Attribution-NonCommercial-NoDerivs 4.0 International license (https://creativecommons.org/licenses/by-nc-nd/4.0/deed.en).

References

    1. Julier, Z., Park, A. J., Briquez, P. S. & Martino, M. M. Promoting tissue regeneration by modulating the immune system. Acta Biomater.53, 13–28 (2017). 10.1016/j.actbio.2017.01.056 - DOI - PubMed
    1. Forbes, S. J. & Rosenthal, N. Preparing the ground for tissue regeneration: from mechanism to therapy. Nat. Med.20, 857–869 (2014). 10.1038/nm.3653 - DOI - PubMed
    1. Weber, E. W., Maus, M. V. & Mackall, C. L. The emerging landscape of immune cell therapies. Cell181, 46–62 (2020). 10.1016/j.cell.2020.03.001 - DOI - PMC - PubMed
    1. Legrand, J. M. D. & Martino, M. M. Growth factor and cytokine delivery systems for wound healing. Cold Spring Harb. Perspect. Biol.14, a041234 (2022). 10.1101/cshperspect.a041234 - DOI - PMC - PubMed
    1. Li, J., Tan, J., Martino, M. M. & Lui, K. O. Regulatory T-cells: potential regulator of tissue repair and regeneration. Front. Immunol.9, 585 (2018). 10.3389/fimmu.2018.00585 - DOI - PMC - PubMed

Publication types

Associated data