. 2024 Sep 9;10(1):39.
doi: 10.1038/s41514-024-00164-2.

Glucose metabolism and smaller hippocampal volume in elderly people with normal cognitive function

Collaborators, Affiliations

Glucose metabolism and smaller hippocampal volume in elderly people with normal cognitive function

Ayano Shima et al. NPJ Aging. .

Abstract

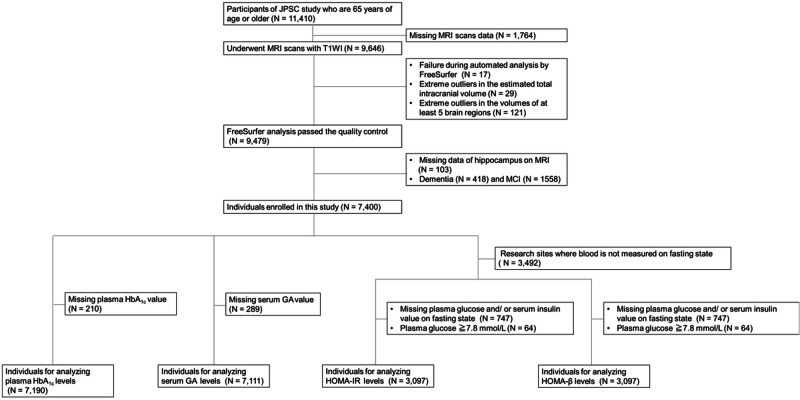
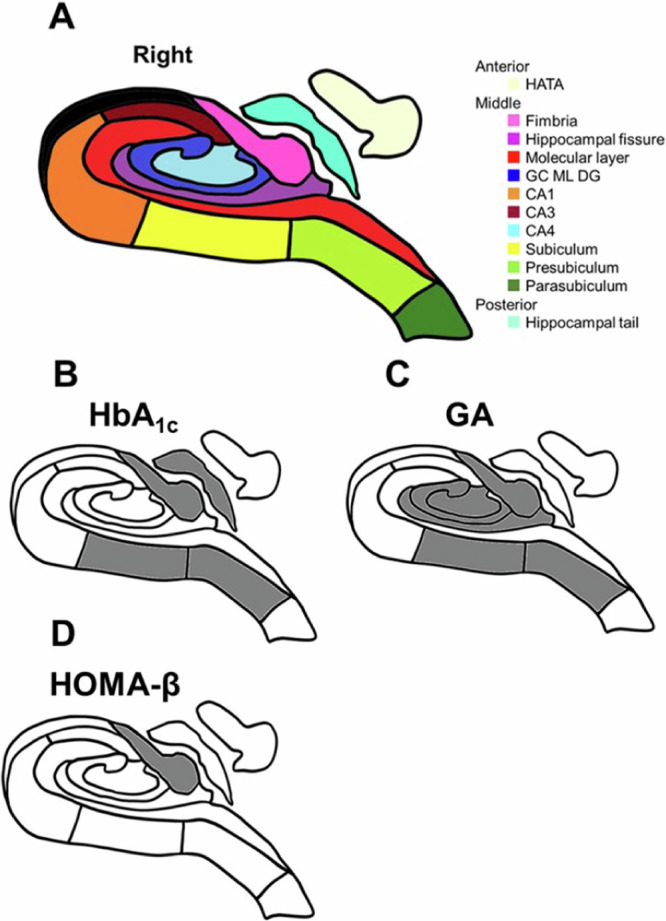
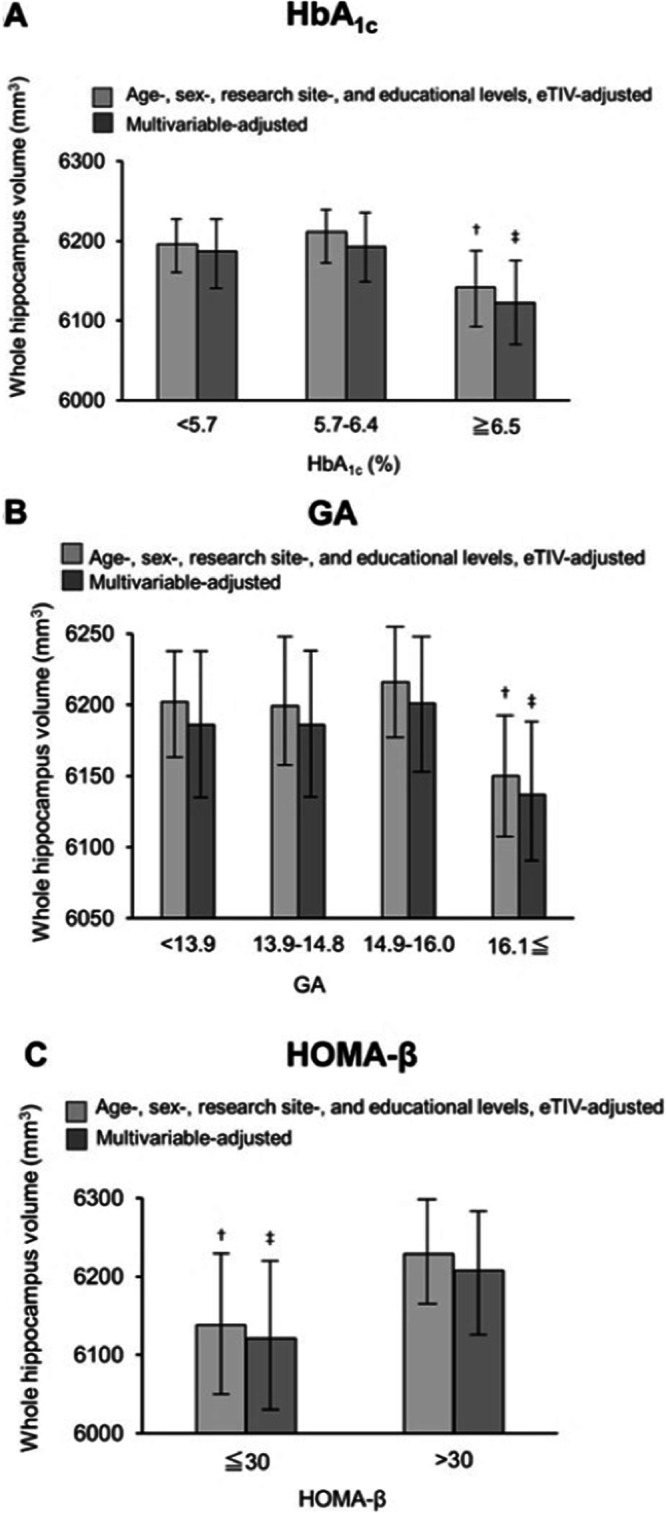
We investigated associations of glycemic measures, and insulin resistance and secretion measures with hippocampal and subfield volumes. In this cross-sectional study, 7400 community-dwelling participants underwent brain MRI and health checkups between 2016 and 2018. Hemoglobin A1c (HbA1c), glycated albumin (GA), homeostasis model assessment for insulin resistance (HOMA-IR), and HOMA of percent β-cell function (HOMA-β) were evaluated. The associations of each measure with a smaller volume of the hippocampus and twelve hippocampal subfields were investigated. As a result, higher HbA1c or GA and lower HOMA-β levels were significantly associated with smaller volumes in multiple hippocampal subfields. Furthermore, even when we analyzed non-diabetic individuals, substantial associations remained between higher GA or lower HOMA-β levels and smaller volumes of the whole hippocampus or the fimbria. Our findings indicate that postprandial glucose fluctuations, postprandial hyperglycemia, and low insulin secretion have a specific effect on the development of smaller hippocampal volume, suggesting that primary prevention of diabetes and/or sufficient glucose control are important for the prevention of dementia.


Conflict of interest statement

A.S., M.N.-S., S.S., Y.U., Y.T., B.T., J.H., T.O., T.H., Y.T., S.N., T.M., M.M., K.N., J.-i.I., M.T., H.N., and K.O. declares no competing financial or non-financial interests. T.N. declares no competing non-financial interests but the following competing financial interests: Grants from Suntory Holdings Limited.

Figures

Fig. 1
Fig. 1. A flow chart of enrolled individuals for each analysis of the associations between the hippocampus volumes and each diabetes status, HbA1c levels, GA levels, HOMA-IR, and HOMA-β.
GA glycated albumin, HbA1c hemoglobin A1c, HOMA-β homeostasis model assessment of percent β-cell function, HOMA-IR homeostasis model assessment for insulin resistance, JPSC-AD the Japan Prospective Studies Collaboration for Aging and Dementia, MRI magnetic resonance imaging, T1WI T1-weighted imaging.
Fig. 2
Fig. 2. Hippocampal subfields and the relationships between hippocampal subfields and glycemic measures or insulin secretion.
A A schematic representation of the right hippocampus in a coronal section. Hippocampal subfields are represented in different colors. HATA Hippocampus-amygdala-transition-area, GC, DG, ML, Granule cell and molecular cell layer of the dentate gyrus, CA Cornu Ammonis. Notice that the subfield HATA is transposed from an anterior coronal section, while the tail is transposed from a posterior coronal section. BD A schematic representation displaying the substantial associations between hippocampal subregions and glycemic measures or insulin secretion measures in the analysis of the multivariable-adjusted values (Model 2): HbA1c (B), GA (C), and HOMA-β value (D). Gray color represents a substantially smaller volume in the subfields.
Fig. 3
Fig. 3. The mean values of the volumes of the whole hippocampus according to HbA1c, GA, and HOMA-β value.
AC The mean values of the volumes of the whole hippocampus according to HbA1c (A), GA (B), and HOMA-β value (C), with analysis of the age-, sex-, research site-, and educational levels-, estimated intracranial volume (eTIV)- adjusted values (Model 1) and multivariable-adjusted values (Model 2). <0.05. <0.001.

References

    1. Zhang, W. et al. Hippocampal subfields atrophy contribute more to cognitive impairment in middle-aged patients with type 2 diabetes rather than microvascular lesions. Acta Diabetol.58, 1023–1033 (2021). 10.1007/s00592-020-01670-x - DOI - PubMed
    1. Li, M. et al. Altered hippocampal subfields volumes is associated with memory function in type 2 diabetes mellitus. Front. Neurol.12, 756500 (2021). 10.3389/fneur.2021.756500 - DOI - PMC - PubMed
    1. Lee, S. et al. Hippocampal subregional alterations and verbal fluency in the early stage of type 2 diabetes mellitus. Eur. J. Neurosci.54, 7550–7559 (2021). 10.1111/ejn.15505 - DOI - PubMed
    1. Li, M. et al. Atrophy patterns of hippocampal subfields in T2DM patients with cognitive impairment. Endocrine68, 536–548 (2020). 10.1007/s12020-020-02249-w - DOI - PMC - PubMed
    1. Sadanand, S. et al. Memory and executive functions in persons with type 2 diabetes: a meta-analysis. Diabetes Metab. Res. Rev.32, 132–142 (2016). 10.1002/dmrr.2664 - DOI - PubMed

LinkOut - more resources