

Detection and quantification of groundnut oil adulteration with machine learning using a comparative approach with NIRS and UV-VIS
- PMID: 39251628
- PMCID: PMC11383961
- DOI: 10.1038/s41598-024-70297-7
Detection and quantification of groundnut oil adulteration with machine learning using a comparative approach with NIRS and UV-VIS
Abstract
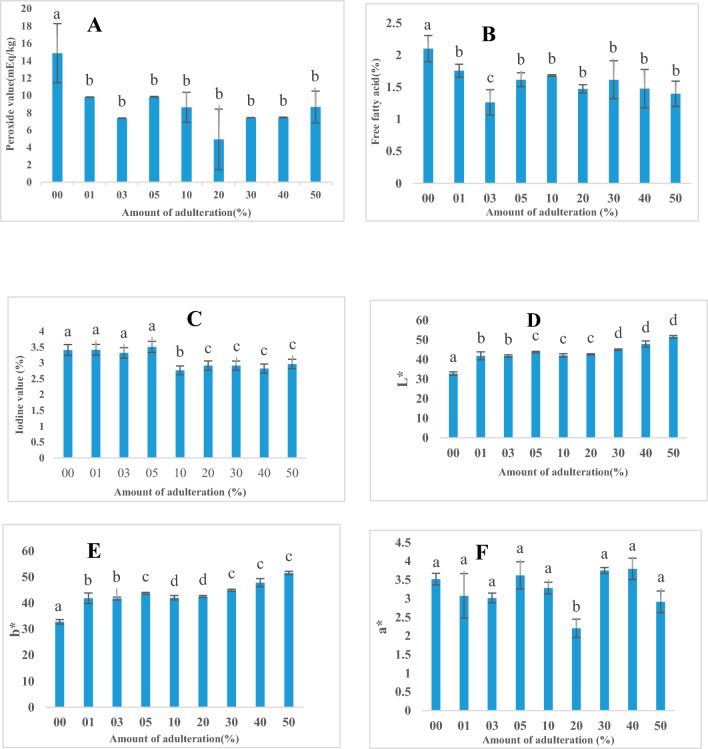
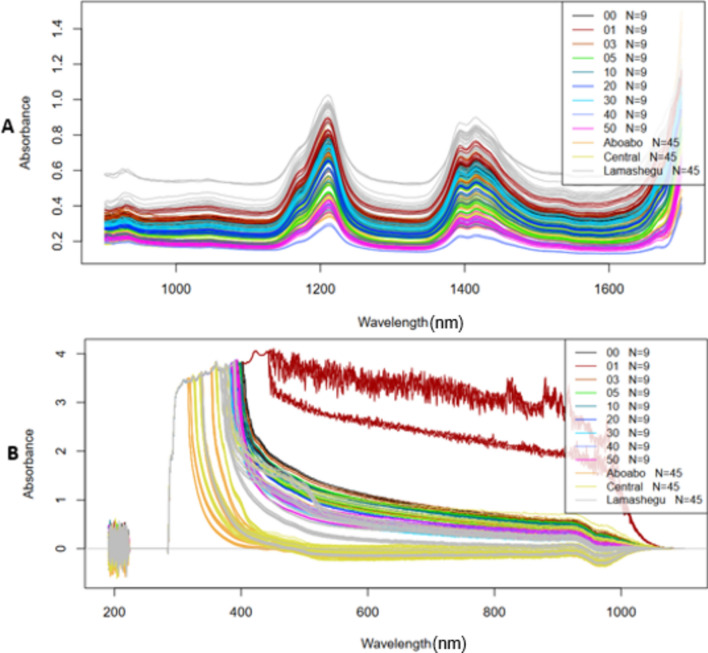
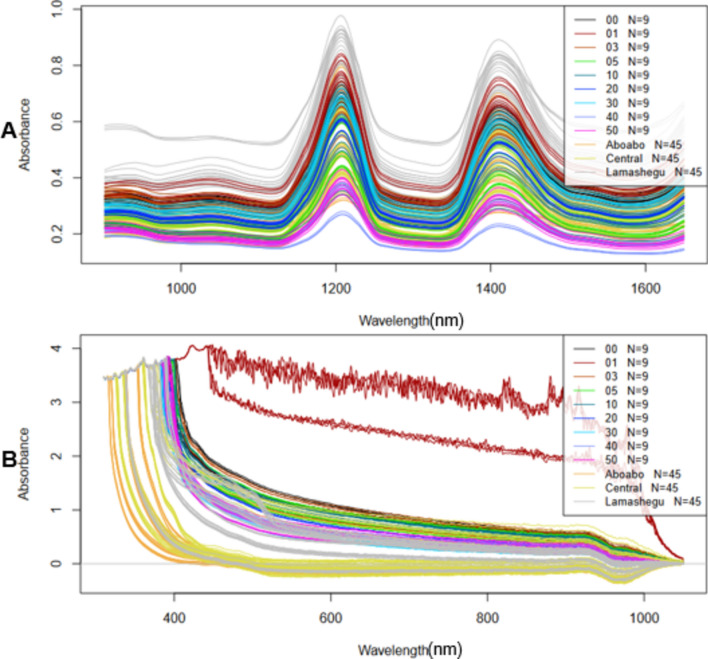
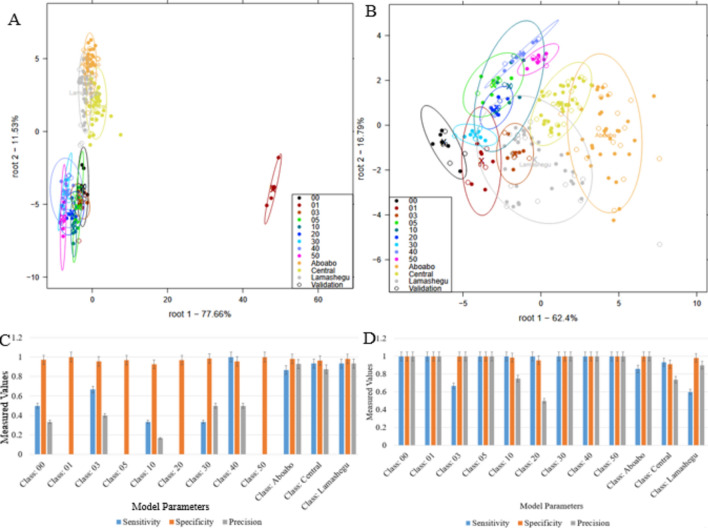
Groundnut oil is known as a good source of essential fatty acids which are significant in the physiological development of the human body. It has a distinctive fragrant making it ideal for cooking which contribute to its demand on the market. However, some groundnut oil producers have been suspected to produce groundnut oil by blending it with cheaper oils especially palm olein at different concentrations or by adding groundnut flavor to palm olein. Over the years, there have been several methods to detect adulteration in oils which are time-consuming and expensive. Near infrared (NIR) and ultraviolet-visible (UV-Vis) spectroscopies are cheap and rapid methods for oil adulteration. This present study aimed to apply NIR and UV-Vis in combination with chemometrics to develop models for prediction and quantification of groundnut oil adulteration. Using principal component analysis (PCA) scores, pure and prepared adulterated samples showed overlapping showing similarities between them. Linear discriminant analysis (LDA) models developed from NIR and UV-Vis gave an average cross-validation accuracy of 92.61% and 62.14% respectively for pure groundnut oil and adulterated samples with palm olein at 0, 1, 3, 5, 10, 20, 30, 40 and 50% v/v. With partial least squares regression free fatty acid, color parameters, peroxide and iodine values could be predicted with R2CV's up to 0.8799 and RMSECV's lower than 3 ml/100 ml for NIR spectra and R2CV's up to 0.81 and RMSECV's lower than 4 ml/100 ml for UV-Vis spectra. NIR spectra produced better models as compared to UV-Vis spectra.
Keywords: Adulteration; Chemometrics; Free fatty acid; Iodine value; Near infrared; Peroxide value; Ultraviolet–visible.
© 2024. The Author(s).
Conflict of interest statement
The authors declare no competing interests.
Figures


References
-
- Jamwal, R. et al. Recent trends in the use of FTIR spectroscopy integrated with chemometrics for the detection of edible oil adulteration. Vib. Spectrosc.113, 103222 (2021).10.1016/j.vibspec.2021.103222 - DOI
-
- Tian, L., Zeng, Y., Zheng, X., Chiu, Y. & Liu, T. Detection of peanut oil adulteration mixed with rapeseed oil using gas chromatography and gas chromatography-ion mobility spectrometry. Food Anal. Methods12, 2282–2292 (2019).10.1007/s12161-019-01571-y - DOI
-
- Wu, Z., Li, H. & Tu, D. Application of Fourier transform infrared (FT-IR) spectroscopy combined with chemometrics for analysis of rapeseed oil adulterated with refining and purificating waste cooking oil. Food Anal. Methods8, 2581–2587 (2015).10.1007/s12161-015-0149-z - DOI
Publication types
MeSH terms
Substances
LinkOut - more resources
Full Text Sources
Medical
Miscellaneous
