. 2024 Sep 9;14(1):20992.
doi: 10.1038/s41598-024-71690-y.

Commonalities and variations in emotion representation across modalities and brain regions

Affiliations

Commonalities and variations in emotion representation across modalities and brain regions

Hiroaki Kiyokawa et al. Sci Rep. .

Abstract

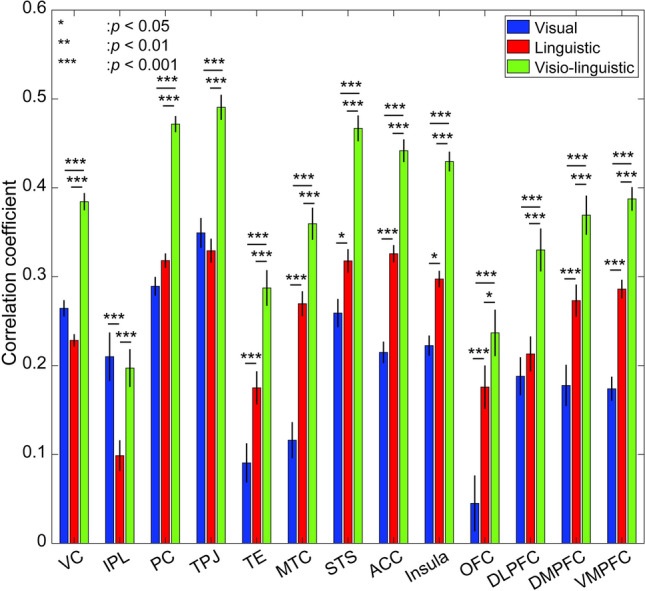
Humans express emotions through various modalities such as facial expressions and natural language. However, the relationships between emotions expressed through different modalities and their correlations with neural activities remain uncertain. Here, we aimed to unveil some of these uncertainties by investigating the similarity of emotion representations across modalities and brain regions. First, we represented various emotion categories as multi-dimensional vectors derived from visual (face), linguistic, and visio-linguistic data, and used representational similarity analysis to compare these modalities. Second, we examined the linear transferability of emotion representation from other modalities to the visual modality. Third, we compared the representational structure derived in the first step with those from brain activities across 360 regions. Our findings revealed that emotion representations share commonalities across modalities with modality-type dependent variations, and they can be linearly mapped from other modalities to the visual modality. Additionally, emotion representations in uni-modalities showed relatively higher similarity with specific brain regions, while multi-modal emotion representation was most similar to representations across the entire brain region. These findings suggest that emotional experiences are represented differently across various brain regions with varying degrees of similarity to different modality types, and that they may be multi-modally conveyable in visual and linguistic domains.

Keywords: Deep learning; Emotion; Facial expression; Multi-modal; Representational similarity analysis; fMRI.


Conflict of interest statement

The authors declare no competing interests.

Figures

Fig. 1
Fig. 1
Overview of the analysis process and the architecture of the ANN used in Experiment 2. The ANN estimates 27 emotion scores from facial image features. The frame colors represent modalities: blue corresponds to visual, red to linguistic, and green to visio-linguistic. Emotion vectors of different modalities were aligned according to the number of their dimensions and were normalized with L2-norm through spherical multi-dimensional scaling (MDS) reduction. We compared the prediction accuracy for emotion scores before and after replacing the weights of the final layer of the trained ANN with the weight vectors derived from emotion vectors from other modalities.
Fig. 2
Fig. 2
Representational similarity matrices (RSM) for 27 emotions. The color of each cell of the matrices represents the z-scored correlation coefficient between each emotion pair. The diagonal elements are colored in white. (a) Visual (face) emotion RSM, (b) Linguistic (ConceptNet) emotion RSM, (c) Linguistic (Word2Vec) emotion RSM, (d) Visio-linguistic (concept) emotion RSM, (e) Visio-linguistic (face) emotion RSM.
Fig. 3
Fig. 3
Correlation coefficients between emotion RSMs for different conditions of three modalities. The numbers and colors in each block represent the correlation coefficients between corresponding conditions.
Fig. 4
Fig. 4
(a) The accuracy of visual (face) emotion vectors predicted from emotion vectors of other modalities using orthogonal transformation. The colors of the bars indicate the different modalities (red: linguistic, green: visio-linguistic, and gray: random). The lengths of the bars represent the mean prediction accuracy, assessed by the correlation coefficient between the predicted and left-out emotion vectors. Error bars represent ± 1 SEM for the leave-one-emotion-out cross-validation. (b) Classification accuracy results for the artificial neural network (ANN) predicting emotion scores from facial image features. Accuracy was assessed as the correlation coefficient between the predicted and ground-truth scores for the test data. The colors and labels of the bars indicate results before (denoted as visual (ANN)) and after replacement of the final layer weights with emotion vectors obtained from data from various modalities (blue: visual, red: linguistic, green: visio-linguistic, gray: random). Bar length represents the mean classification accuracy for each condition. The “From random vectors” condition corresponds to chance level. Error bars are ± 1 SEM for tenfold cross-validation results.
Fig. 5
Fig. 5
Correlations between brain emotion RSMs in 360 cortical regions and emotion RSMs obtained from each modality. (a, c, and e) depict the correlation maps (i.e., flattened cortical maps where the color of individual brain regions indicates the correlation coefficients) for visual (face), linguistic (Word2Vec), and visio-linguistic (concept) conditions, respectively. (b, d, and f) represent histograms of correlation coefficients corresponding to (a), (c), and (e), respectively. The regions enclosed by blue lines represent the coarser-scale 13 regions of interest (ROIs) parcellated by Horikawa et al.. Abbreviations: VC (visual cortex), IPL (inferior parietal lobule), PC (precuneus), TPJ (temporo-parietal junction), TE (temporal area), MTC (medial temporal cortex), STS (superior temporal sulcus), ACC (anterior cingulate cortex), OFC (orbitofrontal cortex), and DLPFC/DMPFC/VMPFC (dorsolateral/dorsomedial/ventromedial prefrontal cortex).
Fig. 6
Fig. 6
Correlation coefficients between emotion RSMs for three modalities and brain emotion RSMs for 13 ROIs. The mean correlation coefficients for each modality in each ROI are plotted as differently colored bars: blue corresponds to visual modalities, red to linguistic, and green to visio-linguistic. Error bars indicate ± 1 SEM. * indicates conditions with p < 0.05 after permutation test.

References

    1. Ekman, P., Sorenson, E. R. & Friesen, W. V. Pan-cultural elements in facial displays of emotion. Science164, 86–88 (1969). 10.1126/science.164.3875.86 - DOI - PubMed
    1. Russell, J. A. Affective space is bipolar. J. Personal. Soc. Psychol.37(3), 345–356 (1979).10.1037/0022-3514.37.3.345 - DOI
    1. Cowen, A. S. et al. Sixteen facial expressions occur in similar contexts worldwide. Nature589, 251–257 (2021). 10.1038/s41586-020-3037-7 - DOI - PubMed
    1. Lindquist, K. A. et al. Language and the perception of emotion. Emotion6(1), 125–138 (2006). 10.1037/1528-3542.6.1.125 - DOI - PubMed
    1. Lindquist, K. A., MacCormack, J. K. & Shablack, H. The role of language in emotion: Predictions from psychological constructionism. Front. Psychol.6, 444 (2015). 10.3389/fpsyg.2015.00444 - DOI - PMC - PubMed

LinkOut - more resources