. 2024 Sep;8(9):1092-1108.
doi: 10.1038/s41551-024-01248-w. Epub 2024 Sep 9.

A pan-cancer dye for solid-tumour screening, resection and wound monitoring via short-wave and near-infrared fluorescence imaging

Affiliations

A pan-cancer dye for solid-tumour screening, resection and wound monitoring via short-wave and near-infrared fluorescence imaging

Benedict Edward Mc Larney et al. Nat Biomed Eng. 2024 Sep.

Abstract

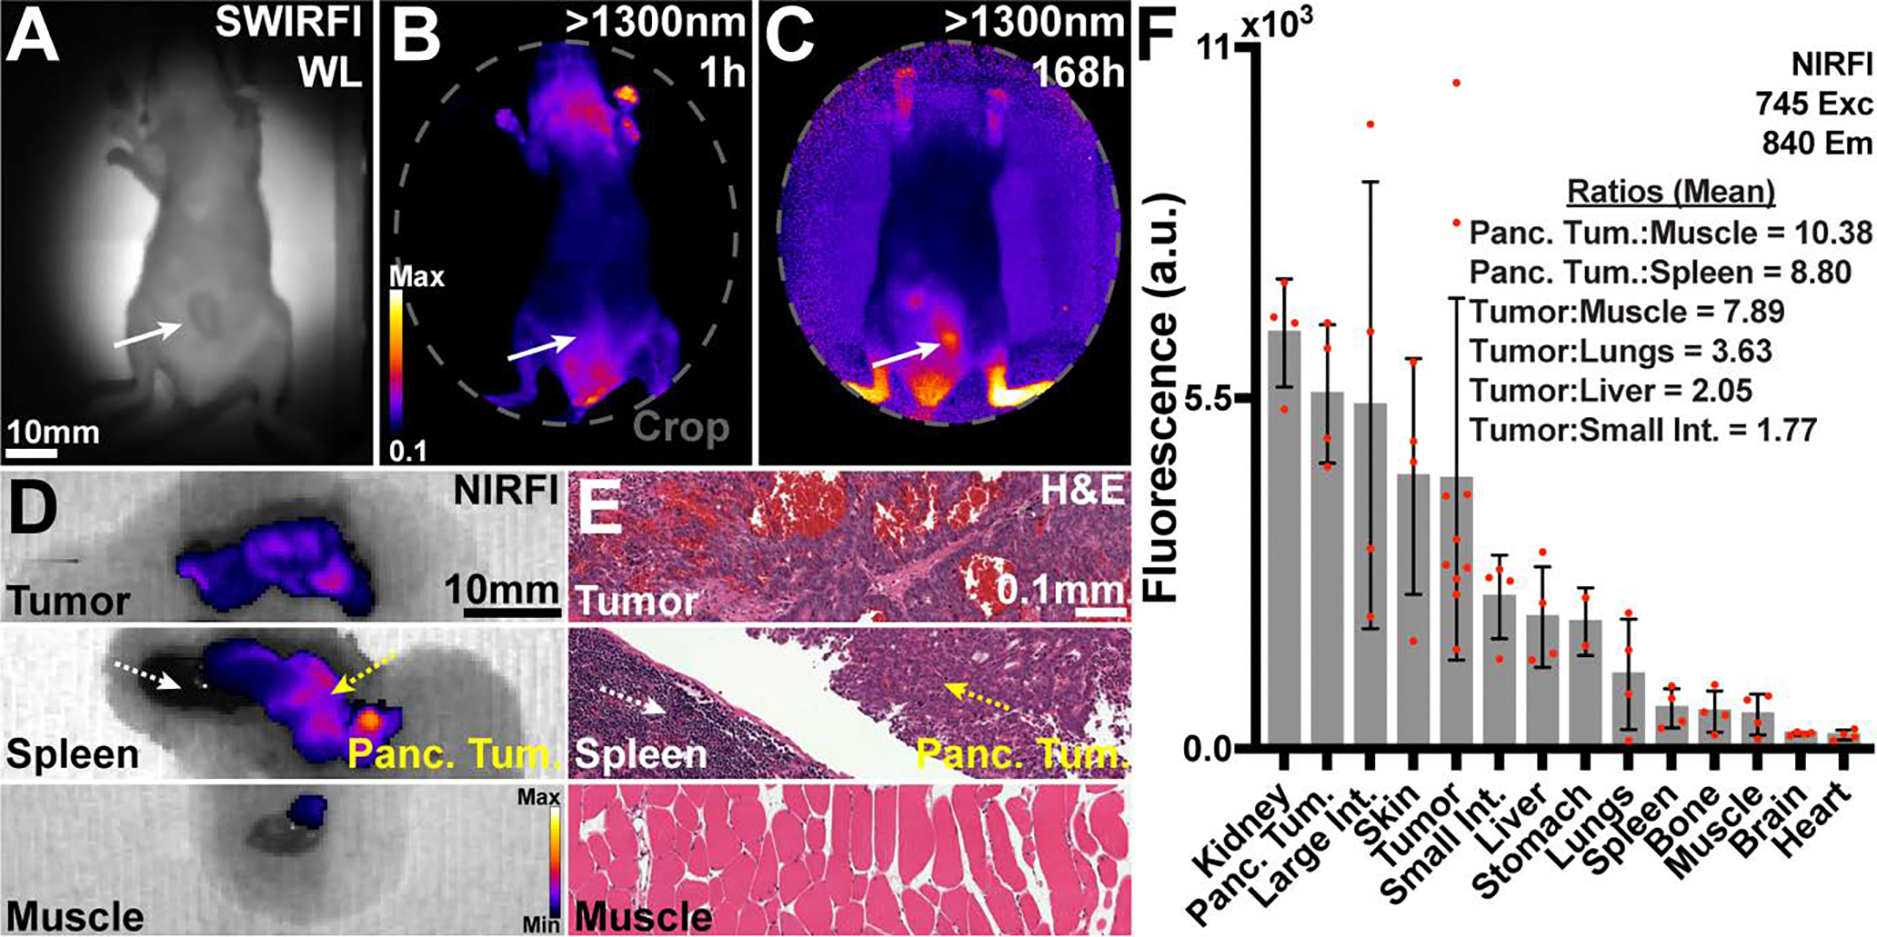
The efficacy of fluorescence-guided surgery in facilitating the real-time delineation of tumours depends on the optical contrast of tumour tissue over healthy tissue. Here we show that CJ215-a commercially available, renally cleared carbocyanine dye sensitive to apoptosis, and with an absorption and emission spectra suitable for near-infrared fluorescence imaging (wavelengths of 650-900 nm) and shortwave infrared (SWIR) fluorescence imaging (900-1,700 nm)-can facilitate fluorescence-guided tumour screening, tumour resection and the assessment of wound healing. In tumour models of either murine or human-derived breast, prostate and colon cancers and of fibrosarcoma, and in a model of intraperitoneal carcinomatosis, imaging of CJ215 with ambient light allowed for the delineation of nearly all tumours within 24 h after intravenous injection of the dye, which was minimally taken up by healthy organs. At later timepoints, CJ215 provided tumour-to-muscle contrast ratios up to 100 and tumour-to-liver contrast ratios up to 18. SWIR fluorescence imaging with the dye also allowed for quantifiable non-contact wound monitoring through commercial bandages. CJ215 may be compatible with existing and emerging clinical solutions.


Conflict of interest statement

Disclosures: D.A.H. is a co-founder and officer with equity interest in Lime Therapeutics, Inc., and co-founder with equity interest in Selectin Therapeutics Inc., and Resident Diagnostics, Inc., and a member of the scientific advisory board of Concarlo Therapeutics, Inc., Nanorobotics Inc., and Mediphage Bioceuticals, Inc. B.M.L. & J.G. have filed a patent in relation to some of this work. The remaining authors declare no competing interests. CJ215 was a gift from Proimaging who did not sponsor this research aside from providing CJ215.

Figures

Figure 1.
Figure 1.. CJ215 spectral, in vitro, and in vivo assessment.
A) The absorption of CJ215 dissolved in either fetal bovine serum (solid line) or dextrose (dotted line) was assessed at concentrations from 20.30 μM to 0.203 μM. The entire absorption spectrum red shifted in serum 12nm from a peak of 798 to 810 nm, like that of ICG. B) The SWIR emission tail of the dye was characterized from 950 to 1550 nm with notable emission past 1100 nm and a 4x increase in intensity when dissolved in serum vs dextrose. C) Representative single cell NIR confocal microscopy localization uptake of CJ215 (green, 3hr incubation period) in 4T1 cells, stained with DAPI (nucleus) with polarized white light images overlayed (grayscale). Inset, zoom in of vesicles containing CJ215 and their transport within the cell highlighting vesicle localization (T1=0s, T2=+23.175s, T3=+38.625s). D) Representative Z-stack slice of CJ215 uptake in 4T1 spheroids (green, 3hr incubation period), inset, zoomed in image highlighting vesicle transport over time (T1=0s, T2=+17.962s, T3=+35.924s). Supplemental videos 1 and 2 further show vesicle transport. E) CJ215 uptake in 4T1 cells is based upon active transport with cells incubated with the dye at 37°C showing significantly increased (39.067%, Welch’s two sided, unpaired, parametric t-test) uptake compared to those incubated with CJ215 at 4°C, mean and standard deviation (SD) are shown based on n=18 technical replicates from n=3 biological replicates (6 well plates). F) Cell damage and apoptosis induction by staurosporine (Sta) significantly increases CJ215 uptake in HT1080 cells by 99.298% compared to control cells. zVad-FMK (zVAD, an apoptosis blocker) combined with Sta reduced maximum uptake (48.826%) compared to Sta alone. Mean, SD, and replicates (dots) are shown with statistical analysis shown based on a non-paired or matched Welch and Brown-Forsythe ANOVA with Dunnet T3 multiple comparisons test. G) Ambient light resistant SWIRFI based (>900 nm) screening of four tumor cell lines including 4T1 (breast, orthotopic, murine), PC3-PSMA (prostate, heterotopic, human), HT1080 (fibrosarcoma, orthotopic, human) and CT26 (colon, heterotopic, murine). Top, representative images of all tumor lines 1 hr post intravenous systemic injection of CJ215. Fluorescence reflections are visible in the ambient lighting LED (red arrow, circular object in bottom right). Bottom, images of tumor uptake and localization of CJ215 144 or 168 hrs post injection at video rate exposures (1–10ms). In all cases the tumor can be readily delineated. H) Signal to noise ratio (SNR, dB) quantification of all tumor lines. At all timepoints sufficient SNR is achieved above the 5dB threshold with exposure times ranging from 1–2 ms (808nm excitation, ~300 mW/cm2). I) Contrast to noise ratio (CNR, dB) quantification for all tumors and all mice, where sufficient contrast is achieved (above 3dB threshold) 24hrs post injection with CNR steadily increasing up to 144/168 hrs for all tested tumor lines. In all cases the mean (dot) and SD are shown from n=4 mice per tumor line (n=16 mice total).
Figure 2.
Figure 2.. Tumor resection using SWIRFI (>900nm, sensor response) and CJ215.
A) Resection confirmation of various tumors in euthanized mice. In all cases the primary tumor site is highlighted by the solid arrow, with remnant lesions highlighted by the dotted arrow. In the PC3-PSMA cohort, resection was performed twice on one mouse to completely resect all tumor areas (1, 2). B) SNR quantification of all resected lesions, with sufficient contrast achieved in all cases (>5dB threshold). C) CNR quantification of all resected lesions, in all cases sufficient CNR was achieved (>3dB threshold) for all primary tumor sites. In all cases the mean, SD, and each replicate (dots, n=4 mice per tumor line, 5 dots include secondary sites) are shown for all tumor lines. Statistical comparisons were not performed as all tumors fulfilled SNR and CNR thresholds. D) H&E staining of tumor areas removed during resection; images shown at 20x magnification. All fluorescent areas were confirmed to be tumorous as characterized by the high density of nuclei. For the remnant PC3-PSMA tumor (2) removed during R2, this was determined as residual primary tumor tissue below the skin surface.
Figure 3.
Figure 3.. Extended spectral emission (>1100, >1300nm) assessment of CJ215 via SWIRFI.
A) Extended spectral emission assessment of CJ215 and SWIRFI for resection at >900 (spectral response of the sensor), >1100, and >1300 nm cutoffs (long pass optical filters) for HT1080 and CT26 tumor lines. Note, the core of the tumor becomes most prominent >1300 nm. Non-specific uptake (lymphatic) is seen in the head of the HT1080 mouse. Primary tumor sites are highlighted (solid arrow) along with suspect secondary sites (dotted arrows). B) SNR and CNR quantification of the HT1080 tumor line, with >1100 presenting the highest contrast but not significantly improved over >900 nm. C) SNR and CNR quantification of the CT26 tumor line, with no difference found in CNR between tested cutoffs. D) Combined assessment of HT1080 and CT26 with >1300 nm found to provide the lowest SNR compared to other cutoffs with no significant difference in CNR found when combining both groups. In all cases the mean, SD and replicates are shown (n=4 per tumor line, n=8 for combined) with statistical analysis shown based on a non-paired or matched Welch and Brown-Forsythe ANOVA with Dunnet T3 multiple comparisons test. Thresholds are shown as before (5dB and 3dB for SNR and CNR, respectively). E) Zoomed in view of the CT26 tumor at 900, 1100 and 1300 nm. F) Vertical and horizontal full width at half maximum (FWHM) assessment (dotted grey lines, E) of the tumor at all wavelengths. The qualitative improvement in tumor core delineation seen at >1100 and best at >1300 nm, is also observed quantitatively. G) Corresponding cleaved caspase 3 (CC3) immunohistochemistry staining of the CT26 tumor shown in A and E, showing highest levels of apoptosis at the tumor core with positively stained cells present throughout the sample (i-iv). Black arrows show the approximate slice location with corresponding white arrows in E.
Figure 4.
Figure 4.. NIRFI (745nm excitation, 840nm emission) necropsy biodistribution assessment of CJ215 in four tumor models.
Following resection various organs were harvested for necropsy based biodistribution assessment via NIRFI (IVIS Spectrum, 745nm excitation, 840nm emission) at exposure times from 5–20s. Tumors had the highest level of uptake in all tumor models. Residual kidney fluorescence identifies renal clearance of CJ215. Organs are shown in order of decreasing fluorescence intensity with notable tumor/organ ratios shown. Select p values from unpaired parametric Welch’s t test comparing tumor to organs are shown with the mean (gray bar), SD (black bars) and individual replicates shown (dots, n=4 mice).
Figure 5.
Figure 5.. Necropsy and histological analysis of additional regions of interest during CT26 tumor resection.
A) During CT26 resection and necropsy small areas (labelled as 3.i, 3.ii, etc.) were identified and found to be highly fluorescent (NIRFI, IVIS Spectrum, 745nm excitation, 840nm emission) over background areas and muscle tissue. B) Quantification of ROIs with ROI to muscle ratios shown (italics). C) Left, H&E staining of resected tissues from M3 identified (clockwise) as a lymph node surrounded by adipose tissue (3.i), the small intestine with pancreas and a small neoplastic tumor area not bound to any identifiable tissue (3.ii) and finally the reproductive organs including the uterus, oviduct, ovaries (3.iii). Right, H&E staining of resected tissues from M4 identified (clockwise) as the skin and subcutis (4.i), the small intestine with adipose tissue (4.ii) and finally a lymph node also surrounded by adipose tissue (4.iii). D) Cleaved caspase 3 positive (CC3+, for apoptosis i.e., damaged cells) IHC staining on a consecutive slice for each mouse sample. Labelled boxes highlight ROIs with increased levels of CC3 specific staining. Non-specific CC3 staining widely seen in the small intestine of M3 should be ignored. E) Zoomed in areas as highlighted at various magnification levels: 3.i Small to moderate number of CC3+ cells were seen in the lymph node cortex and paracortex. 3.ii CC3+ cells were found in the tumor region. 3.iii.a CC3+ cells are highlighted in the granulosa of ovarian follicles. 3.iii.b Small number of CC3+ cells are seen within the endometrial epithelium. 4.i No CC3+ cells were seen in the skin. 4.ii Moderate number of CC3+ cells are seen within the crypts with a small number in the enterocytes of villi. 4.iii.a & 4.iii.b Small to moderated number of CC3+ cells were seen throughout lymph node cortex and paracortex.
Figure 6.
Figure 6.. SWIRFI (>900nm) and CJ215 enable contrast-based image generation for binary tumor delineation.
A) Schematic describing the framewise computation of contrast images, based on user input with >900nm SWIRFI images. Made with Biorender.com. B-E) Representative SWIRFI input and output images for all tested tumor lines, >900 nm. The CNR threshold of 3dB was found to be effective for all tumor lines at the 144/168 hr timepoints. The white dotted circle represents the user chosen background reference point. Presented images are single frames from post-processed (corrected) video rate acquisitions, the entire videos are available in Supplemental Video 3. Non-specific uptake is present at the tail of the HT1080 mouse, but the tumor is delineated over surrounding tissue.
Figure 7.
Figure 7.. CJ215 assessment in a colorectal peritoneal carcinomatosis model (SW1222).
A) SWIR reflection image (940nm) of a mouse bearing SW1222 within and protruding through the peritoneum (white solid arrow). B) >1300nm image 1h post CJ215 administration. C) >1300nm image at 168h post CJ215 administration. D) Representative NIRFI (840nm) necropsy image of select organs (M4) including a representative large tumor mass found throughout the peritoneal space, the spleen (dashed white arrow), a tumor mass on the pancreas (dashed yellow arrow) and muscle tissue. E) Representative H&E staining of the tissues as shown in B confirming necrotic regions present in the larger tumor mass, normal spleen, and pancreatic tumor (less necrosis than the large tumor mass) and muscle tissue. F) Quantification of dye distribution in the SW1222 model. Select tumor to organ ratios are provided with CJ215 highlighting its renal clearance. Pancreatic tumor masses were quantified separately and compared to both the spleen and muscle tissue. Organs are organized in order of decreasing fluorescence intensity with select ratios, the mean (gray bar), SD (black bars) and individual replicates shown (red dots, n=4) shown.
Figure 8.
Figure 8.. Non-invasive, non-contact and ambient light-resistant wound monitoring through commercially available bandages via SWIRFI (>1300nm) and CJ215.
A) Schematic representing the experimental protocol including the incision, suturing, injection, and imaging timepoints. Mice received a second injection once the wound had healed and were then imaged every 24 hrs from 1–48 hrs post this injection. Made with Biorender.com. B) Representative visible light and SWIRFI (>1300 nm) images without a bandage 2 hrs post-surgery and CJ215 injection. C) The same mouse as in A but with a hydrogel bandage place over the wound area. D) Representative images at 240h post-surgery and the first injection of CJ215 highlighting no remnant wound fluorescence (>1300nm). E) Representative images at 384h post-surgery and 48h post the second injection of CJ215 highlighting no wound area uptake (wound has completely healed) F) Contrast quantification from all mice at all investigated wavelengths (>900, >1100 and >1300 nm cutoffs) with (solid lines) and without bandage placement over wound area (dotted lines). Wound contrast peaks at 48h post-surgery and post injection, decreasing over time as the wound heals. Bandage application prevented wound delineation at 168 hrs. A 3dB CNR threshold (grey dotted line) was utilized as before. In all cases the mean and SD are shown from n=4 mice with mice being measured immediately before and after bandage application. >900nm video rate imaging is shown in Supplemental Video 4 with all Visible, >900, >1100 and >1300nm images of all mice shown in Supplemental Figures 39–42.

Update of

References

    1. Liu JT & Sanai N Trends and challenges for the clinical adoption of fluorescence-guided surgery. Journal of Nuclear Medicine 60, 756–757 (2019). - PMC - PubMed
    1. Pogue BW Perspective on the optics of medical imaging. J Biomed Opt 28, 121208–121208 (2023). - PMC - PubMed
    1. Sutton PA et al. Fluorescence-guided surgery: comprehensive review. BJS open 7, zrad049 (2023). - PMC - PubMed
    1. Teng CW et al. Second window ICG predicts gross-total resection and progression-free survival during brain metastasis surgery. Journal of Neurosurgery 135, 1026–1035 (2021). - PMC - PubMed
    1. Li M et al. 800CW Dye and 89Zr Dual-labeled Antibody for the PET/NIRF/Cerenkov Multi-modality Imaging of ICAM-1 (CD54) in Pancreatic Cancer. Journal of Nuclear Medicine 60, 331–331 (2019).

LinkOut - more resources