. 2024 Oct;56(10):2132-2143.
doi: 10.1038/s41588-024-01893-6. Epub 2024 Sep 9.

NSD2 is a requisite subunit of the AR/FOXA1 neo-enhanceosome in promoting prostate tumorigenesis

Affiliations

NSD2 is a requisite subunit of the AR/FOXA1 neo-enhanceosome in promoting prostate tumorigenesis

Abhijit Parolia et al. Nat Genet. 2024 Oct.

Abstract

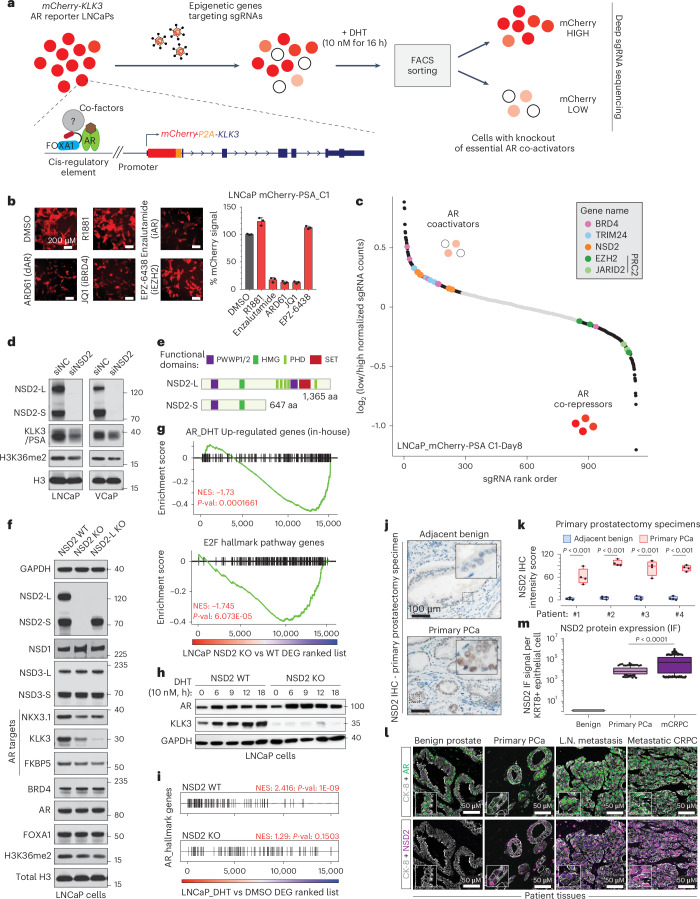
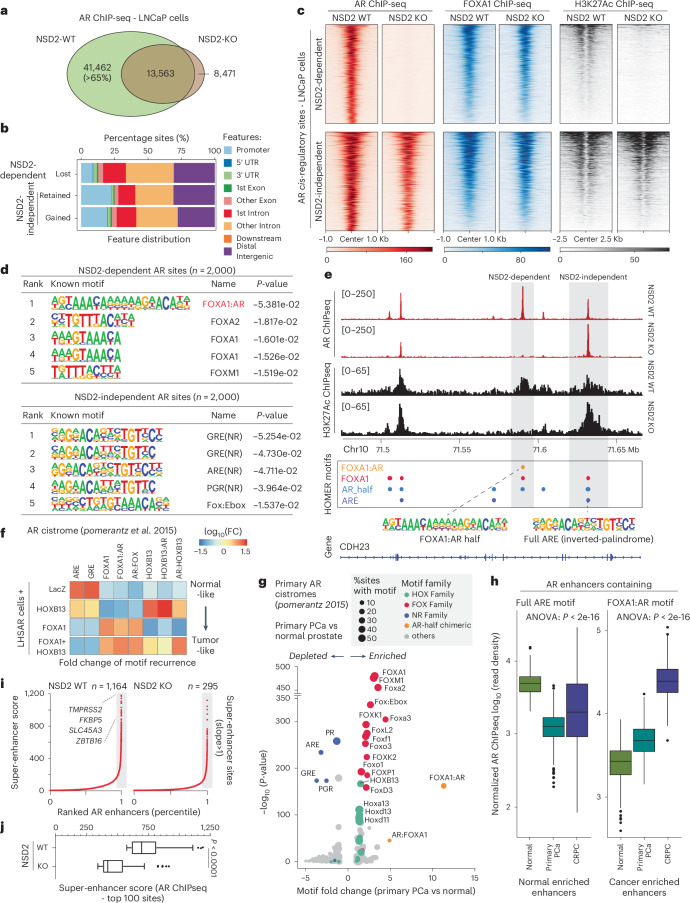
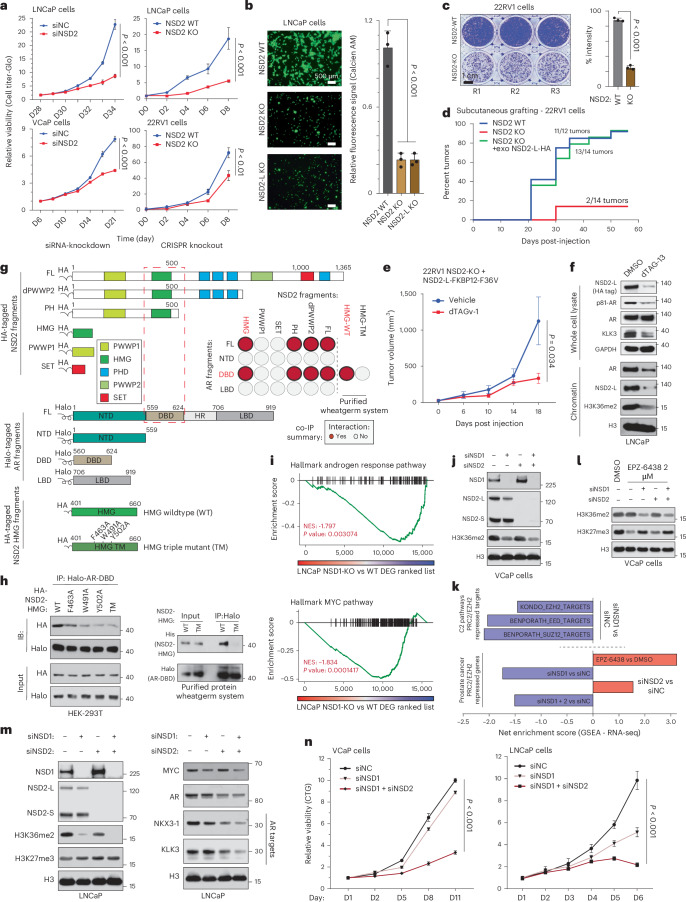
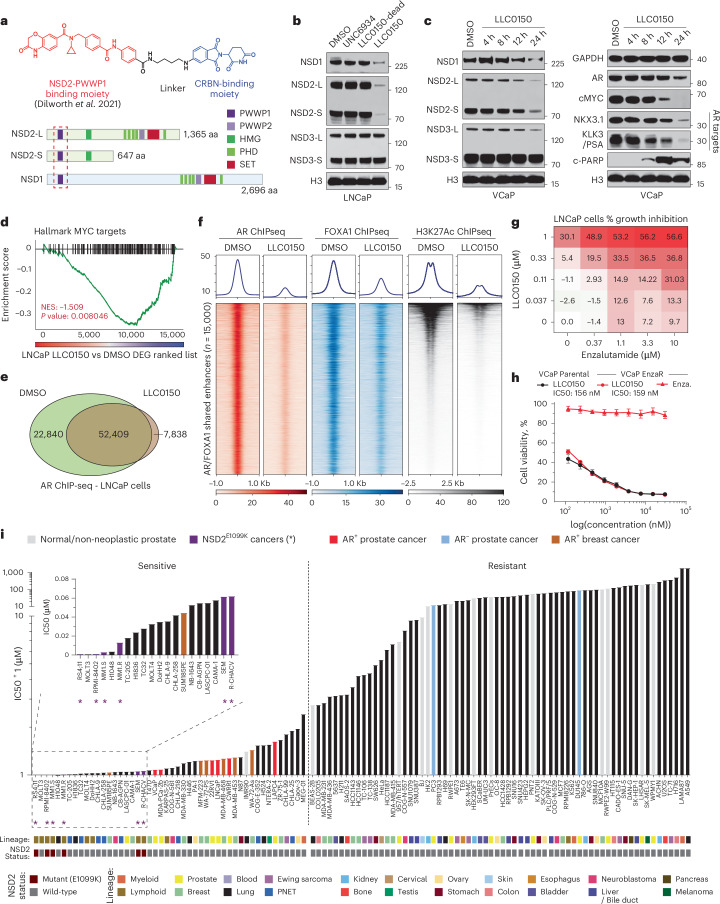
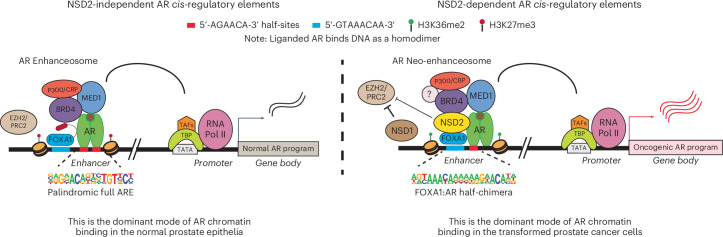
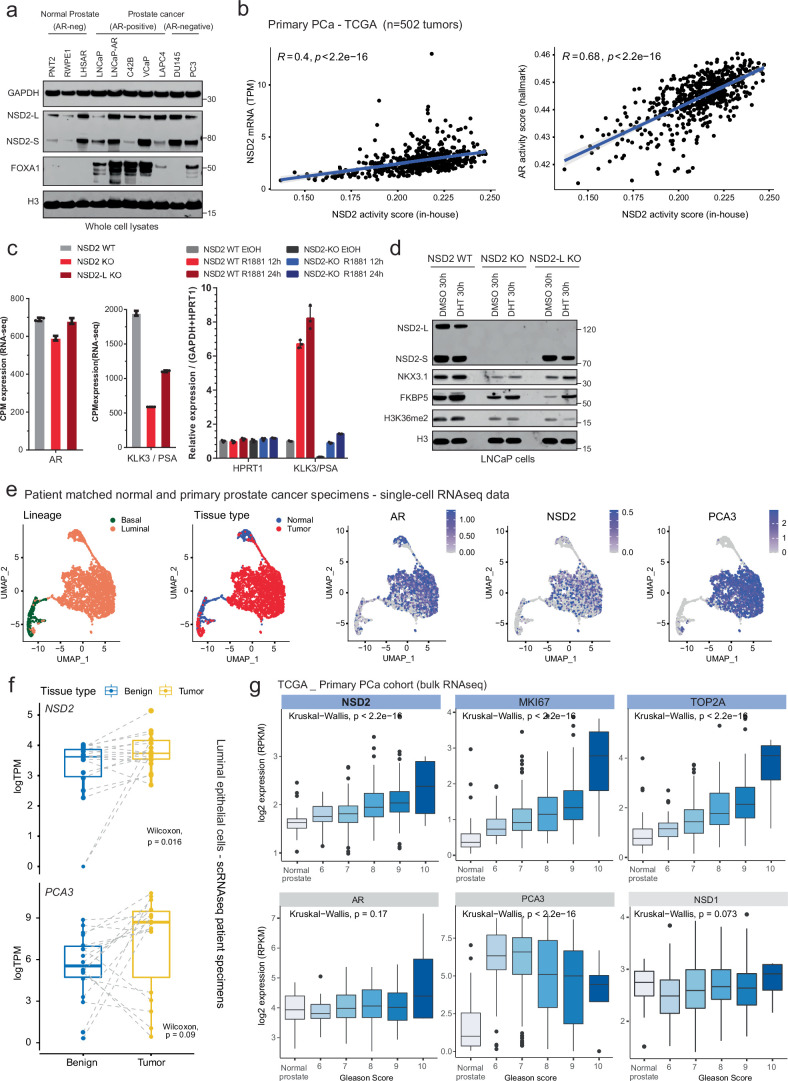
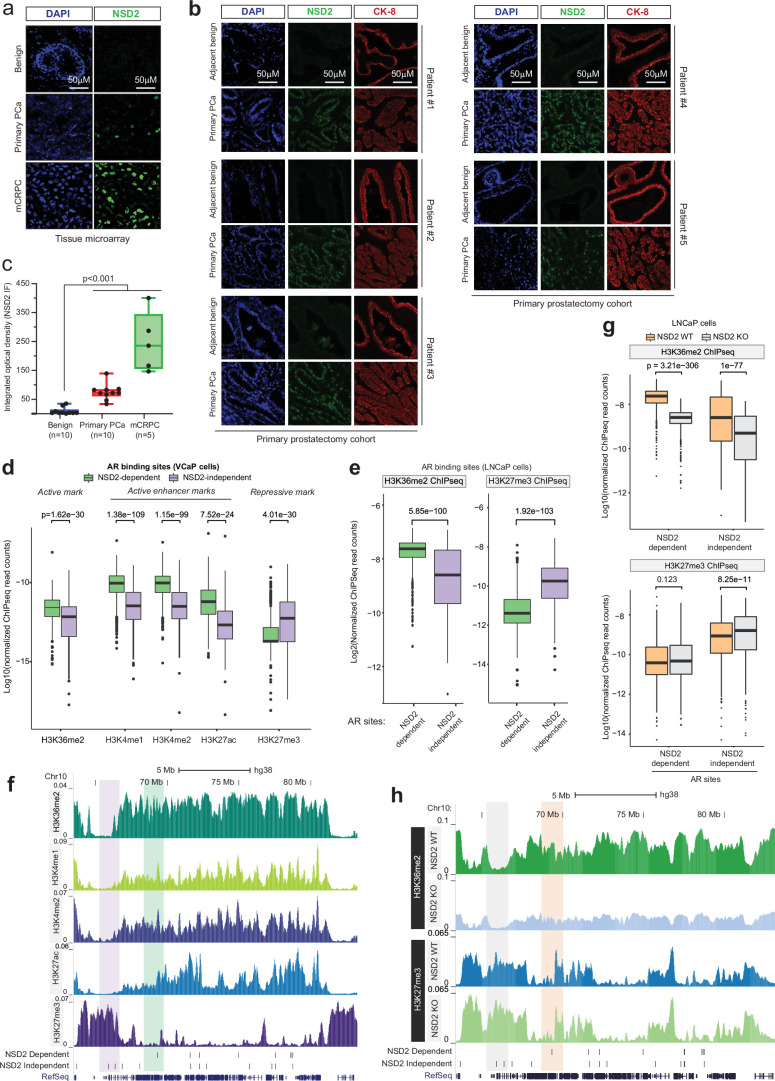
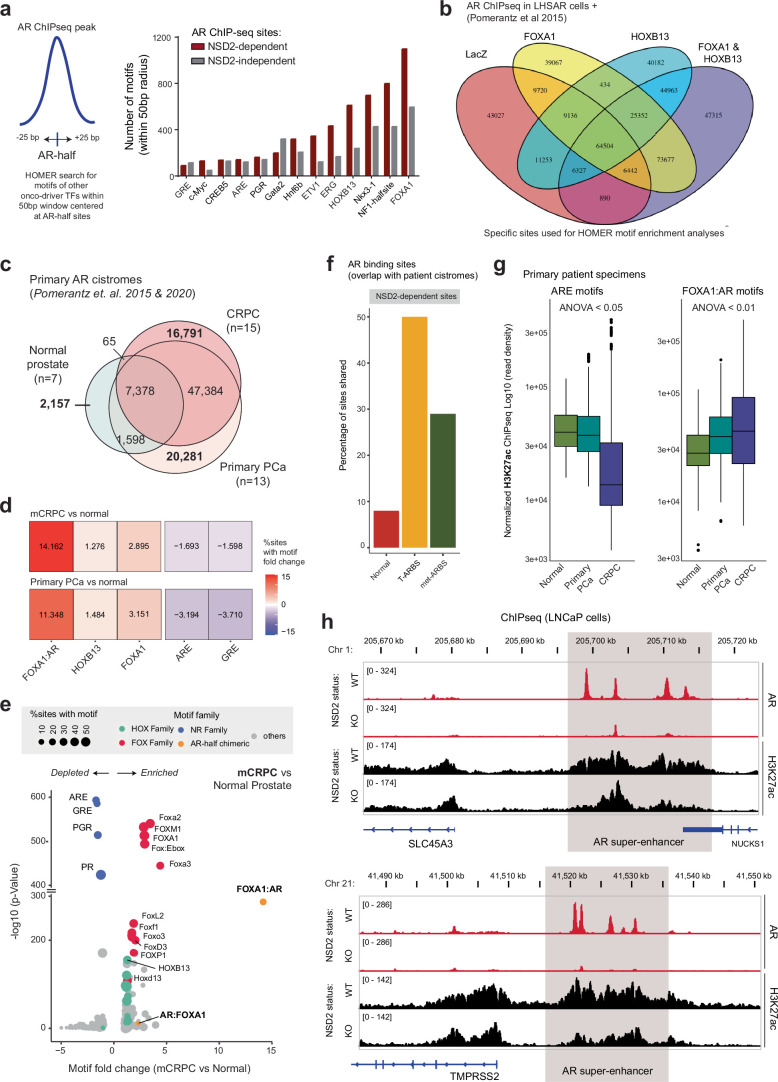
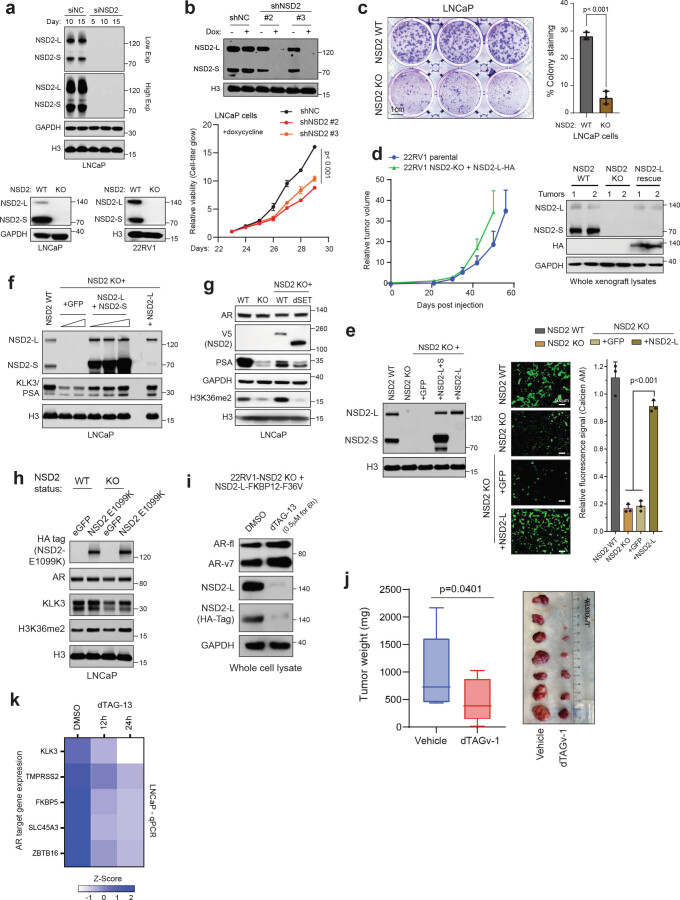
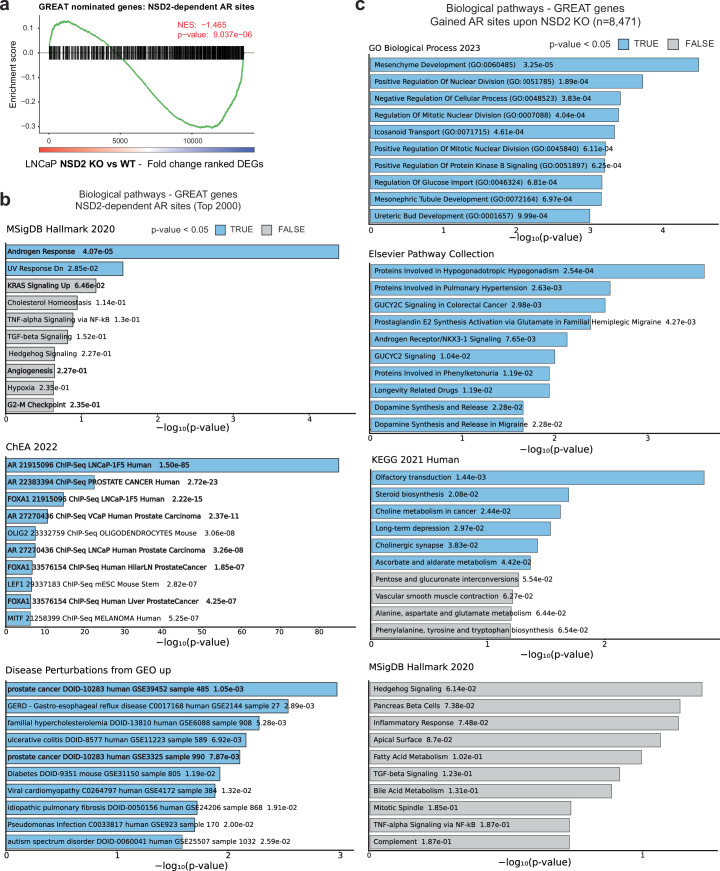
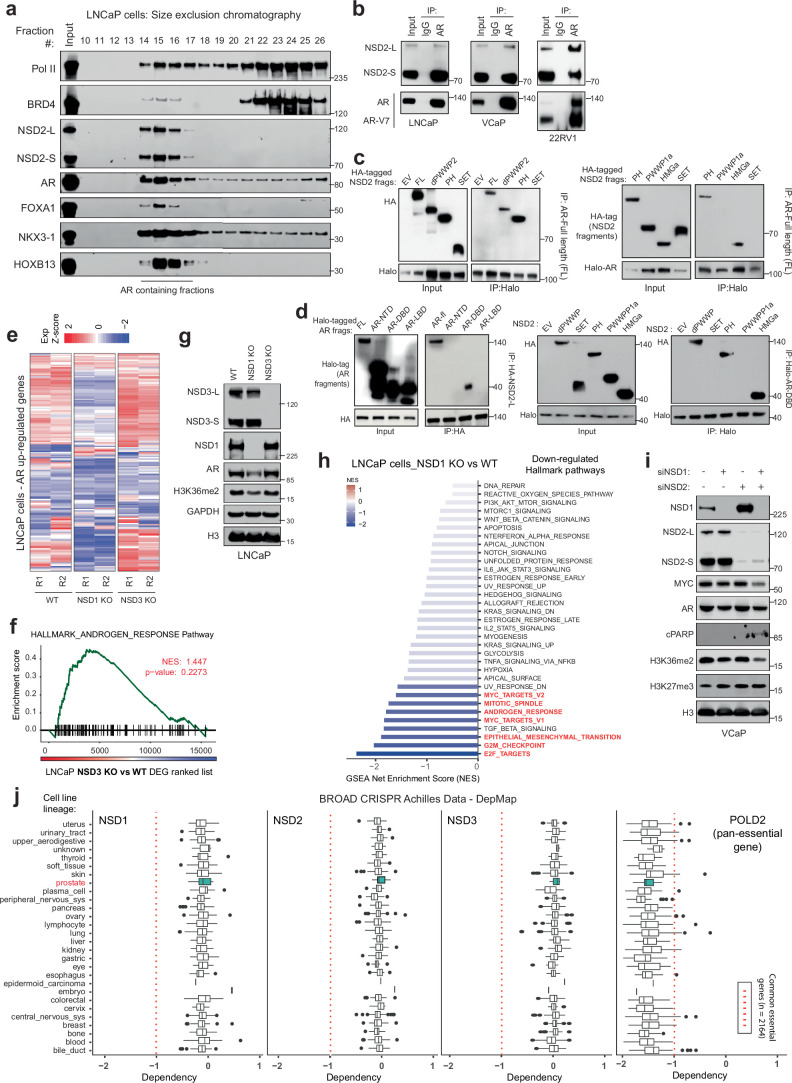
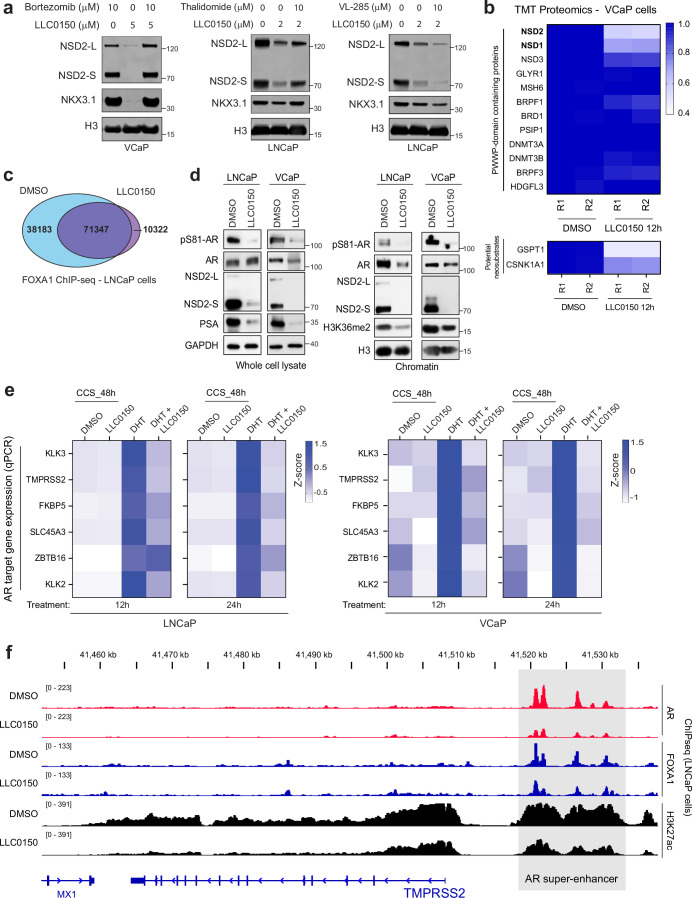
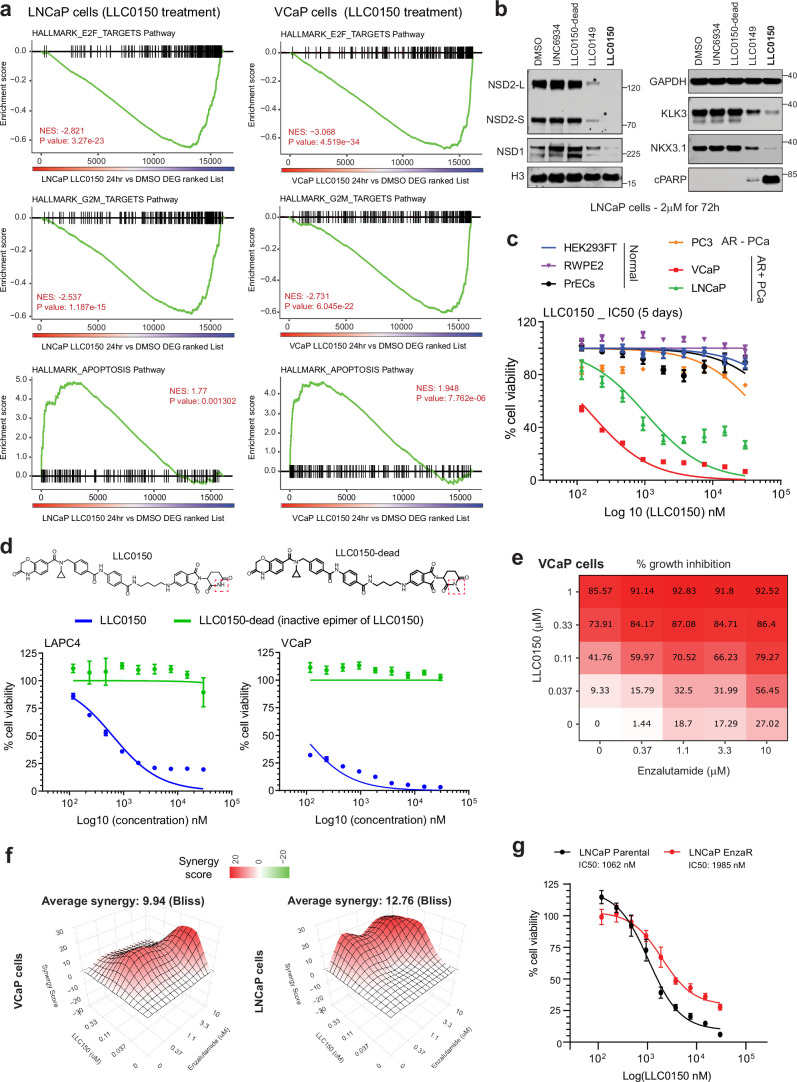
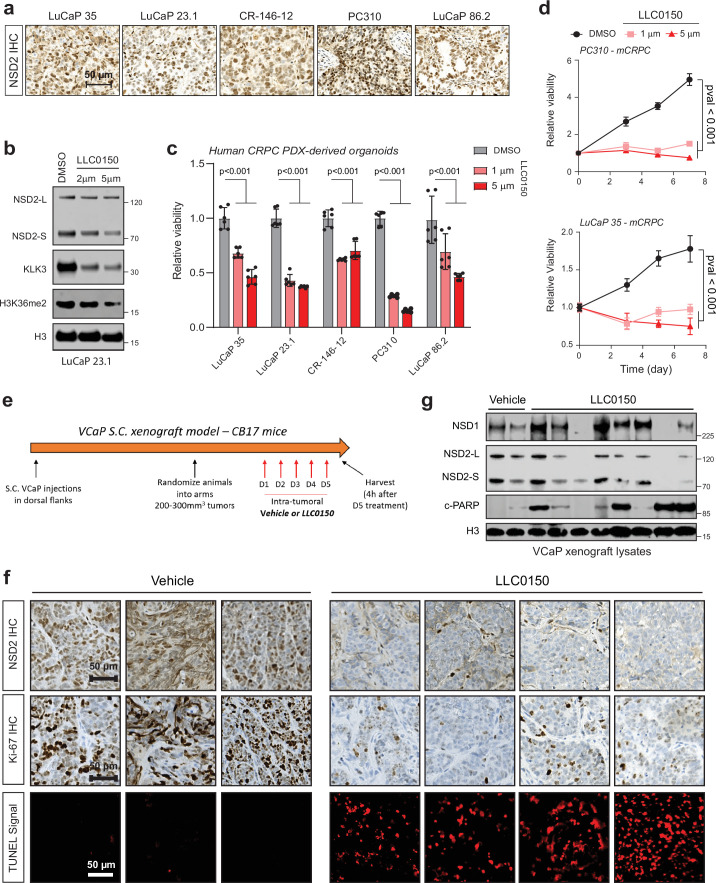
Androgen receptor (AR) is a ligand-responsive transcription factor that drives terminal differentiation of the prostatic luminal epithelia. By contrast, in tumors originating from these cells, AR chromatin occupancy is extensively reprogrammed to activate malignant phenotypes, the molecular mechanisms of which remain unknown. Here, we show that tumor-specific AR enhancers are critically reliant on H3K36 dimethyltransferase activity of NSD2. NSD2 expression is abnormally induced in prostate cancer, where its inactivation impairs AR transactivation potential by disrupting over 65% of its cistrome. NSD2-dependent AR sites distinctively harbor the chimeric FOXA1:AR half-motif, which exclusively comprise tumor-specific AR enhancer circuitries defined from patient specimens. NSD2 inactivation also engenders increased dependency on the NSD1 paralog, and a dual NSD1/2 PROTAC degrader is preferentially cytotoxic in AR-dependent prostate cancer models. Altogether, we characterize NSD2 as an essential AR neo-enhanceosome subunit that enables its oncogenic activity, and position NSD1/2 as viable co-targets in advanced prostate cancer.


Conflict of interest statement

All the authors declare no competing financial interests.

Figures

Fig. 1
Fig. 1. Epigenetics-focused CRISPR screen shows NSD2 as an AR coactivator.
a, Schematic of the epigenetic-targeted CRISPR screen using LNCaP-mCherry-KLK3 AR reporter lines. b, Left: mCherry immunofluorescence images of LNCaP reporters treated with labeled epigenetic drugs. Right: Barplot showing quantification of the mCherry signal from treated reporter cells normalized to the DMSO treatment (n = 3 biological replicates). Mean ± standard error of the mean (s.e.m.) are shown. Scale bar: 200 µm. c, sgRNA enrichment rank plot based on guide RNA ratio in mCherry-LOW to mCherry-HIGH cells. d, Immunoblots of listed proteins upon treatment with control (siNC) or NSD2-targeting (siNSD2) siRNAs. Total H3 is used as loading control. LNCaP lysates were collected at day 15. VCaP lysates were collected at day 10 or 15 after treatment. e, Representative protein map of NSD2-Long (NSD2-L) and NSD2-Short (NSD2-S) isoforms. HMG: High mobility group; PHD: Plant homeodomain. f, Immunoblots of noted proteins in CRISPR-mediated stable knockout (KO) of both NSD2 isoforms or NSD2-L alone. Total H3 is used as loading control. g, Gene set enrichment analysis (GSEA) plots for AR and E2F upregulated genes using the fold-change rank-ordered genes from the NSD2 knockout (KO) vs wild-type (WT) LNCaP cells. DEGS, differentially expressed genes (n = 2 biological replicates; GSEA enrichment test). h, Immunoblots of listed proteins in NSD2-KO LNCaP cells stimulated with 10 nM DHT. i, GSEA plots of AR hallmark genes in NSD2 wild-type (WT) vs knockout (KO) LNCaP cells using the fold-change rank-ordered genes from DHT (10 nM for 24 h) vs DMSO treatment. DEGS, differentially expressed genes (n = 2 biological replicates; GSEA enrichment test). j, Representative immunohistochemistry (IHC) images of NSD2 in prostatectomy patient specimens. Scale bar: 100 µm. k, NSD2 signal intensity from IHC staining in panel j (n = 4 patient tumors; two-sided t-test). Box plot center, median; box, quartiles 1-3, whiskers, quartiles 1-3 ± 1.5× interquartile range, dot, outliers. l, Representative multiplex immunofluorescence (IF) images of KRT8, AR, and NSD2 in benign prostate, primary PCa or mCRPC patient specimens. Scale bar: 5 µm. m, Quantification of NSD2 IF signal intensity per KRT8+ luminal epithelial cell from images in panel l (two-sided t-test; Normal=39, primary PCa = 145, mCRPC=381 nuclei). Box plot center, median; box, quartile 1-3; whiskers, 10th and 90th percentile; dot, outliers. Source data
Fig. 2
Fig. 2. NSD2 expands the AR neo-enhancer circuitry to include chimeric AR half-sites.
a, Venn diagram showing overlaps of AR ChIP-seq peaks in NSD2 wild-type (WT) and knockout (KO) LNCaP cell lines. b, Genomic location of NSD2-dependent and independent AR sites defined from the overlap analysis in panel a. c, ChIP-seq read-density heatmaps of AR, FOXA1, and H3K27ac at top 1,000 AR enhancer sites in LNCaP NSD2 WT and KO cell lines. d, Top five known HOMER motifs enriched within NSD2-dependent and independent AR sites in LNCaP cells (HOMER, hypergeometric test). e, ChIP-seq read-density tracks of AR and H3K27ac in NSD2 WT and KO LNCaP cell lines. HOMER motifs detected within AR peaks are shown below with gray boxes highlighting NSD2-dependent and independent AR elements. f, Fold-change heatmap of HOMER motifs enrichment within AR binding sites specific to HOXB13, FOXA1 or FOXA1 + HOXB13 overexpression in LHSAR cells (data from Pomerantz et al.). g, Fold-change and significance of HOMER motifs enriched within primary PCa-specific AR sites over normal AR enhancers (data from Pomerantz et al.; HOMER, hypergeometric test). h, AR ChIP-seq read-density box plot at sites containing the ARE or the FOXA1:AR chimeric motif in primary normal and tumor patient samples (normal prostate, n = 7; primary PCa, n = 13; mCRPC, n = 15). In box plots, the center line shows the median, box edges mark quartiles 1-3, and whiskers span quartiles 1-3 ± 1.5× interquartile range (one-way ANOVA). i, Rank-ordered plot of AR super-enhancers (HOMER ROSE algorithm) in NSD2 WT and KO LNCaP cells with select known AR target genes shown. j, Box plot of AR super-enhancer scores (HOMER ROSE algorithm) of top 100 cis-elements in NSD2 WT or KO LNCaP cells (two-sided t-test). Box plot center, median; box, quartiles 1-3; whiskers, quartiles 1-3 ± 1.5× interquartile range; dot, outliers. Source data
Fig. 3
Fig. 3. NSD1 and NSD2 independently enable oncogenic AR activity.
a, Left: Growth curves of cells treated with control (siNC) or NSD2-targeting siRNAs (n = 6 biological replicates; two-sided t-test). Right: Growth curves of NSD2 knockout (KO) or wild-type (WT) cells (n = 3 biological replicates; two-sided t-test). Mean ± s.e.m. are shown. b, Left: Boyden chamber images of NSD2-KO and WT cells. Scale bar: 500 µm. Right: Quantification of fluorescence signal (n = 3 biological replication; one-way ANOVA + Tukey’s test). Mean ± s.e.m. are shown. c, Left: Representative images of NSD2-KO and WT 22RV1 cell colonies (n = 3 biological replicates). Scale bar: 1 cm. Right: Staining intensity of cell colonies (two-sided t-test). Mean ± s.e.m. are shown. d, Reverse Kaplan-Meier plot of tumor grafting of 22RV1 WT, NSD2-KO, or NSD2-KO + NSD2-L cells. e, Tumor volumes of 22RV1 NSD2-KO + NSD2-L-FKBP12F36V xenografts ± dTAGv-1 treatment. Mean ± s.e.m. are shown (n = 10 biological replicates; two-sided t-test). f, Immunoblots of listed proteins in whole-cell or chromatin fractions of LNCaP NSD2-FKBP12F36V cells ± dTAG-13. g, Schematic of coimmunoprecipitation (coIP) protein fragments. Dashed red box marks interacting domains. Inset: AR-NSD2 co-IP interaction summary. Red circles, interaction. Gray circles, no detectable binding. h, Left: co-IP immunoblots of AR DNA-binding domain (DBD) with HA-NSD2-HMG mutants. TM, triple mutant. Right: co-IP immunoblots of wheatgerm-purified Halo-AR-DBD with His-NSD2-HMG fragments. Input fractions are shown as control. i, GSEA plots for AR and MYC target genes in NSD1 KO vs WT LNCaP cells. DEGS, differentially expressed genes (n = 2 biological replicates; GSEA enrichment test). j, Immunoblots of labeled proteins upon treatment with siNC or NSD1 and/or NSD2 targeting siRNAs (siNSD1 or siNSD2). H3 is a loading control. k, Top: GSEA enrichment scores of EZH2/PRC2-repressed genesets in siNSD1 versus siNC-treated cells. Bottom: GSEA enrichment scores of PCa-specific EZH2 signature in siNSD1 and/or siNSD2 vs siNC-treated cells. l, Immunoblots of noted proteins in siNSD1 and/or siNSD2 treated cells ± EPZ-6438. m, Immunoblot of listed proteins in siNC or siNSD1 and/or siNSD2 treated cells. n, Left: Growth curves of cells treated with siNC, siNSD1 or siNSD1 + NSD2. Right: Growth curves of control (sgNC) or NSD1-deficient (sgNSD1) cells ± siNSD2 treatment (n = 5 biological replicates; two-sided t-test). Mean ± s.e.m. are shown. Source data
Fig. 4
Fig. 4. LLC0150 is an NSD1/2 PROTAC with preferential cytotoxicity in AR-driven PCa.
a, Structure of LLC0150 and schema of NSD1 and NSD2 functional domains. LLC0150-binding PWWP1 domain is highlighted using a dashed red box. HMG: High mobility group; PHD: Plant homeodomain. b, Immunoblots of listed proteins in LNCaP cells treated with UNC6934 (warhead), LLC0150-dead (epimer control) or LLC0150 for 12 h at 1 μM. Total histone H3 is used as a loading control. c, Immunoblots of listed proteins in VCaP cells treated with LLC0150 (2uM) for increasing time durations. Total histone H3 is used as a loading control. d, GSEA plots of MYC target genes using the fold-change rank-ordered genes from LLC0150 vs DMSO treated LNCaP cells. DEGS, differentially expressed genes (n = 2 biological replicates; GSEA enrichment test). e, Venn diagram showing the overlap of AR ChIP-seq peaks in LNCaP cells treated with LLC0150 (2 μM for 48 h) or DMSO as control. f, ChIP-seq read-density heatmaps of AR, FOXA1, and H3K27ac at enhancers that are co-bound by AR and FOXA1 in LNCaP cells plus/minus treatment with LLC0150 (2 μM for 48 h). g, Percent growth inhibition (Cell-titer Glo) of LNCaP cells upon co-treatment with varying concentrations of LLC0150 and enzalutamide. h, Dose-response curves of LLC0150 or enzalutamide in parental or enzalutamide-resistant VCaP cells. Data are presented as mean ± SEM (n = 2 biological replicates). Serving as a control, enzalutamide dose-response curve credentials the enzalutamide-resistant VCaP cell line. i, IC50 rank-order plot of over 110 human-derived normal or cancer cell lines after 5 days of treatment with LLC0150. AR+ PCa models are highlighted in red, and NSD2-mutant hematologic cell lines are shown in purple as well as marked with an asterisk (*). Each cell line’s originating tissue lineages and known NSD2 alteration status are shown below. Source data
Fig. 5
Fig. 5. Schema depicting NSD2’s role in loading the AR enhanceosome at tumor-enriched chimeric AR neo-enhancer elements.
Chromatin loading of AR in prostate epithelial cells follows two distinct modes of DNA interactions: Left: NSD2-independent binding at cis-elements harboring the canonical, 15 bp palindromic AREs that are predominantly found in the physiological/normal enhancer circuitry, and Right: NSD2-dependent loading at cis-regulatory elements harboring chimeric AR half-motifs juxtaposed to the FOXA1 sequence that distinctively constitute the PCa-specific enhancer/super-enhancer (that is, AR neo-enhancer) circuitries. NSD1, partly supported by NSD2, counteracts repressive activity of the PRC2/EZH2 complex, thus further amplifying AR/MYC gene expression programs in mCRPC cells.
Extended Data Fig. 1
Extended Data Fig. 1. Generation and characterization of the endogenous mCherry-PSA AR reporter cell lines.
a) Schematic representation of the workflow of LNCaP-mCherry-PSA AR reporter cell line generation. b) DNA gel electrophoresis image showing the exogenously inserted mCherry amplicon in the LNCaP-mCherry-PSA lines. Clones 1 and 2 were used for the functional CRISPR screen. c) Sanger sequencing chromatograms of the PCR amplicon from reporter cells in panel (b) showing the KLK3/PSA gene promoter and exon 1 start codon junctions. d) Representative brightfield and mCherry immunofluorescence images of the LNCaP-mCherry-PSA clone 1 treated with (top) AR-targeting siRNA or antisense oligonucleotides (ASOs) (siAR and ASO AR respectively) or enzalutamide (bottom left). Reporter cells were also serum starved for 48 h and stimulated with DHT (10 nM for 12 h) to showcase gain in signal (bottom right). All treatments were repeated at least twice. Scale bar: 500 µm. e) Immunoblots of noted proteins in LNCaP reporter cells as in panel (d). f) Expression (qPCR) of noted genes in reporter monoclones treated as in panel (d) to manipulate AR signaling (n = 3 biological replicates). Mean +/- SEM is shown. g) Immunoblots of noted proteins, including the exogenously introduced mCherry protein, in LNCaP reporter cells treated with AR-targeting epigenetic drugs. Total H3 is used as a loading control. h) Next-generation sequencing-based abundance of sgRNAs in the epigenetic-focused library used in the CRISPR screen highlighting some of the known epigenetic regulators of AR. i) Individual NSD1, NSD2, or EZH2-targeting sgRNA ratios in mCherry-LOW to mCherry-HIGH cells in the CRISPR screen. Source data
Extended Data Fig. 2
Extended Data Fig. 2. NSD2 transcript and protein expression in primary patient specimens.
a) Immunoblot of labeled proteins in a collection of AR-positive and AR-negative prostate cell lines. GAPDH and H3 are used as a loading control. b) Left: Correlation plots showing the NSD2 transcript expression and gene signature-based “NSD2 activity score” in primary prostate cancers from the TCGA cohort (n = 502 tumors). Right: Correlation plots showing NSD2 activity score and the widely-used hallmark AR activity score in primary PCa tumors. (Pearson’s linear correlation coefficient, permutation test). Line, mean; shaded region, SEM. c) Relative expression (qPCR or RNA-seq) of AR and KLK3 transcripts in CRISPR-edited NSD2-KO or NSD2-L-KO LNCaP cells (left; n = 2 biological replicates) or NSD2 CRISPR-edited cells stimulated with R1881 for 12 or 24 h (right; n = 3 biological replicates). HPRT1 is used as a loading control. Mean +/- SEM is shown. d) Immunoblot of labeled proteins in LNCaP NSD2 WT and KO cells stimulated with DHT for 30 h. e) UMAP plots from patient-matched normal and primary prostate cancer single-cell RNA-seq data. f) NSD2 and PCA3 transcript expression in patient-matched normal and primary prostate cancer luminal epithelial cells (pseudo-bulk analyses from single-cell data; n = 15 biological replicates, two-sided Wilcoxon test). Box plot center, median; box, quartiles 1-3; whiskers, quartiles 1-3 ± 1.5 × interquartile range; dot are outliers. g) Box plot showing RNA expression of labeled genes in primary prostate cancer specimens (TCGA cohort) stratified by the Gleason score (normal = 52; Gleason 6 = 46; Gleason 7 = 249, Gleason 8 = 65; Gleason 9 = 138, Gleason 10 = 4 tumor specimens. One-way ANOVA and Kruskal-Wallis test). Box plot center, median; box, quartiles 1-3; whiskers, quartiles 1-3 ± 1.5 × interquartile range; dot, outliers. Source data
Extended Data Fig. 3
Extended Data Fig. 3. NSD2 and H3K36me2 expression in patient tumors and prostate cancer cell lines.
a) Representative immunofluorescence (IF) images of NSD2 in benign prostate, primary prostate cancer (PCa), and metastatic CRPC tissue microarray.Scale bar:50 µm. b) Representative multiplex IF images of NSD2 and CK-8 in adjacent benign and primary prostate cancer lesions in patient prostatectomies (n = 5 biological replicates, Scale bar:50 µm). c) Integrated optical density quantification of NSD2 IF staining in benign (n = 10), primary PCa (n = 10), and mCRPC (n = 5) tissues. Box plot center, median; box, quartiles 1-3; whiskers, min and max values. d) Box plots of normalized ChIP-seq reads of distinct activating and repressive histone modifications at NSD2-dependent and NSD2-independent AR sites in VCaP cells (n = top 2000 sites, two-sided t-test). Box plot center, median; box, quartiles 1-3; whiskers, quartiles 1-3 ± 1.5 × interquartile range; dot, outliers. e) Box plots of normalized ChIP-seq reads of NSD2-catalyzed H3K36me2 and EZH2/PRC2-catalyzed H3K27me3 histone marks at NSD2-dependent and NSD2-independent AR sites in LNCaP cells (n = top 2000 sites, two-sided t-test). Box plot center, median; box, quartiles 1-3; whiskers, quartiles 1-3 ± 1.5 × interquartile range; dot, outliers. f) ChIP-seq read-density tracks of histone modification within a Chr10 locus in VCaP cells. NSD2-dependent and independent AR sites are marked in the tracks below with representative enhancers highlighted. g) ChIP-seq read-density box plots showing H3K36m2 (top) and H3K27me3 (bottom) signals at AR sites in NSD2-KO or WT LNCaP cells (n = top 2000 sites, two-sided t-test). Box plot center, median; box, quartiles 1-3; whiskers, quartiles 1-3 ± 1.5 × interquartile range; dot, outliers. h) ChIP-seq read-density tracks of H3K36me2 and H3K27me3 within a Chr10 locus in NSD2 WT and KO LNCaP cell lines. NSD2-dependent and independent AR sites are marked and highlighted. Source data
Extended Data Fig. 4
Extended Data Fig. 4. Motif characterization of the NSD2-enabled AR neo-cistrome in prostate cancer cells.
a) Left: Schematic representation of the half-motif enrichment analysis. Right: Motif enrichment plot of AR half-motifs with neighboring motifs of other transcription factors at NSD2-dependent and independent AR sites in LNCaP cells. b) Venn diagram showing overlaps between AR ChIP-seq sites in LHSAR cells with LacZ (control), FOXA1, HOXB13, FOXA1 + HOXB13 overexpression. c) Venn diagram showing overlap of AR cistromes (ChIP-seq) in normal prostate, primary prostate cancer, and castration-resistant prostate cancer specimens. (Pomerantz et. al.,). d) Motif fold-change heatmap in normal, primary cancer, and castration-resistant prostate cancer specimens. e) Fold-change and significance of HOMER motifs enriched within mCRPC cancer-specific AR sites over normal tissue-specific AR elements (data from Pomerantz,). f) Barplot showing percentage of shared sites between the NSD2-dependent AR sites and AR cistromes from the normal prostate, primary PCa (T-ARBS), or metastatic CRPC (met-ARBS) patient tumors. g) Box plot showing H3K27ac ChIP-seq read density at sites containing the ARE or the FOXA1:AR motif in normal and tumor patient samples (normal prostate, n = 7; primary prostate cancer, n = 13; castration-resistant prostate cancer - CRPC, n = 15; one-way ANOVA and Tukey’s test). Box plot center, median; box, quartiles 1-3; whiskers, quartiles 1-3 ± 1.5 × interquartile range; dot, outliers. h) ChIP-seq read-density tracks of AR and H3K27ac within the SLC45A3 and TMPRSS2 loci in NSD2 WT and NSD2-KO LNCaP cells. Super-enhancer clusters are highlighted in a gray box. Source data
Extended Data Fig. 5
Extended Data Fig. 5. Molecular characterization of the NSD2-rescued prostate cancer cells.
a) Top: Immunoblots of noted proteins upon long-term treatment with control (siNC) or NSD2-targeting siRNA (siNSD2). Bottom: Immunoblot of NSD2 in LNCaP and 22RV1 cells treated with a control sgRNA or sgRNA targeting NSD2. GAPDH and H3 are used as loading controls. b) Top: Immunoblots of NSD2 and H3 from stable shNSD2-expressing LNCaP cells +/- doxycycline (1ug/ml for 72 h). Bottom: Growth curves (CTG) of control shRNA or shNSD2-expressing LNCaP cells plus doxycycline (n = 4 biological replicates, two-sided t-test). Mean +/- SEM are shown. c) Left: Representative images of colonies of control or NSD2-null LNCaP cells. Right: Quantification of stained colonies from left panel (n = 3 biological replicates, two-sided t-test). Mean +/- SEM are shown. Scale bar:1 cm. d) Left: Tumor volumes of 22RV1 parental or NSD2-KO + HA-tagged NSD2-L xenografts in mice. Right: Immunoblot of noted proteins from the 22RV1 xenograft tumors. (parental, n = 8; NSD2-KO, n = 7). Mean +/- SEM are shown. e) Left: Immunoblots showing expression of listed proteins in the eGFP or NSD2 overexpressing LNCaP cells. Right: Representative images from the Boyden chamber assay in the LNCaP NSD2 WT and KO or NSD2-L rescued lines. Fluorescence signal from invaded cells is shown (n = 3 biological replicates; one-way ANOVA and Tukey’s test, Scale bar:500 µm). f) Immunoblot of listed proteins in wild-type or NSD2-KO LNCaP cells with stable exogenous overexpression of NSD2-L and/or NSD2-S isoforms. eGFP is used as control. g) Immunoblots of noted proteins in the NSD2 wild-type or NSD2-KO LNCaP cells rescued with exogenous WT or SET domain-deleted mutants. h) Immunoblots of noted proteins in LNCaP cells with hyper-catalytic NSD2 SET domain E1099K mutant. i) Immunoblots of noted proteins in the 22RV1-NSD2-KO + NSD2-L-FKBP12-F36V engineered cell lines +/- dTAG-13 treatment. j) Left: Tumor weights of 22RV1 + NSD2-FKBP12-F36V xenografts at endpoint (day 18) +/- dTAGv-1 (n = 10 biological replicates; two-sided t-test). Right: Tumor images at the endpoint from the animal growth studies. Box plot center, median; box, quartiles 1-3; whiskers, min and max values. k) Expression of AR target genes in the 22RV1 NSD2-KO + NSD2-L-FKBP12-F36V cell line +/- dTAG-13 treatment for 12 h or 24 h. Source data
Extended Data Fig. 6
Extended Data Fig. 6. GREAT neighboring genes and pathway enrichment analyses.
a) Gene set enrichment analyses (GSEA) of GREAT nominated genes associated with the NSD2-dependent chimeric AR sites in NSD2-KO vs WT LNCaP cells (n = 2 biological replicates; GSEA enrichment test). b) GREAT and Enrichr analyses of putative chimeric AR gene targets in molecular signature and biology pathway databases (Fisher’s exact test). c) GREAT and Enrichr analyses of putative gene targets of gained AR sites in the NSD2-KO LNCaP cells in pathway collections and databases (Fisher’s exact test).
Extended Data Fig. 7
Extended Data Fig. 7. Fragment-based NSD2–AR coimmunoprecipitation and characterization of the NSD paralog knockout prostate cancer cells.
a) Immunoblots of noted proteins in size-exclusion chromatography fractions of nuclear lysate extracted from wild-type LNCaP cells. Fractions containing the AR protein are marked. b) Immunoblots of indicated proteins upon coimmunoprecipitation of AR in prostate cancer cells. c) Immunoblots of indicated proteins upon immunoprecipitation of exogenously expressed Halo-tagged full-length AR protein in HEK293FT cells that express HA-tagged NSD2 fragments. Both input (left) and immunoprecipitation (right) blots are shown. d) Left: Immunoblots of HA-tag-based immunoprecipitation of full-length NSD2 in HEK293FT cells that express the Halo-tagged AR protein fragments. Right: Immunoblots of Halo-tag-based immunoprecipitation of the DNA-binding domain (DBD) of AR in HEK293FT cells that overexpress different HA-tagged NSD2 fragments. For both experiments, input and immunoprecipitation blots are shown. e) Heatmap of AR upregulated genes (z-score) in NSD1 or NSD3 knockout (KO) LNCaP cells. f) GSEA plots for AR-regulated genes using the fold-change rank-ordered genes from LNCaP NSD3 knockout (NSD3 KO) vs control cell lines. DEGS, differentially expressed genes (n = 2 biological replicates; GSEA enrichment test). g) Immunoblot of indicated proteins in NSD1 or NSD3-deficient LNCaP cells. h) GSEA net enrichment score (NES) plot of downregulated hallmark pathways in LNCaP NSD1 knocked out (KO) vs wild-type control cells. i) Immunoblot of indicated proteins upon treatment with NSD1 and NSD2-targeting siRNAs (labeled as siNSD1 and siNSD2) independently or in combination in VCaP cells. j) Dependency map (DepMap) plots showing the dependency scores for NSD1, NSD2, NSD3, and POLD2 (positive control; pan-essential gene) across cell lines from distinct originating tissues. The red dotted line indicates pan-essentiality z-score cutoff. Box plot center, median; box, quartiles 1-3; whiskers, quartiles 1-3 ± 1.5 × interquartile range; dot, outliers. Source data
Extended Data Fig. 8
Extended Data Fig. 8. Mechanistic characterization of the NSD1/2 PROTAC degrader LLC0150.
a) Immunoblots of indicated proteins in VCaP and LNCaP cells pre-treated with bortezomib, thalidomide, or VL-285 followed by treatment with LLC0150 at noted concentrations. b) Heatmap of relative abundance of several PWWP-domain-containing and known neo-substrate proteins detected via Tandem Mass Tag (TMT) based quantitative MS upon 12 h treatment with LLC0150 in VCaP cells. c) Genome-wide changes in FOXA1 ChIP-seq peaks in LNCaP cells treated with LLC0150 (2uM for 48 h). d) Immunoblots of noted proteins in whole-cell or chromatin lysates from VCaP and LNCaP cells treated with LLC0150 (2uM) for 24 h. e) Heatmap of z-score normalized expression (qRT-PCR) of AR target genes in LNCaP and VCaP cells treated with LLC0150 followed by DHT stimulation (10 nM for 24 h). Treatment with DHT alone is used as a control. CCS, charcoal-stripped serum. f) Read-density ChIP-seq tracks of AR, FOXA1, and H3K27ac within the TMPRSS2 super-enhancer in LNCaP cells treated with LLC0150 (2uM for 24 h). Super-enhancer cluster is highlighted in a gray box. Source data
Extended Data Fig. 9
Extended Data Fig. 9. Transcriptomic effect and drug synergism of LLC0150 in prostate cancer cells.
a) GSEA plots for E2F, G2M, and apoptosis pathway genes using the fold-change rank-ordered genes from the LLC0150 vs DMSO treated LNCaP (left) or VCaP (right) cell lines. DEGS, differentially expressed genes (n = 2 biological replicates; GSEA enrichment test). b) Immunoblot of noted proteins in LNCaP cells treated with LLC0150 (2uM for 72 h), dead-analog (LLC0150-dead), or the warhead alone (UNC6934). LLC0149 is an independent NSD1/2 PROTAC. c) Dose-response curves of LLC0150 in normal prostate, AR-positive, or AR-negative prostate cancer cell lines at the indicated concentrations for five days. (PrECs, n = 3 biological replicates; others, n = 6 biological replicates). Mean +/- SEM are shown. d) Dose-response curves of LLC0150 and its inactive epimer control (LLC0150-dead) in LAPC4 and VCaP cell lines (n = 6 biological replicates). Mean +/- SEM are shown. e) Percent growth inhibition (Cell-titer Glo) of VCaP cells upon co-treatment with varying concentrations of LLC0150 and enzalutamide for 5 days. f) 3D synergy plots of LLC0150 and enzalutamide co-treated LNCaP and VCaP cells. Red peaks in the 3D plots denote synergy with the average synergy scores noted above. g) Dose-response curves of LLC0150 in LNCaP parental and enzalutamide-resistant cell lines at varying concentrations for five days. Half-maximal inhibitory concentrations (IC50) are noted (n = 5 biological replicates). Mean +/- SEM are shown. Source data
Extended Data Fig. 10
Extended Data Fig. 10. Efficacy assessment of LLC0150 in prostate cancer organoids and xenografts.
a) Representative images of NSD2 IHC in a panel of patient-derived xenografts (PDXs). Scale bar:50 µm. b) Immunoblot of NSD2, AR targets, and histone marks in the LuCaP 23.1 PDX-derived organoid line treated with LLC0150, the NSD1/2 degrader. Total H3 is the loading control. c) Barplots showing relative viability of the PDX-derived organoid lines treated with two doses of LLC0150. In all lines, degradation of NSD1/2 reduces cell viability (n = 6 biological replicates; one-way ANOVA and Tukey’s test). Mean +/- SEM are shown. d) Growth curves (Cell-titer Glo) of two representative AR/NSD2-positive PDX-derived organoid lines treated with DMSO or LLC0150 (n = 6 biological replicates; one-way ANOVA and Tukey’s test). Mean +/- SEM are shown. e) Schematic overview of the LLC0150 intratumoral injection study in a VCaP xenograft model. f) Top: Representative NSD2 and KI67 IHC images in the vehicle and LLC0150-treated tumors. Loss of NSD2 correlates with a reduction in proliferating KI67-positive cells. Bottom: TUNEL assay in the vehicle and LLC0150-treated tumors reveal a high number of apoptotic (TUNEL-positive) cells in the drug-treated tumors.Vehicle, n = 3 tumors; LLC0150, n = 4 tumors. Scale bar: 50 µm. g) Immunoblot of noted proteins in matched tumor lysates from f. Total H3 is used as a loading control. Source data

Update of

References

    1. Heinlein, C. A. & Chang, C. Androgen receptor in prostate cancer. Endocr. Rev.25, 276–308 (2004). - PubMed
    1. Nadal, M. et al. Structure of the homodimeric androgen receptor ligand-binding domain. Nat. Commun.8, 14388 (2017). - PMC - PubMed
    1. Shaffer, P. L., Jivan, A., Dollins, D. E., Claessens, F. & Gewirth, D. T. Structural basis of androgen receptor binding to selective androgen response elements. Proc. Natl Acad. Sci. USA101, 4758–4763 (2004). - PMC - PubMed
    1. Mills, I. G. Maintaining and reprogramming genomic androgen receptor activity in prostate cancer. Nat. Rev. Cancer14, 187–198 (2014). - PubMed
    1. Pomerantz, M. M. et al. The androgen receptor cistrome is extensively reprogrammed in human prostate tumorigenesis. Nat. Genet.47, 1346–1351 (2015). - PMC - PubMed