

Genome-wide association study meta-analysis of neurofilament light (NfL) levels in blood reveals novel loci related to neurodegeneration
- PMID: 39251807
- PMCID: PMC11385583
- DOI: 10.1038/s42003-024-06804-3
Genome-wide association study meta-analysis of neurofilament light (NfL) levels in blood reveals novel loci related to neurodegeneration
Abstract
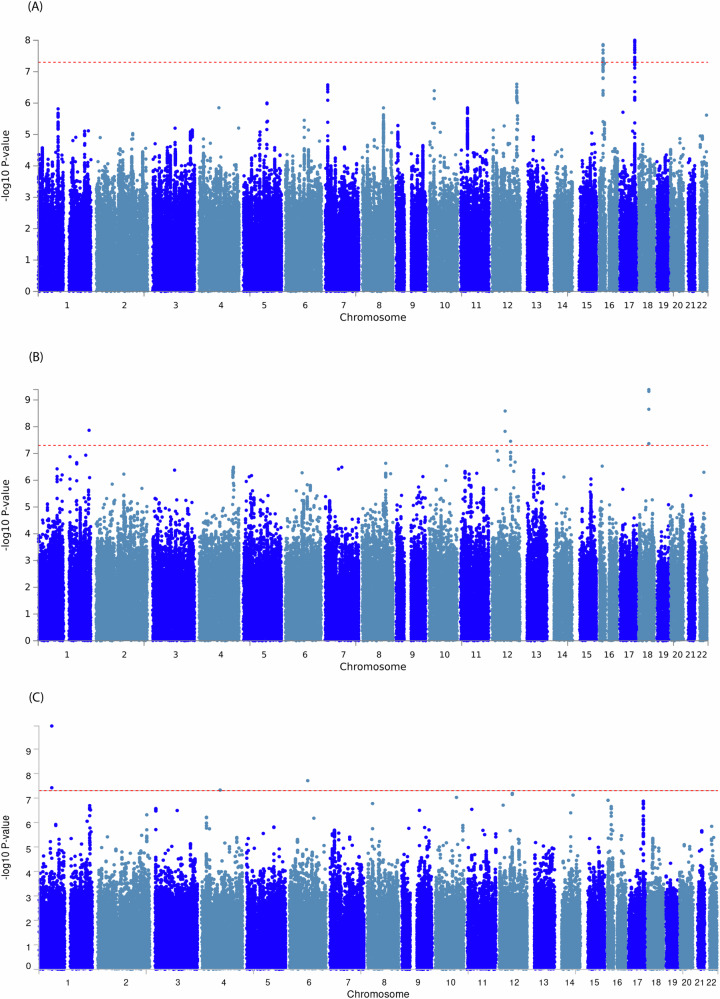
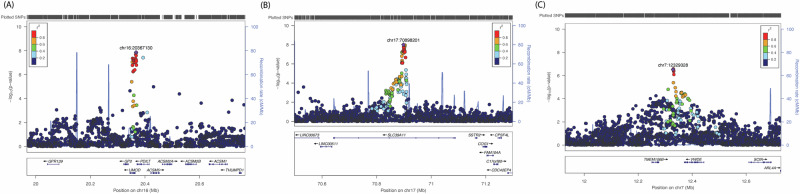
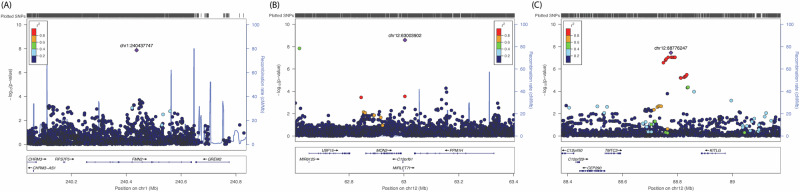
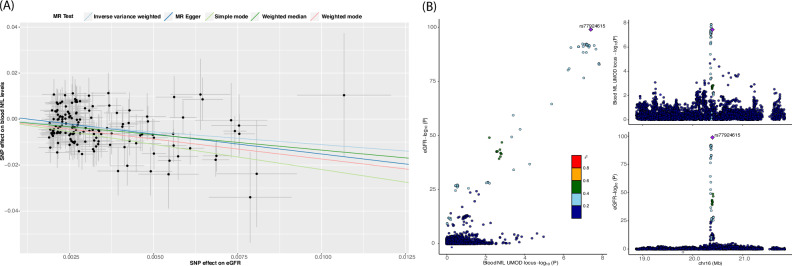
Neurofilament light chain (NfL) levels in circulation have been established as a sensitive biomarker of neuro-axonal damage across a range of neurodegenerative disorders. Elucidation of the genetic architecture of blood NfL levels could provide new insights into molecular mechanisms underlying neurodegenerative disorders. In this meta-analysis of genome-wide association studies (GWAS) of blood NfL levels from eleven cohorts of European ancestry, we identify two genome-wide significant loci at 16p12 (UMOD) and 17q24 (SLC39A11). We observe association of three loci at 1q43 (FMN2), 12q14, and 12q21 with blood NfL levels in the meta-analysis of African-American ancestry. In the trans-ethnic meta-analysis, we identify three additional genome-wide significant loci at 1p32 (FGGY), 6q14 (TBX18), and 4q21. In the post-GWAS analyses, we observe the association of higher NfL polygenic risk score with increased plasma levels of total-tau, Aβ-40, Aβ-42, and higher incidence of Alzheimer's disease in the Rotterdam Study. Furthermore, Mendelian randomization analysis results suggest that a lower kidney function could cause higher blood NfL levels. This study uncovers multiple genetic loci of blood NfL levels, highlighting the genes related to molecular mechanism of neurodegeneration.
© 2024. The Author(s).
Conflict of interest statement
The authors declare no competing interests.
Figures
References
Publication types
MeSH terms
Substances
Grants and funding
- RF1 AG059421/AG/NIA NIH HHS/United States
- U01 HL130114/HL/NHLBI NIH HHS/United States
- R01 HL086694/HL/NHLBI NIH HHS/United States
- R01 HL093029/HL/NHLBI NIH HHS/United States
- R01 HL105756/HL/NHLBI NIH HHS/United States
- N01 HC055222/HL/NHLBI NIH HHS/United States
- HHSN268201500001I/HL/NHLBI NIH HHS/United States
- K24 AG046373/AG/NIA NIH HHS/United States
- N01 HC085081/HL/NHLBI NIH HHS/United States
- R01 HL103612/HL/NHLBI NIH HHS/United States
- N01 HC085080/HL/NHLBI NIH HHS/United States
- UH3 NS100605/NS/NINDS NIH HHS/United States
- U01 HL096812/HL/NHLBI NIH HHS/United States
- UF1 NS125513/NS/NINDS NIH HHS/United States
- U01 HG004446/HG/NHGRI NIH HHS/United States
- R01 AG054076/AG/NIA NIH HHS/United States
- R01 HL120393/HL/NHLBI NIH HHS/United States
- UL1 RR025005/RR/NCRR NIH HHS/United States
- U01 HL080295/HL/NHLBI NIH HHS/United States
- HHSN268201800004I/HL/NHLBI NIH HHS/United States
- 75N92022D00002/HL/NHLBI NIH HHS/United States
- HHSN268201500001C/HL/NHLBI NIH HHS/United States
- N01 HC085082/HL/NHLBI NIH HHS/United States
- U01 HL096917/HL/NHLBI NIH HHS/United States
- N01 HC085086/HL/NHLBI NIH HHS/United States
- N01 HC085083/HL/NHLBI NIH HHS/United States
- U01 HL096902/HL/NHLBI NIH HHS/United States
- R01 HL087652/HL/NHLBI NIH HHS/United States
- U01 HG004402/HG/NHGRI NIH HHS/United States
- U01 HG004424/HG/NHGRI NIH HHS/United States
- R01 AG049607/AG/NIA NIH HHS/United States
- 75N92022D00004/HL/NHLBI NIH HHS/United States
- U01 HG004729/HG/NHGRI NIH HHS/United States
- HHSN268201800003I/HL/NHLBI NIH HHS/United States
- P30 DK063491/DK/NIDDK NIH HHS/United States
- R03 AG065643/AG/NIA NIH HHS/United States
- HHSN268201800007I/HL/NHLBI NIH HHS/United States
- R01 AG008122/AG/NIA NIH HHS/United States
- R01 AG053325/AG/NIA NIH HHS/United States
- HHSN268201200036C/HL/NHLBI NIH HHS/United States
- HHSN268201800001C/HL/NHLBI NIH HHS/United States
- P30 AG066530/AG/NIA NIH HHS/United States
- N01 HC025195/HL/NHLBI NIH HHS/United States
- R01 AG033193/AG/NIA NIH HHS/United States
- N01 HC085079/HL/NHLBI NIH HHS/United States
- U01 HL096814/HL/NHLBI NIH HHS/United States
- P30 AG066546/AG/NIA NIH HHS/United States
- R01 AG033040/AG/NIA NIH HHS/United States
- R01 AG076838/AG/NIA NIH HHS/United States
- 75N92022D00003/HL/NHLBI NIH HHS/United States
- U01 AG052409/AG/NIA NIH HHS/United States
- 75N92022D00005/HL/NHLBI NIH HHS/United States
- K01 AG063805/AG/NIA NIH HHS/United States
- U01 HL096899/HL/NHLBI NIH HHS/United States
- K24 AG065525/AG/NIA NIH HHS/United States
- R01 AG023629/AG/NIA NIH HHS/United States
- R01 HL087641/HL/NHLBI NIH HHS/United States
- UL1 TR001881/TR/NCATS NIH HHS/United States
- N01 HC065226/HL/NHLBI NIH HHS/United States
- HHSN268201800005I/HL/NHLBI NIH HHS/United States
- 75N92022D00001/HL/NHLBI NIH HHS/United States
- HHSN268201800006I/HL/NHLBI NIH HHS/United States
- R01 AG050595/AG/NIA NIH HHS/United States
- U01 AG049505/AG/NIA NIH HHS/United States
LinkOut - more resources
Full Text Sources
Medical
Miscellaneous
