. 2024 Oct;43(43):3151-3169.
doi: 10.1038/s41388-024-03156-4. Epub 2024 Sep 9.

ALDH1A3 is the switch that determines the balance of ALDH+ and CD24-CD44+ cancer stem cells, EMT-MET, and glucose metabolism in breast cancer

Affiliations

ALDH1A3 is the switch that determines the balance of ALDH+ and CD24-CD44+ cancer stem cells, EMT-MET, and glucose metabolism in breast cancer

Wasundara Fernando et al. Oncogene. 2024 Oct.

Abstract

Plasticity is an inherent feature of cancer stem cells (CSCs) and regulates the balance of key processes required at different stages of breast cancer progression, including epithelial-to-mesenchymal transition (EMT) versus mesenchymal-to-epithelial transition (MET), and glycolysis versus oxidative phosphorylation. Understanding the key factors that regulate the switch between these processes could lead to novel therapeutic strategies that limit tumor progression. We found that aldehyde dehydrogenase 1A3 (ALDH1A3) regulates these cancer-promoting processes and the abundance of the two distinct breast CSC populations defined by high ALDH activity and CD24-CD44+ cell surface expression. While ALDH1A3 increases ALDH+ breast cancer cells, it inversely suppresses the CD24-CD44+ population by retinoic acid signaling-mediated gene expression changes. This switch in CSC populations induced by ALDH1A3 was paired with decreased migration but increased invasion and an intermediate EMT phenotype. We also demonstrate that ALDH1A3 increases oxidative phosphorylation and decreases glycolysis and reactive oxygen species (ROS). The effects of ALDH1A3 reduction were countered with the glycolysis inhibitor 2-deoxy-D-glucose (2DG). In cell culture and tumor xenograft models, 2DG suppresses the increase in the CD24-CD44+ population and ROS induced by ALDH1A3 knockdown. Combined inhibition of ALDH1A3 and glycolysis best reduces breast tumor growth and tumor-initiating cells, suggesting that the combination of targeting ALDH1A3 and glycolysis has therapeutic potential for limiting CSCs and tumor progression. Together, these findings identify ALDH1A3 as a key regulator of processes required for breast cancer progression and depletion of ALDH1A3 makes breast cancer cells more susceptible to glycolysis inhibition.


Conflict of interest statement

The authors declare no competing interests.

Figures
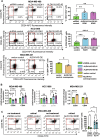
Fig. 1
Fig. 1. ALDH1A3 and retinal suppress the CD24CD44+ cell population in triple-negative breast cancer cells by inducing gene expression changes.
A The percentage of CD24CD44+ cells in MDA-MB-468 and HCC1806 cells, with or without knockdown of ALDH1A3 (by two different shRNA sequences) or in MDA-MB-231 cells with or without ALHD1A3 overexpression is determined by flow cytometry analysis of cell stained with anti-CD24-APC conjugated and anti-CD44-PE conjugated antibody. The bar graphs show the average different biological replicates (6n, MDA-MB-468; 7n HCC1806; and 3n, MDA-MB-231 cells). B The effect of ALDH1A3 knockdown or overexpression on the relative mRNA transcript levels of CD24 and CD44 is determined by real-time quantitative polymerase chain reaction (RT-qPCR), relative to two reference genes and the control in MDA-MB-468, HCC1806, and MDA-MB-231 cells (n = 8, 8 and 6, respectively). C The effect of 24 h 100 nM retinal treatment in MDA-MB-468 cells, with or without ALDH1A3 knockdown, on the percentage of CD24CD44+ cells is determined by flow cytometry analysis of cells stained with anti-CD24-FITC conjugated and anti-CD44-PE conjugated antibody (n = 4). AC The error bars equal standard deviation and significance determined by one-way Anova (A, B) and two-way Anova in (C) and followed by multiple comparison post-tests (p-value < 0.05 = *, <0.01 = **, <0.001 = ***, <0.0001 = ****, ns = not significant).
Fig. 2
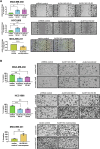
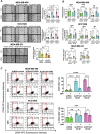
Fig. 2. ALDH1A3 inhibits migration but increases invasion in triple-negative breast cancer cell lines.
A The migration capacity of MDA-MB-468 and HCC1806 cells, with or without knockdown of ALDH1A3 (by two different shRNA sequences) or in MDA-MB-231 cells with or without ALHD1A3 overexpression is determined by gap-closure assays. The images are representative of one of the biological replicates and the bar graphs show the average different biological replicates (4n, MDA-MB-468; 3n, HCC1806; and 6n, MDA-MB-231 cells). B The invasive capacity of MDA-MB-468 and HCC1806 cells, with or without knockdown of ALDH1A3 (by two different shRNA sequences) or in MDA-MB-231 cells with or without ALHD1A3 overexpression is determined by trans-well invasion assay where the % of migrated cells in the uncoated well is divided the % of migrated cells in the coated well for each biological replicate and made relative to the control cells. The images are representative of one of the biological replicates and the bar graphs show the average different biological replicates (3n). A, B The error bars equal standard deviation and significance determined by one-way ANOVA, followed by multiple comparison post-tests (p-value < 0.05 = *, <0.01 = **, <0.001 = ***, ns = not significant).
Fig. 3
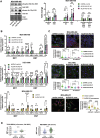
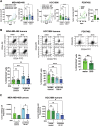
Fig. 3. ALDH1A3 increases alters FAK and Src levels and ratios of phosphorylated FAK and Src, increases E-cadherin and decreases N-cadherin by immunofluorescence, and alters expression of MET and EMT genes and the EMT score.
A The effect of ALDH1A3 knockdown or overexpression on the protein levels of phosphorylated (Tyr 397) and total focal adhesion kinase (FAK) and phosphorylated (Try 416) and total Src in MDA-MB-468 cells quantified by western blotting (7n with phospho antibodies, 9n for total FAK antibody, and 10n for total Src antibody). The bar graphs summarize the image band quantification of individual biological replicates relative to the total protein and the control and the ratio of phosphorylated FAK or Src versus total FAK or Src for 7 complete sets. B The effect of ALDH1A3 knockdown or overexpression on the relative mRNA transcript levels of mesenchymal-epithelial-transition (MET) genes CDH1, CLDN1, CLDN2, OCLN, and epithelial-mesenchymal-transition (EMT) genes CDH2, MMP2, SNAI2, TWIST, and VIM is determined by quantitative polymerase chain reaction (RT-qPCR), relative to two reference genes and the control in MDA-MB-468 (6n), HCC1806 (6n), and MDA-MB-231 cells (4–10n). C The effect of ALDH1A3 knockdown or overexpression on E-cadherin and N-cadherin in MDA-MB-468, HCC1806, and MDA-MB-231 cells is visualized in immunofluorescence images and fluorescence intensity of the protein staining in >200 cells per conditions is quantified. The line in the dot plots indicates the mean. AC Significance determined by one-way ANOVA followed by multiple comparison post-tests and p-value < 0.05 = *, <0.01 = **, <0.001 = ***, <0.0001 = ****, ns = not significant. Error bars represent standard deviation. D The EMT score is calculated for individual patient tumors using expression data available for TCGA BRCA (Cell 2015) and METABRIC datasets. Patient tumors are grouped as either low or high ALDH1A3 based on the ranking of being in the bottom third for ALDH1A expression or the top third of all breast cancer patients within the dataset. The line represents the mean. Significance determined by unpaired t-test.
Fig. 4
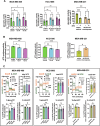
Fig. 4. ALDH1A3 decreases glycolytic activity, increases ATP synthase activity, and in MDA-MB-468 cells suppresses ATP production from glycoATP and increases mitoATP.
A The glycolytic activity of MDA-MB-468 and HCC1806 cells, with or without knockdown of ALDH1A3 (by two different shRNA sequences) or in MDA-MB-231 cells, with or without ALHD1A3 overexpression is determined by a fluorescent Glycolysis Assay with a plate reader (n = 3). As a control, treatment of the cells 5 mM of the the glycolysis inhibitor 2-deoxy-D-glucose (2DG) is included. B The ATP synthase activity of lysates of MDA-MB-468 and HCC1806 cells, with or without knockdown of ALDH1A3 (by two different shRNA sequences, n = 3) or in MDA-MB-231 cells with or without ALHD1A3 overexpression is determined by microplate assays (n = 5). C The live cell Seahorse ATP rate assay is conducted for MDA-MB-468 and HCC1806 cells, with or without knockdown of ALDH1A3 (by two different shRNA sequences) or in MDA-MB-231 cells with or without ALHD1A3 overexpression. The EACR and OCR plots are shown, along with the total ATP production rate and relative ATP production rate from glycoATP (glycolysis) and mitoATP (oxidative phosphorylation) bar graphs (n = 4). AC The error bars equal standard deviation and significance determined by two-way ANOVA in (A) and one-way ANOVA in (B, C) for MDA-MB-468 and HCC1806 cells, followed by multiple comparison post-tests. For MDA-MB-231 cells in (B, C), we performed t-tests. Significance is indicated as follows: p-value < 0.05 = *, <0.01 = **, <0.001 = ***, ns = not significant.
Fig. 5
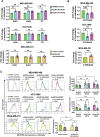
Fig. 5. ALDH1A3 suppresses expression of glycolysis genes in MDA-MB-468 cells and increases expression of ATP synthase gene and ROS levels in triple-negative breast cancer cells.
A, B The effect of ALDH1A3 knockdown or overexpression on the relative mRNA transcript levels of ENO1, ENO2, and TPI (A) and ATP6V04A (B) is determined by real-time quantitative polymerase chain reaction (RT-qPCR), relative to two reference genes and the control in MDA-MB-468 (n = 4), HCC1806 (n = 4), and MDA-MB-231 (n = 9 in A, n = 6 in B) cells. C The effect of ALDH1A3 knockdown or overexpression or 48 h 5 mM 2-deoxy-D-glucose (2DG, n = 3) on reactive oxygen species (ROS) is quantified by flow cytometry analysis of dichlorodihydrofluorescein diacetate (H2DCFDA) stained cells (n = 7 for MDA-MB-468 cells, n = 5 for HCC1806 cells, and n = 3 for MDA-MB-231 cells). Representative experiments are shown for each cell line and the bar graph summarizes the results of individual biological replicates. AC The error bars equal standard deviation and significance determined by one-way ANOVA (or t-test for MDA-MB-231 cells) in (A, B) and two-way ANOVA in (C), followed by multiple comparison post-tests (p-value < 0.05 = *, <0.01 = **, <0.001 = ***, ns not significant).
Fig. 6
Fig. 6. 2DG inhibits the increased migration, effects on EMT/MET gene expression, and increased CD24CD44+ population induced by reduced ALDH1A3 levels in triple-negative breast cancer cells.
A The effect of 48 h 5 mM treatment with 2-deoxy-D-glucose (2DG) on the migration capacity of MDA-MB-468 (n = 5) and HCC1806 cells (n = 5), with or without knockdown of ALDH1A3 (by two different shRNA sequences) or in MDA-MB-231 cells (n = 6), with or without ALHD1A3 overexpression is determined by gap-closure assays. The images are representative of one of the biological replicates and the bar graphs show the average different biological replicates. B The effect of 48 h 5 mM 2DG on the relative mRNA expression CDH1, CDH2, and vimentin in MDA-MB-468 (n = 5) and HCC1806 cells (n = 6), with or without knockdown of ALDH1A3 (by two different shRNA sequences) or in MDA-MB-231 cells (n = 3 for CDH1, n = 4 for CDH2) is determined by real-time quantitative polymerase chain reaction (RT-qPCR), relative to two reference genes and the control in MDA-MB-468, HCC1806, and MDA-MB-231 cells. C The effect of 48 h 5 mM 2DG treatment of MDA-MB-468 cells and HCC1806 cells, with or without ALDH1A3 knockdown (n = 3), on the percentage of CD24CD44+ cells is determined by flow cytometry analysis of cell stained with anti-CD24-APC conjugated and anti-CD44-PE conjugated antibody. AC The error bars equal standard deviation and significance determined by two-way ANOVA, followed by multiple comparison post-tests (p-value < 0.05 = *, <0.01 = **, <0.001 = ***, <0.0001 = ****, ns = not significant).
Fig. 7
Fig. 7. 2DG and ALDH1A3 knockdown in triple-negative breast tumor xenografts alters tumor growth, the percentage of CD24CD44+ cells, and the frequency of tumor-initiating cells.
A MDA-MB-468 (n = 10-11) and HCC1806 (n = 10-11) tumor growth in NOD/SCID female mice, with or without ALDH1A3 knockdown, or PDX7482 (n = 12) and treatment with water or 0.4% w/v 2-deoxy-D-glucose (2DG) started when tumors are palpable (indicated with the arrow) in the tumor volume plot, which show weekly caliper measurements. (length X width X width /2). The data points (day versus tumor volume measurements) are graphed with a non-linear regression curve of best fit. The bar graphs show the final tumor weights from harvested tumors at experiment termination. B The harvested tumors from (A), are analyzed for percentages of CD24CD44+ cells by flow cytometry analysis of single-cell suspensions post lysing or red blood cells and staining with anti-CD44-PE and anti-CD24-APC antibody. Staining with Fluor-488 conjugated anti-H2Kd antibody was used to eliminate mouse cells from the analysis. C The harvested tumors from (A) were analyzed for tumor-initiating cell frequency by performing a limiting dilution assay were increasing numbers of live cells isolated from three (or two for MDA-MB-468 control tumors treated with 2DG) harvested tumors were injected into the mammary fat pads of 4–6 mice and scored for tumor development (as detailed in Supplemental Tables S2 and S3). AC The error bars equal standard deviation and significance determined by one-way ANOVA followed by multiple comparison post-tests (except the MDA-MB-468 experiment in C, where we just performed a t-test between the ALDH1A3 KD water versus 2DG treatment groups). The p-values are indicated as follows: <0.05 = *, <0.01 = **, <0.001 = ***, <0.0001 = ****, ns = not significant.

References

    1. Frank NY, Frank MH. Cancer stem cells. Access Sci. 2024. 10.1036/1097-8542.105740.
    1. Walsh HR, Cruickshank BM, Brown JM, Marcato P. The flick of a switch: conferring survival advantage to breast cancer stem cells through metabolic plasticity. Front Oncol. 2019. 10.3389/fonc.2019.00753. - PMC - PubMed
    1. Sarmiento-Castro A, Caamaño-Gutiérrez E, Sims AH, Hull NJ, James MI, Santiago-Gómez A, et al. Increased expression of interleukin-1 receptor characterizes anti-estrogen-resistant ALDH+ breast cancer stem cells. Stem Cell Rep. 2020;15:307–16. - PMC - PubMed
    1. Sampieri K, Fodde R. Cancer stem cells and metastasis. Semin Cancer Biol. 2012;22:187–93. - PubMed
    1. Murayama T, Gotoh N. Drug resistance mechanisms of cancer stem-like cells and their therapeutic potential as drug targets. Cancer Drug Resist. 2019;2:457–70. - PMC - PubMed

MeSH terms

LinkOut - more resources