. 2024 Oct;27(10):1934-1944.
doi: 10.1038/s41593-024-01749-6. Epub 2024 Sep 9.

Oligodendroglial fatty acid metabolism as a central nervous system energy reserve

Affiliations

Oligodendroglial fatty acid metabolism as a central nervous system energy reserve

Ebrahim Asadollahi et al. Nat Neurosci. 2024 Oct.

Erratum in

Abstract

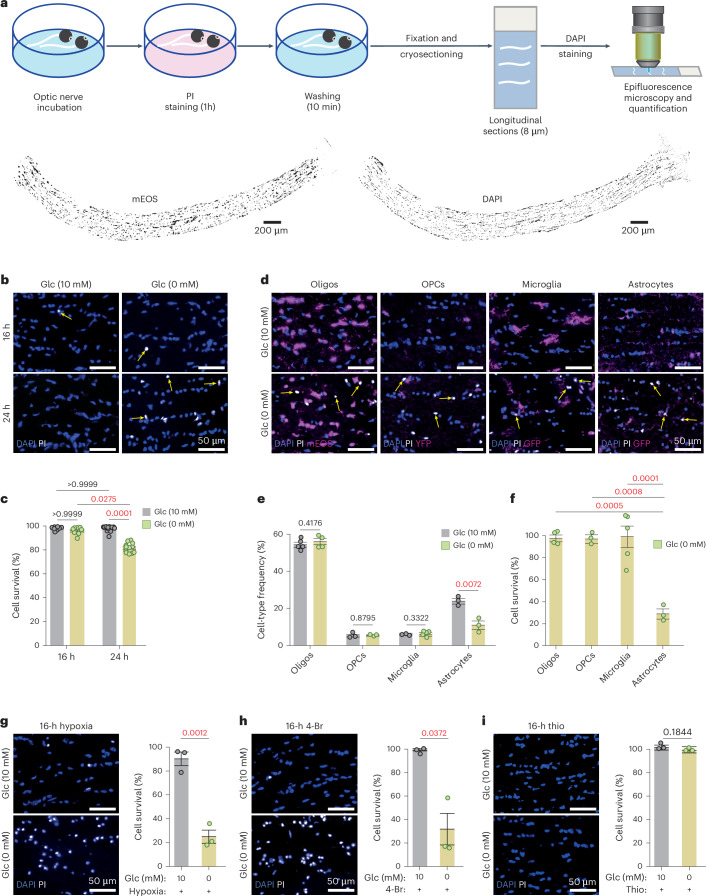
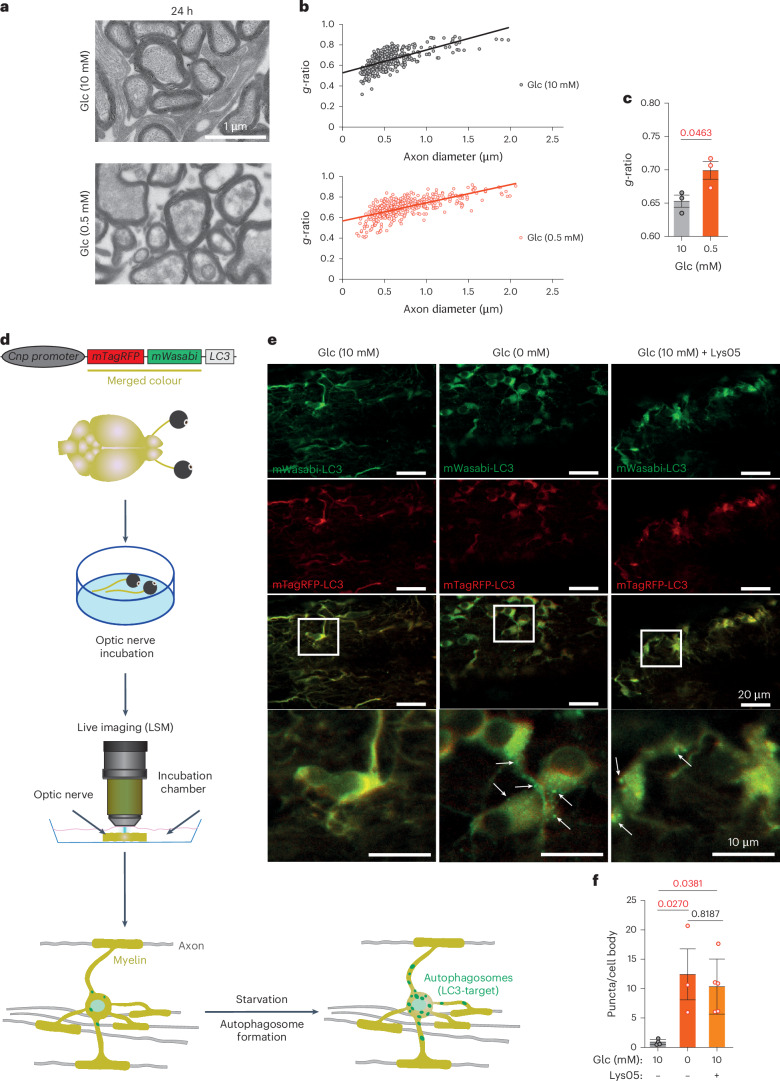
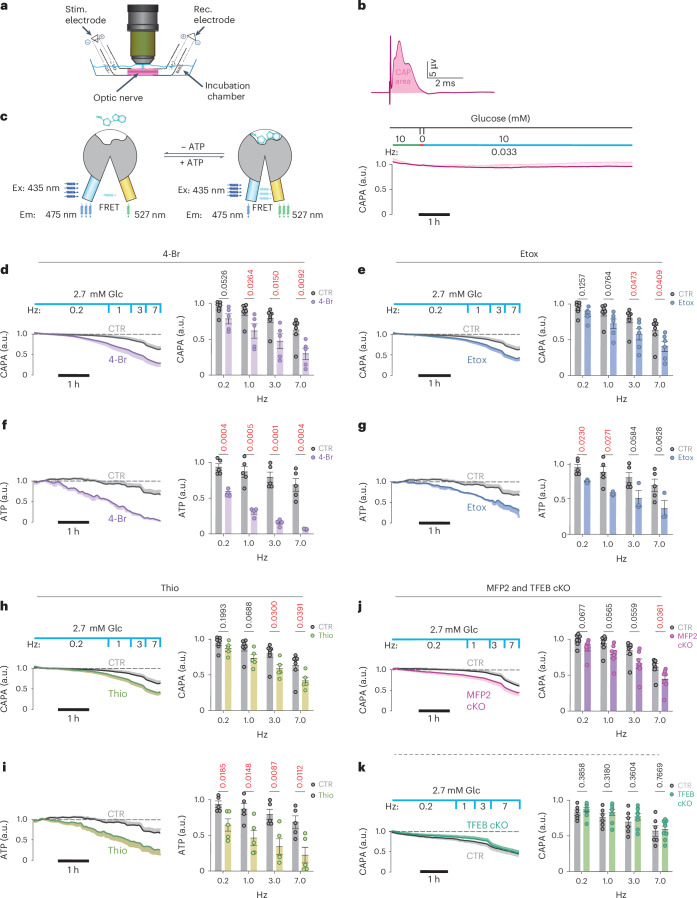
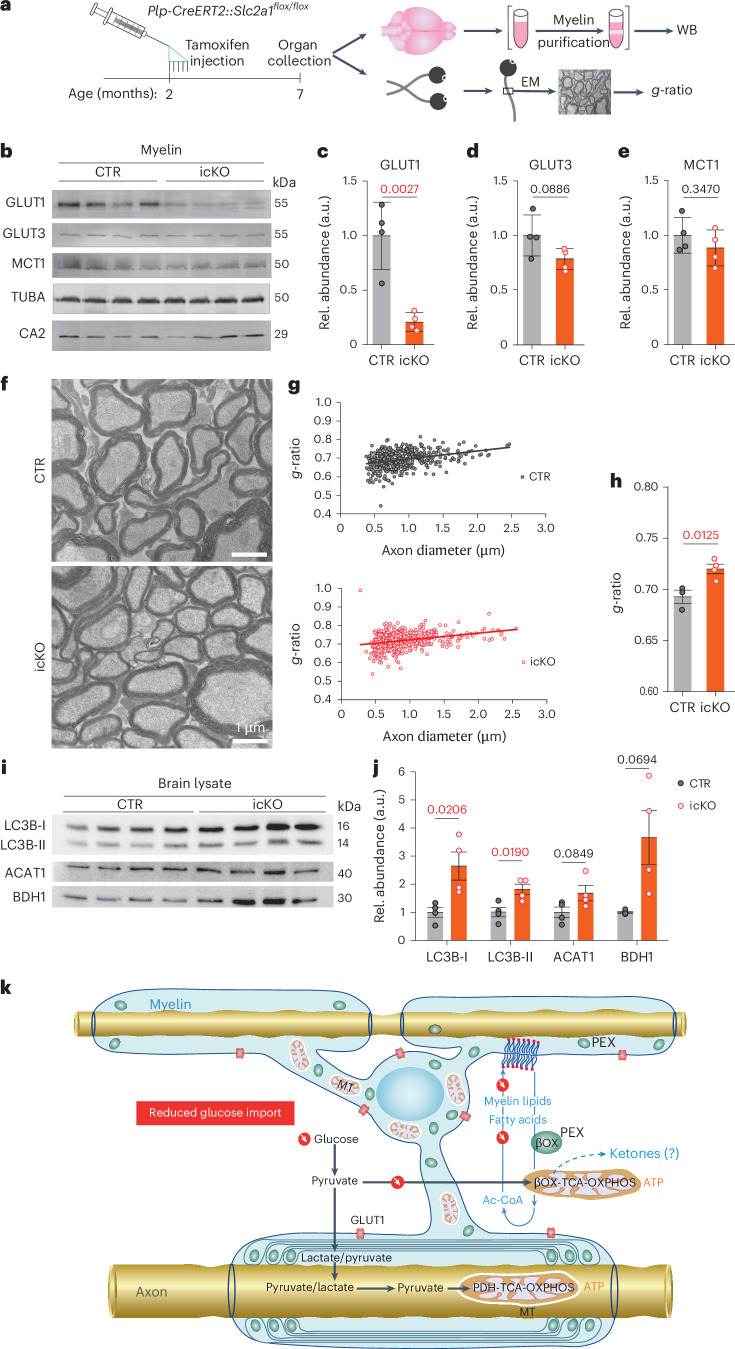
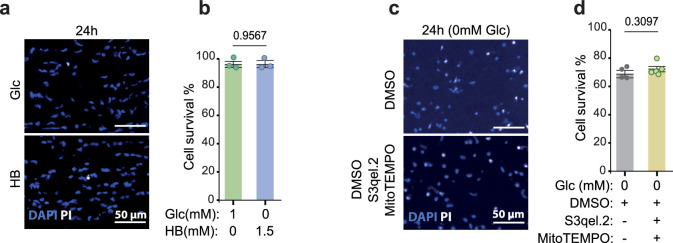
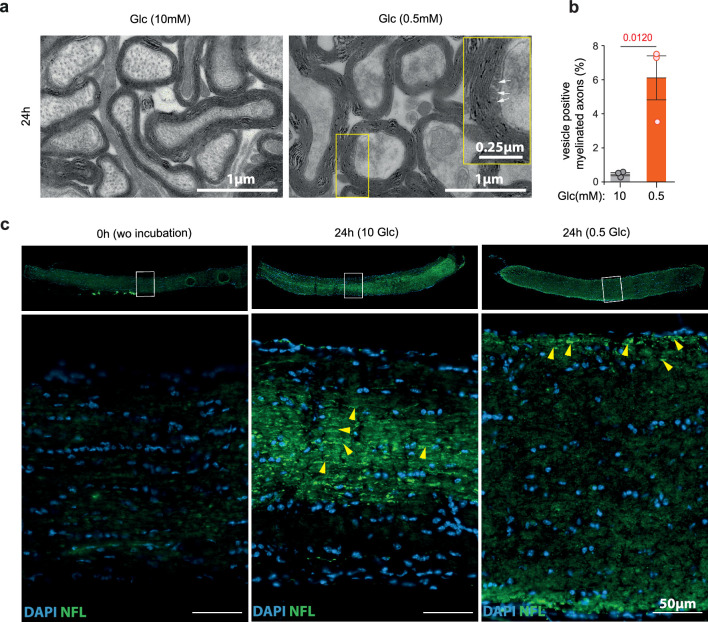
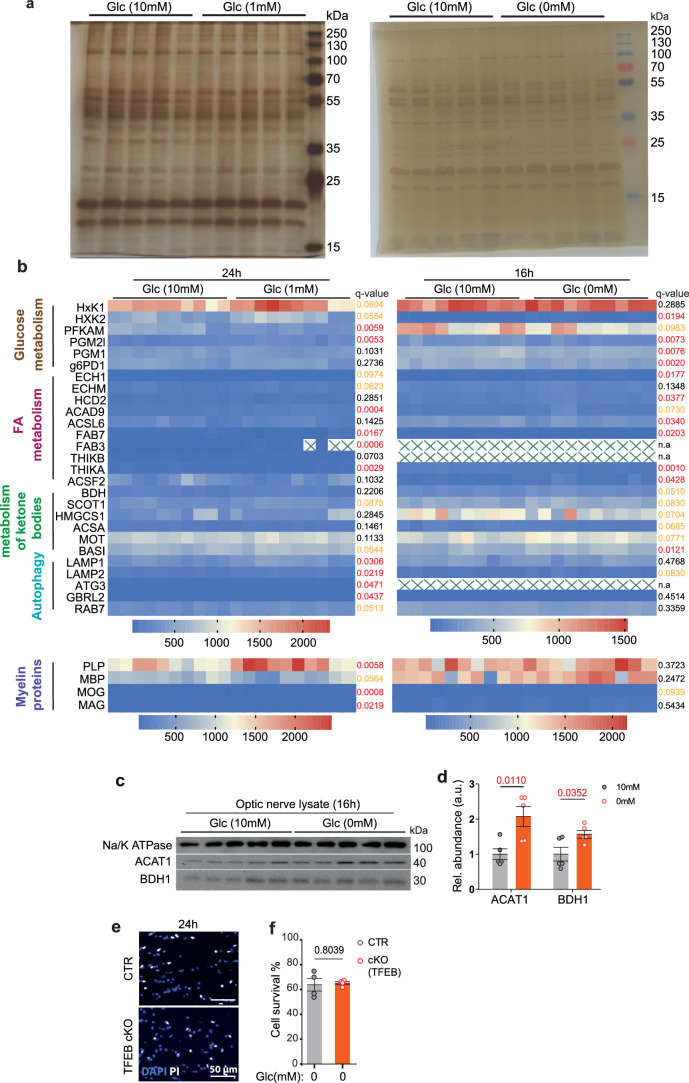
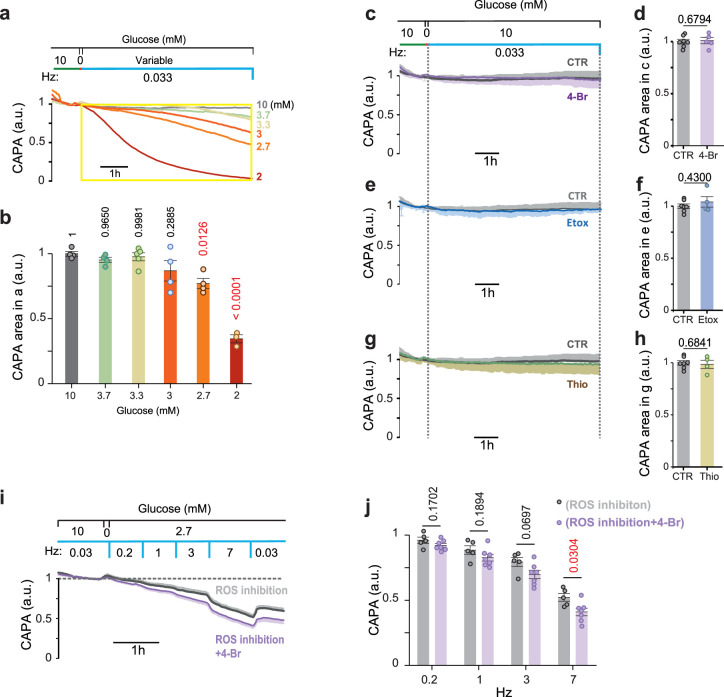
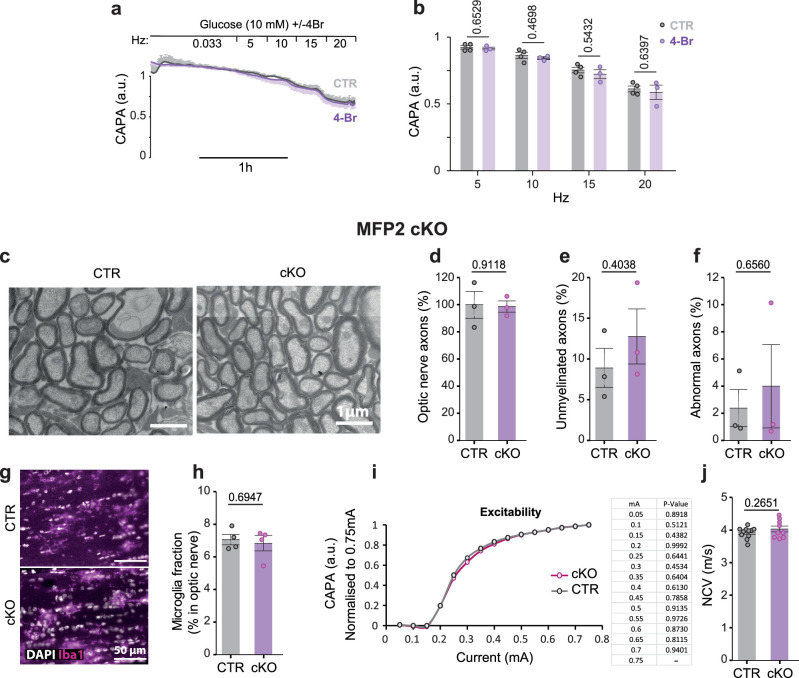
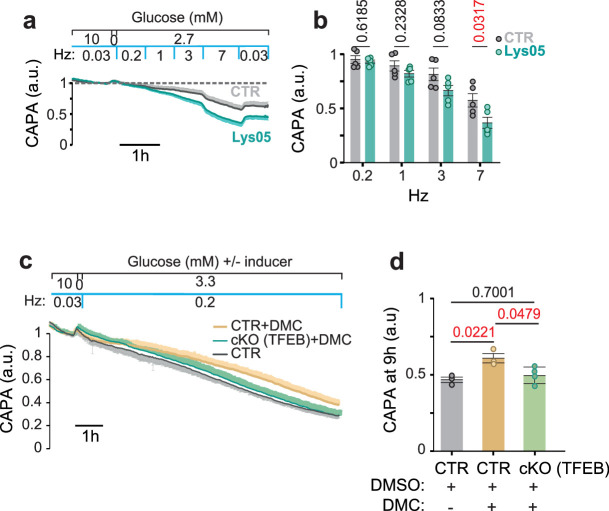
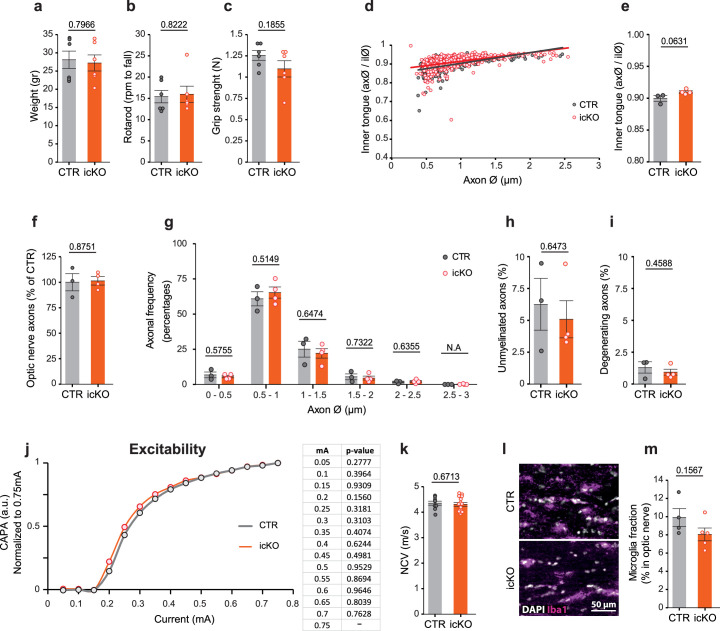
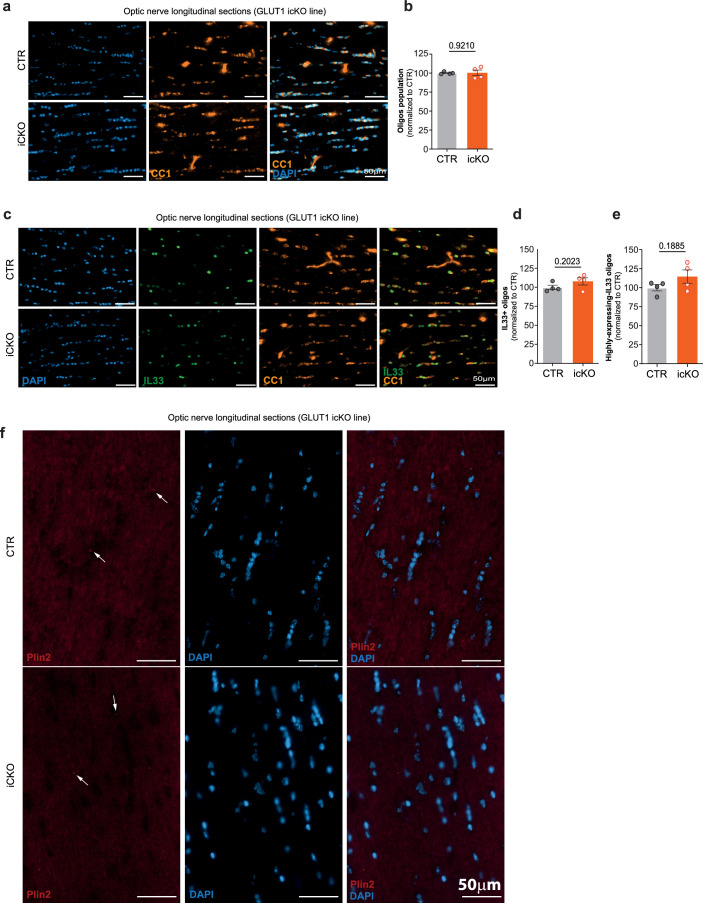
Brain function requires a constant supply of glucose. However, the brain has no known energy stores, except for glycogen granules in astrocytes. In the present study, we report that continuous oligodendroglial lipid metabolism provides an energy reserve in white matter tracts. In the isolated optic nerve from young adult mice of both sexes, oligodendrocytes survive glucose deprivation better than astrocytes. Under low glucose, both axonal ATP levels and action potentials become dependent on fatty acid β-oxidation. Importantly, ongoing oligodendroglial lipid degradation feeds rapidly into white matter energy metabolism. Although not supporting high-frequency spiking, fatty acid β-oxidation in mitochondria and oligodendroglial peroxisomes protects axons from conduction blocks when glucose is limiting. Disruption of the glucose transporter GLUT1 expression in oligodendrocytes of adult mice perturbs myelin homeostasis in vivo and causes gradual demyelination without behavioral signs. This further suggests that the imbalance of myelin synthesis and degradation can underlie myelin thinning in aging and disease.


Conflict of interest statement

A.B. is cofounder and shareholder of Casma Therapeutics and an advisory board member of Avilar Therapeutics and Amplify Therapeutics. The other authors declare no competing interests.

Figures

Fig. 1
Fig. 1. Optic nerve glial cell survival under glucose deprivation requires FA utilization.
a, Schematic representation of the experimental pipeline. Below, myelinated optic nerves from Cnp-mEOS reporter mice, maintained ex vivo (n = 5). Left, longitudinal section showing mEOS+ oligodendrocytes (black on white). Right, all DAPI+ cell nuclei (black on white). b, Higher magnification of DAPI+ (blue) optic nerve glia and PI+ (white) dying cells (arrows). Left, cells surviving in 10 mM glucose (Glc). Right, without glucose, cells surviving up to 16 h, but many dying after 24 h (quantified in c). c, Cell survival quantified by subtracting (PI+DAPI+) dying cells from total (DAPI+) cells including data from df (16 h: N = n = 8; 24 h: N = n = 12; mean ± s.e.m., Kruskal–Wallis test, Dunn’s multiple comparison). d, Different vulnerabilities of glial subtypes to 24-h glucose withdrawal. Optic nerve longitudinal sections are labeled by DAPI (all cells), PI (dying cells) and genetically expressed cell-specific markers (oligodendrocytes: Cnp-PTS1-mEOS; OPCs: Ng2-YFP; microglia: Cxcr1-GFP; astrocytes: Aldh1l1-GFP). Note the shrunken cell nuclei in glucose-free medium and lack of overlap between oligodendrocytes and dying cells. e, Frequency of glial subtypes after 24-h incubation in 10 mM or 0 mM glucose (oligodendrocytes: 10 mM, N = n = 5; 0 mM, N = n = 4; microglia: 10 mM, N = n = 3; 0 mM, N = n = 5; OPCs and astrocytes: N = n = 3, both) with data from d. f, Survival rate of glial subtypes after 24 h in 10 mM or 0 mM glucose, normalized to cells in glucose-containing aCSF (100%) with data from e (mean ± s.e.m., one-way ANOVA, Tukey’s multiple comparison). g, Glial cells that survive 16-h glucose deprivation dying under hypoxia (bottom), demonstrating oxidation of an endogenous energy reserve other than glucose (N = n = 3, each). h, 4-Br (a mitochondrial β-oxidation inhibitor) treatment of glucose-deprived optic nerves causing widespread cell death, demonstrating FAs as an energy reserve (N = n = 3). Note that 4-Br is not cytotoxic by itself (mean ± s.e.m., unpaired, two-tailed Student’s t-test, heteroscedastic). i, Thio (a peroxisomal β-oxidation inhibitor) treatment not increasing glial death which indicates mitochondrial β-oxidation sufficient for glial survival (N = n = 3). Animals, both sexes, are aged 2 months. Percentages (in gi) were calculated relative to overall survival for 16 h with glucose under normoxia (in c). N, individual optic nerves; n, independent experiments. Error bars in e, g and i: mean ± s.e.m., unpaired, two-tailed Student’s t-test. Source data
Fig. 2
Fig. 2. Glucose deprivation of the optic nerve induces autophagy and loss of myelin integrity.
a, Electron microscopic images of optic nerve cross-sections (wild-type mice aged 2 months), taken after 24 h of incubation in medium with 10 mM glucose (top: N = n = 3) or 0.5 mM glucose (bottom: N = n = 3). b, Scatter plot of calculated g-ratios (outer fiber diameter/axon diameter) as a function of axon caliber, revealing myelin loss when optic nerves are exposed to low glucose (red dots, bottom) compared with 10 mM glucose-containing medium (black dots, top). c, Bar graph with calculated mean g-ratios (same data as in b) (N = n = 3 for both 0 mM and 10 mM; error bars: mean ± s.e.m.; unpaired, two-tailed Student’s t-test). d, Schematic depiction of the pCNP-mTagRFP-mWasabi-LC3 transgene used for oligodendrocyte-specific expression of the LC3 fusion protein. The two fluorophores (red and green) give LC3 a yellow color and reveal diffuse cellular distribution. Note that mTagRFP-mWasabi-LC3 becomes an autophagosome-specific marker, when LC3 is translocated to the membrane of newly formed autophagophore/autophagosomes (green puncta). e, Live imaging of optic nerves (ex vivo) from a mTagRFP-mWasabi-LC3 transgenic mouse, incubated in aCSF with 10 mM (left) or 0 mM (middle) glucose. Note the ubiquitous expression of the LC3 fusion protein. Specific labeling of autophagosomes (green puncta, arrows on image inset) occurs only in the absence of glucose with an all-or-none difference. Right, the accumulation of autophagosomes also in oligodendrocytes in the presence of 10 mM glucose (Glc) after applying the specific inhibitor, Lys05 (10 µM). f, Quantification of the data in e, normalized to the number of cell bodies (adult mice, aged 2–5 months; N = n = 4 for 10 mM Glc, N = n = 5 for 10 mM Glc + Lys05 and N = n = 3 for 0 mM Glc; error bars: mean ± s.e.m.; one-way ANOVA, Tukey’s test). Source data
Fig. 3
Fig. 3. FA β-oxidation in oligodendrocytes supports axonal energy metabolism and function.
a, Stimulating (Stim.) and recording (Rec.) CAPs from isolated optic nerves and monitoring axonal ATP by ratiometric FRET analysis. b, Top, typical CAP at 10 mM glucose with the CAPA shaded in red below. Bottom, recording of a stable CAPA, normalized to 1.0 (at 10 mM glucose, normoxia, low spiking rate (1 per 30 s)). Note a 5-min glucose withdrawal step to deplete astroglial glycogen. a.u., arbitrary units. c, Ratiometric FRET analysis using transgenically expressed ATP sensor ATeam1.03YEMK (Ex and Em depict maximum excitation and emission wavelength respectively). d, Optic nerves, maintained functionally stable at 2 mM glucose and low spiking activity (0.2 Hz), exposed to 4-Br (25 µM; N = n = 5), an inhibitor of mitochondrial FA β-oxidation. Note the progressive decline of optic nerve conductivity (N = n = 7). e, Optic nerves exposed to Etox (5 µM, N = 6, n = 6), an inhibitor of long-chain FA uptake into mitochondria. Note the faster declining CAPA (N = n = 7). f, Same as in d, demonstrating a progressive loss of axonal ATP. Note the faster and stronger effect on the axonal ATP levels (N = n = 4) compared with controls (N = n = 5). g, Axonal ATP in Etox-treated nerves (N = n = 3) and controls (N = n = 5) as before. h, Optic nerves stimulated as before but in the presence of Thio (5 µM, N = 5, n = 5), an inhibitor of peroxisomal β-oxidation (N = n = 7). Note the difference to cell survival which is independent of peroxisomal β-oxidation (in Fig. 1i). i, Axonal ATP in Thio-treated nerves (N = n = 5) and controls (N = n = 5) as before. j, Optic nerves from Cnp-Cre+/-::Mfp2flox/flox mice, lacking peroxisomal β-oxidation in oligodendrocytes and controls, at 2.7 mM glucose with increasing stimulation frequency (N = n = 7 each). Stronger CAPA decline in mutant nerves (7 Hz) confirms the role of oligodendrocytes in metabolic support. k, Optic nerves from Cnp-Cre+/−::Tfebflox/flox mice (N = n = 9) and controls (N = n = 6), showing that FA mobilization does not depend on de novo autophagy induction. All mice are aged 2 months (from both sexes). Bar graphs are mean ± s.e.m. (unpaired, two-tailed Student’s t-test) of data recorded in the last 5 min at each frequency. Controls are shared across d, e and h. Source data
Fig. 4
Fig. 4. Oligodendroglial glucose starvation leads to a gradual myelin loss.
a, Targeting GLUT1 expression in oligodendrocytes. Plp-CreERT2::Slc2a1flox/flox mice received tamoxifen at age 2 months for phenotype analysis 5 months later. b, Western blot (WB) analysis of purified myelin membranes from whole-brain lysates. Note the decrease (quantified in ce) of (oligodendroglial) GLUT1 (c), but not (neuronal) GLUT3 (d) or panglial MCT1 (e); CA2 (for control (CTR), N = 4; for icKO, N = 4; error bars: mean ± s.e.m., unpaired, two-tailed Student’s t-test). Rel., Relative. TUBA, α-tubulin. f, Electron micrographs of optic nerve cross-section from GLUT1 mutant icKO (N = 4; CTR: N = 4). Note the thinning of myelin in the absence of axonal degeneration. g, Scatter plot of calculated g-ratios (fiber diameter/axon diameter) from optic nerve EM data, with regression lines as a function of axon diameter. h, Myelin thinning in GLUT icKO mice (N = 4) compared with controls (N = 3). Error bars: mean ± s.e.m., unpaired, two-tailed Student’s t-test. i,j, Western blots of brain lysates from GLUT1 icKO mice (i) and quantification (j), normalized to protein input (fast green) (N = 4 for CTR and icKO; mean ± s.e.m., heteroscedastic for BDH1; Student’s t-test). k, Proposed working model of glycolytic oligodendrocytes with a myelin compartment that constitutes a lipid-based energy buffer. During normal myelin turnover, the degradation of myelin lipids in lysosomes liberates FAs for β-oxidation (β-Ox) in mitochondria (MT) and peroxisomes (PEX), leading to new myelin lipid synthesis. When glucose availability is reduced, as modeled in GLUT1 icKO mice, myelin synthesis drops and FA-derived acetyl-CoA begins, supporting mitochondrial respiration for oligodendroglial survival. This shift of normal myelin turnover to lipid-based ATP generation allows oligodendrocytes to share relatively more glucose-derived pyruvate/lactate with the axonal compartment to support ATP generation and prevent axon degeneration. Note that glucose is never absent in vivo and that myelin-associated peroxisomes are better positioned than mitochondria to support axons with the products of FA β-oxidation. Whether oligodendrocytes also use ketogenesis to metabolically support axons and other cells is not known. Source data
Extended Data Fig. 1
Extended Data Fig. 1. Death of glucose-deprived optic nerve glial cells is not caused by oxidative stress.
a, Acutely isolated mouse optic nerves (age 2 months) were maintained for 24 h either in the presence of low (1 mM) glucose or 1.5 mM beta-hydroxybutyrate (HB). Longitudinal nerve sections were stained with DAPI (blue) and propidium iodide (in white). b, Bar graphs showing the percentage of viable cells for each condition (compare to Fig. 1c). Normal survival is possible in the presence of 1 mM glucose or 1.5 mM HB, indicating the critical role of glucose in energy production (N = n = 3 for both conditions; mean ± SEM, unpaired two-sided t-test). c, Longitudinal sections of optic nerves stained with PI and DAPI after 24 h incubation in glucose-free aCSF and in the presence of 10 μM of S3qel-2 (inhibitor for ROS production in complex III of electron transport chain) and 10 μM MitoTEMPO (mitochondrial ROS scavenger) or vehicle (DMSO) as control. d, Quantified cell survival (PI/DAPI) indicates that ROS do not contribute to cell death (N = n = 4 for control and N = n = 5 for ROS inhibitor/scavenger; wild type mice, 8-10 weeks old; mean ± SEM, unpaired two-sided t-test). N and n indicate the total number of optic nerves used for each condition and the total number of independent experiments, respectively. Source data
Extended Data Fig. 2
Extended Data Fig. 2. Vesicle formation in the myelin compartment is independent of ongoing axonal degeneration in metabolically stressed optic nerves.
a, Electron micrographs of wildtype optic nerves (age 2 months), incubated for 24 in 10 mM glucose (left) or 0.5 mM glucose (right). Note periaxonal vesicular structures (white arrows) indicating myelin degradation under low glucose. b, Quantification of the data in (a) comparing percentage of myelinated axon cross sections with periaxonal vesicular structures (N = n = 3 for both conditions; mean ± SEM, unpaired two-tailed Welch’s t-test). c, longitudinal optic nerve section prepared freshly (0 h, left), after 24 h in 10 mM glucose (middle) or 0.5 mM glucose (right), immunostained for NF-L (green) and counter-stained with DAPI (blue). Yellow arrowheads point to degenerating axons (N = n = 3-4 for each condition). Source data
Extended Data Fig. 3
Extended Data Fig. 3. Increased autophagy and lipid metabolism in metabolically stressed optic nerves.
a, Left: silver stained gels of optic nerve lysates from 2 month old wildtype mice (both genders), prepared after 24 h incubation in 10 mM glucose or 1 mM glucose (two nerves pooled per lane; one lane is equivalent to one sample). N = n = 5 for both conditions. Right: optic nerve lysates prepared after 16 h in 10 mM glucose or 0 mM glucose. Note the lack of major protein degradation. N = n = 5 for both conditions. b, Relative abundance of selected proteins in optic nerve lysates after 24 h in 1 mM glucose (left, N = n = 5) or 16 h in 0 mM glucose (right, N = n = 5). Note that enzymes of glucose and lipid metabolism show only moderate changes in abundance. Autophagy related proteins are increased in the presence of 1 mM glucose only, indicating a requirement of glucose for RNA synthesis and protein expression (N = n = 5, two technical replicates each; moderated t-statistics (more details in methods section)); Statistical significance (q-value) depicted on the right side of each panel. c, d, Western blots of lysates from wildtype optic nerves, incubated in 10 mM or 0 mM glucose for 16 h (age 8-12 weeks old, N = n = 5 for each condition) (c) and quantification of ACAT1 and BDH1 (d). Normalized to protein input (mean ± SEM, unpaired two-tailed t-test). e, Cell survival of 24 h glucose-deprived optic nerves from TFEB cKO mice (N = n = 4) and controls (N = n = 4; age 8-12 weeks). Images from longitudinal sections were stained with PI and DAPI. f, Quantified data from (e). There is no difference of cell survival (mean ± SEM, unpaired two-tailed Welch’s t-test). N and n indicate the total number of independent samples for each condition and the total number of independent experiments, respectively. Source data
Extended Data Fig. 4
Extended Data Fig. 4. Decline in starved nerve function upon beta-oxidation inhibition is not caused by inhibitors cytotoxcicity or mitochondrial ROS generation.
a, Empirical determination of the minimal glucose concentration at which optic nerves can spike at low frequency (1/30 s) for 3 hours without loss of compound action potential area (CAPA), normalized to control values with 10 mM glucose. b, Bar graphs of the CAPA summation (CAPA area) calculated for the time window (yellow box in a) for different glucose concentrations (N = n = 3 for 10, 3.7, 3 and 2.7 mM glucose condition, N = n = 3 for 2 mM and N = n = 5 for 3.3 mM glucose condition, one-way ANOVA, Tukey’s test). c, Recordings in aCSF+10 mM glucose ±25 μM 4-Br (N = n = 7 for control and N = n = 5 for 4-Br treated nerves). d, Bar graph of the CAPA summation for the defined time window (dashed lines) in (c). Values normalized to control. e, Normal conduction in aCSF with 10 mM glucose and 5 μM Etomoxir (Etox; N = n = 4) in comparison to 10 mM glucose control (same data as in c; N = n = 7). f, Bar graph comparing the calculated CAPA summation for the time window between the dash lines in (e). obtained values were normalized to control condition. g, Normal conduction in aCSF with 10 mM glucose and 5 μM Thioridazine (Thio; N = n = 4 in comparison to 10 mM glucose (same data as in c; N = n = 7)). h, Bar graph comparing the calculated CAPA summation for the depicted time window (dash lines) in (g). Obtained values were normalized to control. i, Conductivity under low glucose (aCSF+2.7 mM glucose +/-4-Br(25 μM)) in the presence of the ROS production inhibitor (S3qel-2, 10 μM) and mitochondrial ROS scavenger (MitoTEMPO, 10 μM). N = n = 5 for control (without 4-Br) and N = n = 7 (plus 4-Br). j, Bar graph comparing calculated CAPA from the data in (N &n the same as in (i)) for the average of CAPA recorded during the last 5 min of each step of the RAMP protocol. All nerves from wild type mice (age 8-12 weeks, from both genders) unless mutants specified. All error bars: mean ± SEM, unpaired two-tailed t-test, unless indicated. N and n indicate the total number of optic nerves for each condition and the total number of independent experiments, respectively. Source data
Extended Data Fig. 5
Extended Data Fig. 5. Inhibition of beta-oxidation in 10 mM glucose or peroxisomal beta-oxidation in oligodendrocytes does not affect optic nerves at histological and electrophysiological level at young adult mice.
a, Spiking at high frequencies. Recordings were in aSCF (10 mM glucose) ± 25 μM 4-Br, using a RAMP protocol of increasing frequencies between 5 and 20 Hz (N = 3, n = 4 for control and N = 2, n = 3 for 4-Br treated nerves). b, Bar graphs of CAPA, calculated for each nerve over 5 min at the indicated frequencies (from a). c, EM images of MFP2 cKO optic nerves. d, Axon numbers in MFP2 cKO (N = 2, n = 3) versus controls (N = n = 3). e, Unmyelinated axon numbers (in m) in MFP2 cKO (N = 2, n = 3) versus controls (N = n = 3). f, Percentage of axons with abnormal morphology in MFP2 cKO (N = 2, n = 3) versus controls (N = n = 3). g, Longitudinal optic nerve section of MFP2 cKO and controls, immunostained for Iba1 (counterstained with DAPI). h, Number of Iba1+ microglia normalized to DAPI+ nuclei (N = n = 4 for control and MFP2 cKO). i, Normal excitability of optic nerves (N = 6, n = 11 for CTR and N = 4, n = 7 for MFP2 cKO). j, Optic nerve conduction velocity (NCV) in controls (N = 7, n = 11) and MFP2 cKO (N = 6, n = 9). All nerves from wild type mice (age 8-12 weeks, male and female) unless mutants specified. All error bars: mean ± SEM, unpaired two-tailed t-test. N and n indicate the total number of used mice for each condition and the total number of independently recorded/analyzed optic nerves, respectively. Source data
Extended Data Fig. 6
Extended Data Fig. 6. Preexisting autophagy contributes to oligodendroglial support of axonal conduction in starved optic nerves.
a, CAP recordings from wild type optic nerves kept under low glucose condition (aCSF with 2.7 mM glucose) in the presence or absence of 10 μM autophagy inhibitor Lys05 (8-12 weeks old, male and female; N = n = 5 each condition). b, Bar graph representing the average CAPA during the last 5 min of each stimulation step (same data in a; mean ± SEM, unpaired two-tailed t-test). c, Effect of the autophagy inducer DMC (40 μM) on nerve conduction under low glucose condition. Note that the inducer improves CAPA in wildtype optic nerves but in nerves from TFEB cKO mice. d, Quantification of the data in (c) with a comparison of CAPA at 9 h (average of 5 min recordings). Statistics: N = n = 3 for control ( + DMSO), N = n = 3 for control +DMC, and N = n = 4 for TFEB + DMC, 3-5 months old mice from both genders, (mean ± SEM, one-way ANOVA, Tukey’s test). Source data
Extended Data Fig. 7
Extended Data Fig. 7. Hypomyelinated optic nerves in normally behaving GLUT1 icKO mice lack histological signs of pathology or gliosis.
a, Normal body weight of GLUT1 icKO mice at the age of 7 months (5 months post tamoxifen). (N = 6, CTR and icKO). b, Normal rotarod performance of GLUT1 icKO mice shown as the speed (rpm) at which the mice fall (same mice in a). c, Normal forelimb grip strength of GLUT1 icKO mice (same mice as in a). d, Quantification of the inner tongue size as a function of axon caliber, by plotting the axon diameter (ax) by the respective diameter of a circle defined by the inner surface of the compacted myelin sheath (il), analogous to g-ratios (same images in Fig. 4f). e, Tendency for smaller average inner tongue sizes in GLUT1 icKO mice. (same data as in d; CTR, N = n = 3; icKO, N = n = 4). f, Normal number (density) of optic nerve axons in GLUT1 icKo mice normalized to controls (same images from Fig. 4f). g, Normal axon size distribution in optic nerve from GLUT1 icKo mice (same images from Fig. 4f; CTR, N = n = 3; icKO mice, N = n = 4). h, Normal percentage of unmyelinated axons in GLUT1 icKO mice (same images from Fig. 4f). i, Normal percentage of axons showing morphological abnormalities by EM analysis (from images in Fig. 4f). j, Normal excitability of optic nerves from GLUT1 icKO mice, recorded with increasing current of stimulation. Calculated CAPA for each current was normalized to recorded CAPA at 0.75 mA (CTR, N = n = 9; icKO, N = n = 15). k, Normal optic nerve conduction velocity (NCV) of GLUT1 icKO mice, calculated by dividing latency of the second CAP peak to the length of the nerve (common data with j; CTR, N = n = 6; icKO, N = n = 12). l, Longitudinal sections of GLUT1 icKO optic nerves immunostained for Iba1 and counterstained with DAPI. m, Normal number of Iba1+ microglia in optic nerve from GLUT1 icKO mice, normalized to the number of DAPI+ nuclei in the same area (same images in l). CTR N = 3, n = 4, icKO N = n = 5. All animals (both genders) were analyzed 4-5 months post tamoxifen injections. All error bars: mean ± SEM, unpaired two-tailed t-test. CTR, Control. Source data
Extended Data Fig. 8
Extended Data Fig. 8. Optic nerves in GLUT1 icKO mice lack histological signs of changes in inflammatory/oligodendrocyte population or lipid droplets.
a, Longitudinal sections of GLUT1 icKO optic nerves immunostained for CC1 (orange) and counterstained with DAPI (blue). b, Oligodendrocytes population in optic nerve from GLUT1 icKO mice calculated by dividing the DAPI spots positive for CC1 to total number of DAPI+ nuclei (DAPI + CC1 + /DAPI + ) in the same area. Data points were normalized to the mean of CTR; N = 4 for both CTR and icKO. c, Longitudinal sections of GLUT1 icKO optic nerves immunostained for CC1 (orange), IL-33 (green) and counterstained with DAPI (blue). d-e, Bar graphs showing percentage of oligodendrocytes were positive for inflammatory marker, IL-33, (CC1 + IL-33 + ) divided to total number of oligodendrocytes (DAPI + CC1 + ) (d) and percentage of oligodendrocytes exhibiting high expression of inflammatory marker, IL-33 (e). (data points were normalized to the mean of CTR; N = 4 for both CTR and icKO). f, GLUT1 icKO optic nerve longitudinal sections were immunostained for Plin2 (red) and counterstained with DAPI (blue). Note lipid droplets are barely detectable in optic nerve cells (N = 3 for both control and icKO nerves). All animals (from both genders) were analyzed at the age of 6-7 months (4-5 months post tamoxifen). An unpaired two-tailed t-test was performed for comparing different groups. Error bars indicate mean ± SEM, and individual data points displayed. CTR, Control. Source data

References

    1. Cohen, C. C. et al. Saltatory conduction along myelinated axons involves a periaxonal nanocircuit. Cell180, 311–322.e315 (2020). - PMC - PubMed
    1. Fünfschilling, U. et al. Glycolytic oligodendrocytes maintain myelin and long-term axonal integrity. Nature485, 517–521 (2012). - PMC - PubMed
    1. Lee, Y. et al. Oligodendroglia metabolically support axons and contribute to neurodegeneration. Nature487, 443–448 (2012). - PMC - PubMed
    1. Saab, A. S. et al. Oligodendroglial NMDA receptors regulate glucose import and axonal energy metabolism. Neuron91, 119–132 (2016). - PMC - PubMed
    1. Trevisiol, A. et al. Monitoring ATP dynamics in electrically active white matter tracts. eLife6, e24241 (2017). - PMC - PubMed

MeSH terms

LinkOut - more resources