. 2024 Sep 9;24(1):845.
doi: 10.1186/s12870-024-05537-z.

Planting pattern and nitrogen management strategies: positive effect on yield and quality attributes of Triticum aestivum L. crop

Affiliations

Planting pattern and nitrogen management strategies: positive effect on yield and quality attributes of Triticum aestivum L. crop

Muhammad Farooq Azam et al. BMC Plant Biol. .

Abstract

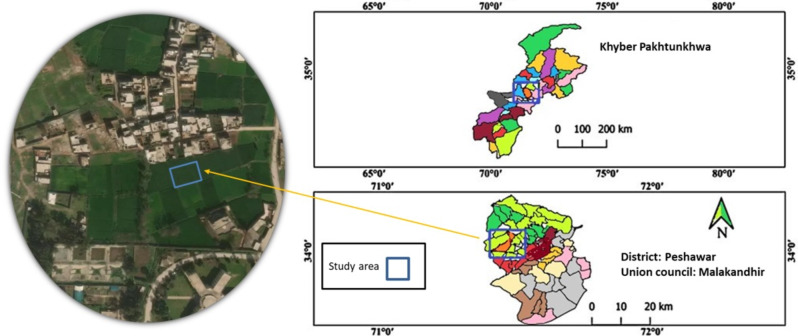
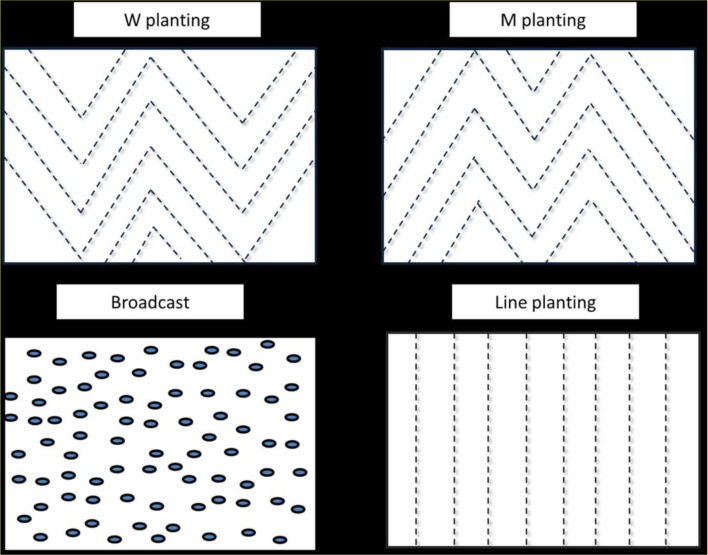
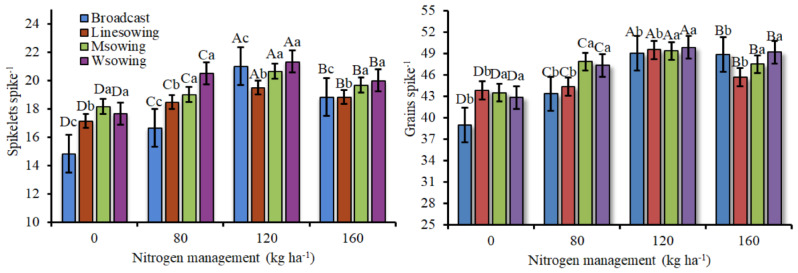
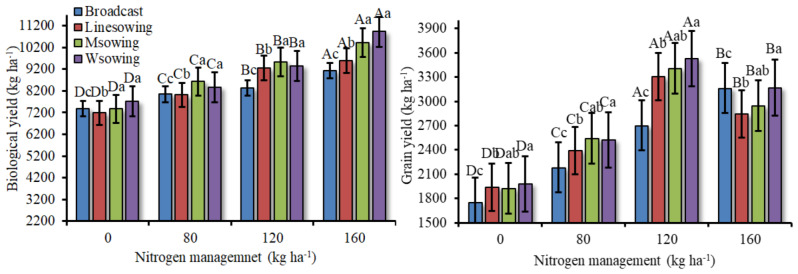
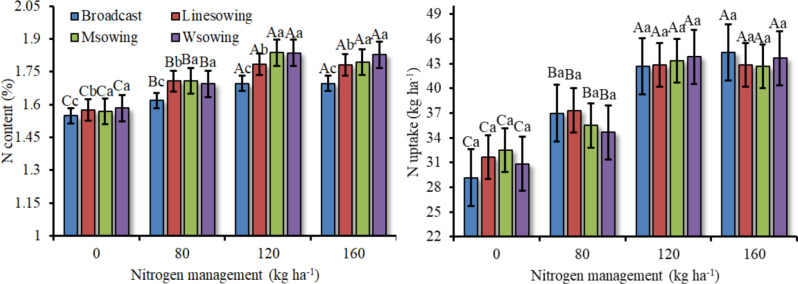
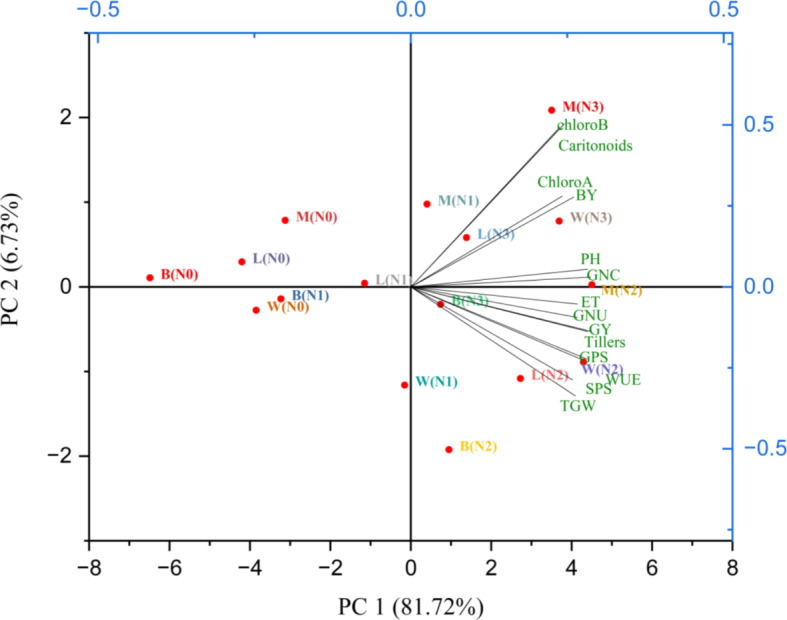
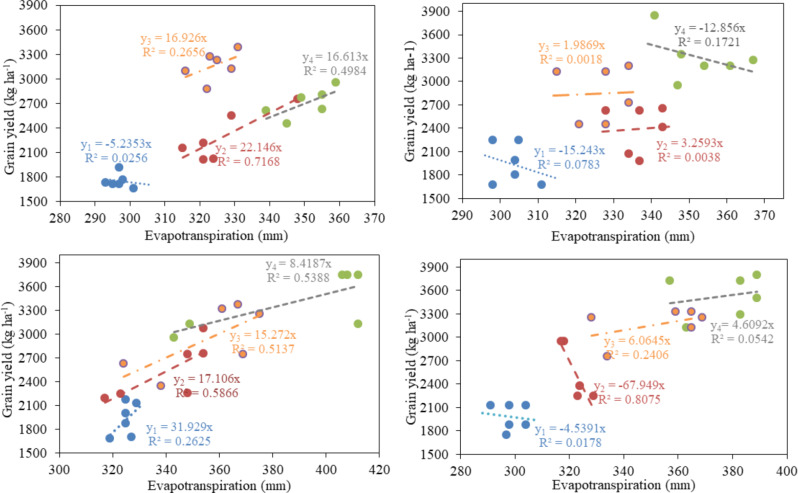
Wheat (Triticum aestivum L.) is a staple food crop that plays a crucial role in global food security. A suitable planting pattern and optimum nitrogen (N) split management are efficient practices for improving wheat production. Therefore, an experiment was performed to explore the effect of N split management and sowing patterns on wheat at the Agronomy Research Farm, The University of Agriculture Peshawar, during rabi season 2020-21 and 2021-22. The treatments consisted of different nitrogen rates of 0, 80, 120, and 160 kg ha- 1 and planting patterns of W, M, broadcast and line sowing. The pooled analysis of both cropping seasons showed that application of 120 kg N ha- 1 increased spikelets spike- 1, grains spike- 1, 1000 grains weight, grain yield, grain N content, evapotranspiration and water use efficiency by 21.9, 16.7, 21.8, 70, 13, 19.9 and 40% as compared to control, respectively. In addition, W and M were observed the best management practices among all planting patterns. The M planting pattern enhanced chlorophyll a, b, carotenoids and evapotranspiration while W plating pattern improved yield components and yield of wheat as compared to broadcast planting patterns. The principal component analysis biplot showed a close association of M and W planting patterns with 120 kg N ha- 1 in most of the studied traits. Hence, it is concluded that split application of 120 kg N ha- 1 in W and M sowing patterns enhanced growth, biochemical traits and water use efficiency, reducing N fertilization from 160 to 120 kg ha- 1 while increasing grain yield of wheat. Hence, it is recommended that application of 120 kg N ha⁻¹ in combination with W and M planting patterns offer a sustainable approach to enhancing wheat production in the alkaline soil conditions of the Peshawar valley.

Keywords: Evapotranspiration; Nitrogen management; Spatial arrangement; Water use efficiency.


Conflict of interest statement

The authors declare no competing interests.

Figures

Fig. 1
Fig. 1
Description of geographical location of the study area
Fig. 2
Fig. 2
Meteorological data of experimental site during 2020-21 and 2021-22 cropping seasons
Fig. 3
Fig. 3
Schematic diagram of different planting patterns
Fig. 4
Fig. 4
Interactive effect of nitrogen rates and sowing patterns on spikelets spike− 1 and grains spike− 1 (Fig. 4a, and 4b respectively). Error bars indicate the standard error of the mean. The uppercase letters are used for nitrogen rates interactions within each planting patterns, whereas lowercase letters are used for the planting pattern within each nitrogen rates. The identical alphabetic letters do not differ from each other, as analyzed by LSD (nitrogen rates; p < 0.05) and (planting pattern; p < 0.05) test for both years. (n = 4 replications)
Fig. 5
Fig. 5
Interactive effect of nitrogen rates and sowing patterns on grain and biological yield (kg ha− 1) (Fig. 5a and b, respectively). Error bars indicate the standard error of the mean. The uppercase letters are used for nitrogen rates interactions within each planting patterns, whereas lowercase letters are used for the planting pattern within each nitrogen rates. The identical alphabetic letters do not differ from each other, as analyzed by LSD (nitrogen rates; p < 0.05) and (planting pattern; p < 0.05) test for both years. (n = 4 replications)
Fig. 6
Fig. 6
Interactive effect of nitrogen rates and sowing patterns on nitrogen content and N uptake (Fig. 6a and b, respectively). Error bars indicate the standard error of the mean. The uppercase letters are used for nitrogen rates interactions within each planting patterns, whereas lowercase letters are used for the planting pattern within each nitrogen rates. The identical alphabetic letters do not differ from each other, as analyzed by LSD (nitrogen rates; p < 0.05) and (planting pattern; p < 0.05) test for both years. (n = 4 replications)
Fig. 7
Fig. 7
Interactive effect of nitrogen rates and planting patterns on crop evapotranspiration (mm). Error bars indicate the standard error of the mean. The uppercase letters are used for nitrogen rates interactions within each planting patterns, whereas lowercase letters are used for the planting pattern within each nitrogen rates. The identical alphabetic letters do not differ from each other, as analyzed by LSD (nitrogen rates; p < 0.05) and (planting pattern; p < 0.05) test for both years. (n = 4 replications)
Fig. 8
Fig. 8
Principal component analysis (PCA) for studied traits of wheat against different combinations of nitrogen rates and various planting patterns during 2020-21 and 2021-22. N0 = control, N1 = 80 kg N ha− 1, N2 = 120 kg N ha− 1 and N3 = 160 kg N ha− 1 while B = broadcasting, L = line planting, M = M planting and W = W planting pattern
Fig. 9
Fig. 9
Correlation between grain yield and grain N content (%) at different nitrogen rates (y1 = N0, y2 = N1, y3 = N2 and y4 = N3) at broadcasting (a), line planting (b), M planting (c) and W planting pattern(d)
Fig. 10
Fig. 10
Correlation between evapotranspiration (mm) and nitrogen levels (y1 = N0, y2 = N1, y3 = N2 and y4 = N3). (a) Evapotranspiration with broadcast planting, (b) Evapotranspiration with line planting, (c) Evapotranspiration with M planting and (d) Evapotranspiration with W planting

References

    1. FAO. Statistical Yearbook. Food and Agriculture Organization of the United Nations. 2013. p. 289.
    1. Giraldo P, Benavente E, Manzano-Agugliaro F, Gimenez E. Worldwide research trends on wheat and barley: a bibliometric comparative analysis. Agronomy. 2019;9(7):352. 10.3390/agronomy9070352.10.3390/agronomy9070352 - DOI
    1. FAO. Food and Agriculture Organization of the United Nations. Retrieved from FAO website; 2021.
    1. Tilman D, Clark M, Williams DR, Kimmel K, Polasky S, Packer C. Future threats to biodiversity and pathways to their prevention. Nature. 2021;546(7656):73–81.10.1038/nature22900 - DOI - PubMed
    1. Rahman M, Ali S, Khan M. Nitrogen management in wheat production. J Plant Nut Soil Sci. 2022;185(6):902–13. 10.1002/jpln.202200058.10.1002/jpln.202200058 - DOI

MeSH terms

LinkOut - more resources