. 2024 Sep 9;22(1):434.
doi: 10.1186/s12964-024-01819-z.

Modulating voltage-gated sodium channels to enhance differentiation and sensitize glioblastoma cells to chemotherapy

Affiliations

Modulating voltage-gated sodium channels to enhance differentiation and sensitize glioblastoma cells to chemotherapy

Francesca Giammello et al. Cell Commun Signal. .

Abstract

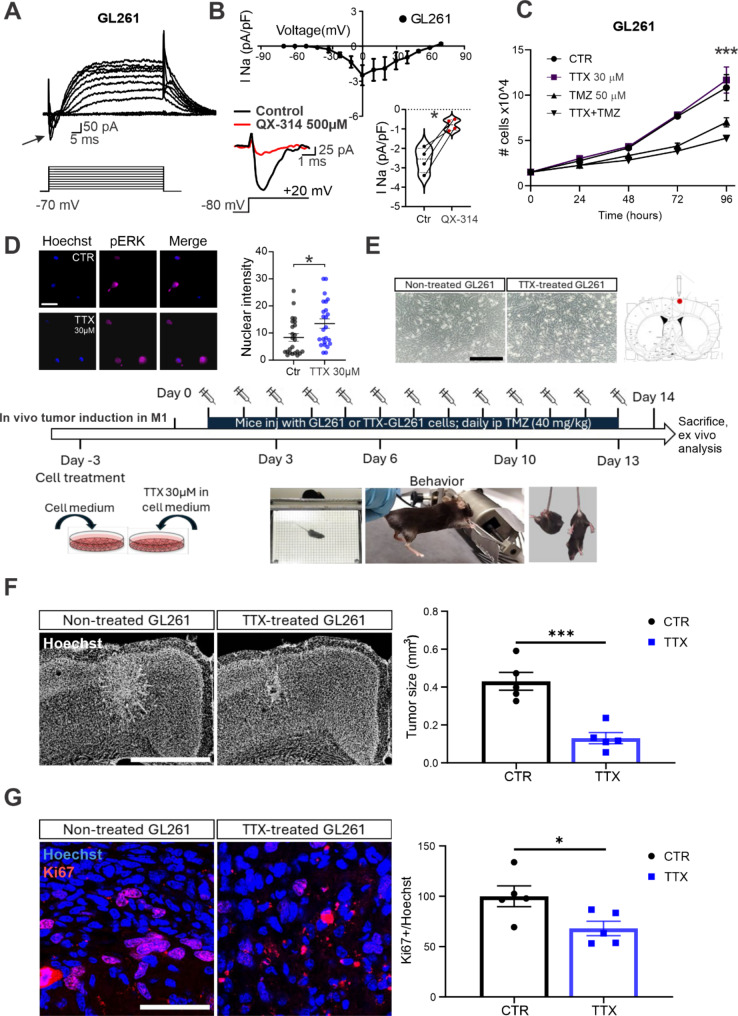
Background: Glioblastoma (GBM) stands as the most prevalent and aggressive form of adult gliomas. Despite the implementation of intensive therapeutic approaches involving surgery, radiation, and chemotherapy, Glioblastoma Stem Cells contribute to tumor recurrence and poor prognosis. The induction of Glioblastoma Stem Cells differentiation by manipulating the transcriptional machinery has emerged as a promising strategy for GBM treatment. Here, we explored an innovative approach by investigating the role of the depolarized resting membrane potential (RMP) observed in patient-derived GBM sphereforming cell (GSCs), which allows them to maintain a stemness profile when they reside in the G0 phase of the cell cycle.

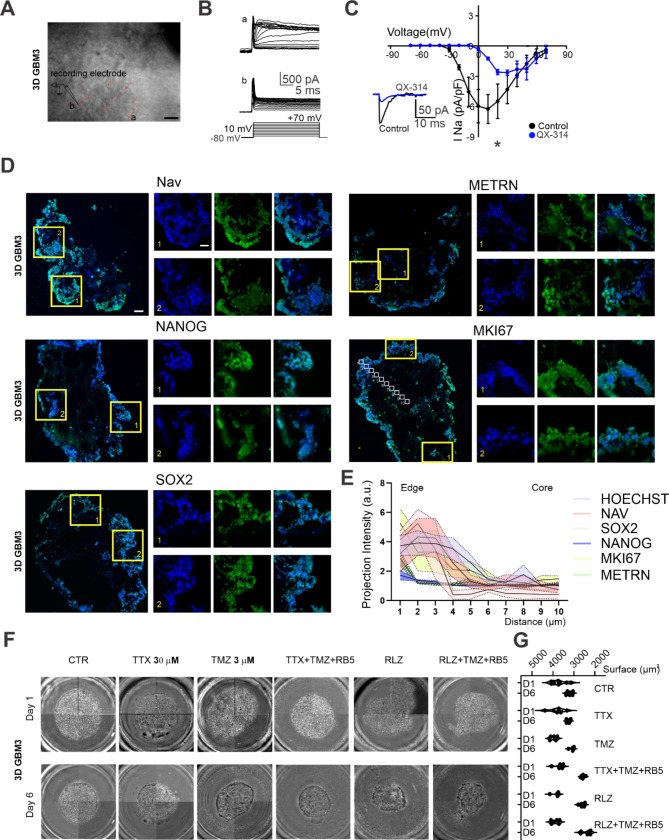
Methods: We conducted molecular biology and electrophysiological experiments, both in vitro and in vivo, to examine the functional expression of the voltage-gated sodium channel (Nav) in GSCs, particularly focusing on its cell cycle-dependent functional expression. Nav activity was pharmacologically manipulated, and its effects on GSCs behavior were assessed by live imaging cell cycle analysis, self-renewal assays, and chemosensitivity assays. Mechanistic insights into the role of Nav in regulating GBM stemness were investigated through pathway analysis in vitro and through tumor proliferation assay in vivo.

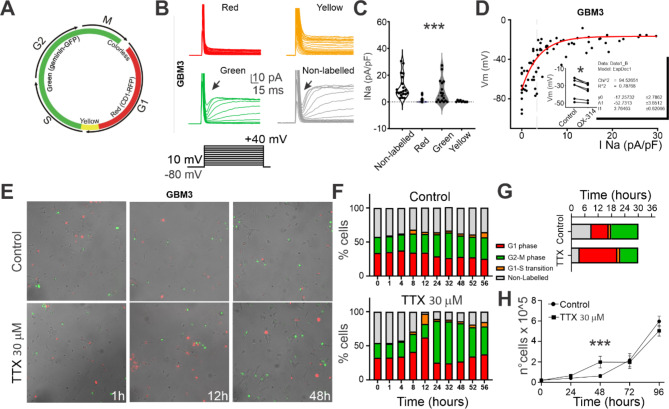
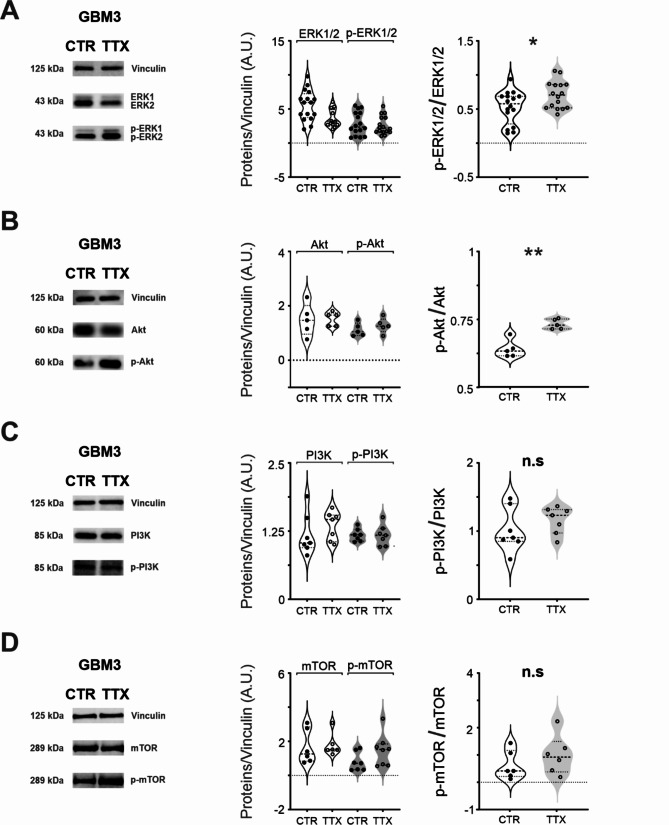
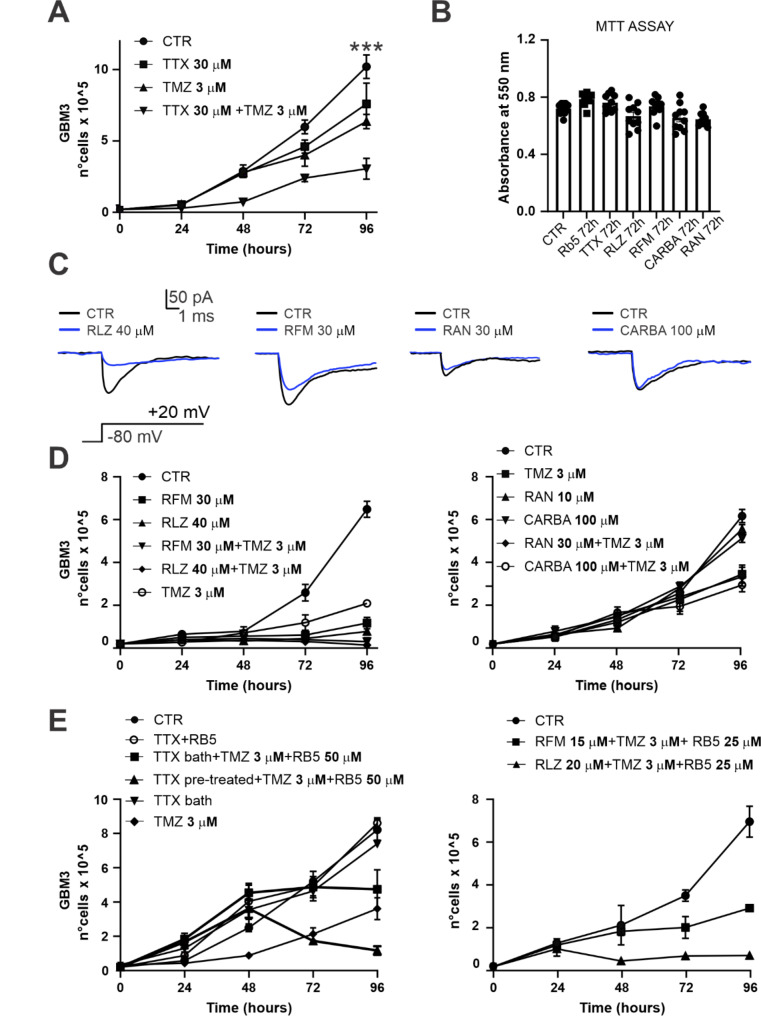
Results: We demonstrated that Nav is functionally expressed by GSCs mainly during the G0 phase of the cell cycle, suggesting its pivotal role in modulating the RMP. The pharmacological blockade of Nav made GBM cells more susceptible to temozolomide (TMZ), a standard drug for this type of tumor, by inducing cell cycle re-entry from G0 phase to G1/S transition. Additionally, inhibition of Nav substantially influenced the self-renewal and multipotency features of GSCs, concomitantly enhancing their degree of differentiation. Finally, our data suggested that Nav positively regulates GBM stemness by depolarizing the RMP and suppressing the ERK signaling pathway. Of note, in vivo proliferation assessment confirmed the increased susceptibility to TMZ following pharmacological blockade of Nav.

Conclusions: This insight positions Nav as a promising prognostic biomarker and therapeutic target for GBM patients, particularly in conjunction with temozolomide treatment.

Keywords: CANCER STEM CELLS; ERK; GBM; MAPK; Nav; RESTING MEMBRANE POTENTIAL; TMZ; TTX; CHEMOTHERAPY.


Conflict of interest statement

The authors declare no competing interests.

Figures

Fig. 1
Fig. 1
Expression of SCN1A is associated with worse survival in glioblastoma patients and correlates with GSCs markers: (A) Pooled data for the 288-hours proliferation assays of proneural GSCs in the control condition (circles) and in the presence of TMZ 3µM (squares). Inset: the same pool of data but for the time window zoomed in the interval from 0 to 96 h. (B) Average I-V Plot from − 70 mV to 70 mV acquired in whole-cell patch clamp showing a significant inward current upregulation in TMZ-resistant cells (b, TMZ 3µM) compared to non-treated cells (a, Control). Inset: representative inward current traces recorded at + 10 mV for the two conditions. (C) Sensitivity to TTX and QX-314 revealed the nature of the recorded inward current. On top, the Nav-mediated nature of the current was assessed with bath perfusion of the specific blocker Tetrodotoxin (TTX 1µM). Representative trace in control (black) and after TTX perfusion (red). On the bottom, the Nav -mediated current was also tested with intracellular dialysis of the lidocaine derivative QX-314 500 µM, which blocks the channel from the cytosolic compartment. Representative traces in control (black) and after QX-314 dialysis (red) are also displayed. After both treatments, the inward current was significantly abolished, thus confirming the current’s identity. On the right, average pool data for all the recorded cells in control, with TTX and QX-314 perfusion. (D) Immunoreactivity to the Pan-Nav antibody (green channel), E-Cadherin antibody (red channel) and nuclear staining (Hoechst, blue channel) in control condition (CTR) and after 288 h TMZ 3 µM treatment. Scale bar is 50 μm. (E) Optical density (OD) violin plots illustrating single-cell measurements in CTR condition and after 288 h TMZ 3 µM treatment (upper panel). Pool data for the percentage of cells positive to Nav for the two conditions (lower panel).(F) Bulk analysis of SCN1A mRNA expression levels in three different GBM subtypes. (G) Whole-cell electrophysiological recordings were performed on different subtypes of GSCs, and the Nav-mediated current was recorded. On the top, representative traces are recorded at different holding potentials from a proneural line. The corresponding voltage steps applied are displayed. On the bottom, the average I-V plot from − 70 mV to 70 mV for all the proneural recorded primary cell lines. (left) Recordings of adherent and suspended proneural GSCs. (right) Recordings of the classical and mesenchymal cell line. (H) Kaplan-Meier survival curve of GBM patients with a proneural subtype. The cut-off was set at 7.7 (log2). (I) SCN1A mRNA expression level positively correlates with some stemness markers. The slope value of the linear fitting and the significance of the correlation are displayed. Conversely, SCN1A negatively correlates with markers associated with proliferation and differentiation. (J-L) Immunohistochemical staining for different GSC markers (CD133, SOX2) and Nav in various GBM patient biopsies. Panels a and b show representative images of staining for Hoechst and the GSC marker, and Hoechst and Nav, respectively. Panel c shows the merge of the previous two panels. Scale bar is 20 μm. Panel d shows a more defined FOV taken from panel c. Scale bar is 20 μm. The white arrows indicate cells positive for both Nav and the GSC markers
Fig. 2
Fig. 2
GSCs stemness markers as well as self-renewal properties are significantly downregulated when Nav is pharmacologically blocked: (A) Heatmap showing the differential expression level of the mRNA stemness markers (gradient bar represents the degree of gene expression level) in the control condition and after 5 h and 72 h of TTX 30 µM treatment in the medium. The measurement is reported in Log2FoldChange. The degree of significance is specified on the left side of the marker name. (B) WB quantification for stemness markers reveals a significant reduction in the protein content for SOX2 and NANOG. (C) Western Blot quantification for differentiation markers (E). (D) Immunoreactivity to O4 antibody in control and after 72 h of TTX treatment. (E) Top: immunoreactivity to Pan-Nav antibody (red channel), SOX2 (green channel), and nuclear staining (Hoechst, blue channel) for GSCs in the control and after 72 h of TTX treatment. Scale bar is 50 μm. Bottom: Immunoreactivity to the Pan-Nav antibody (red channel) and positivity for NANOG (green channel) and nuclear staining (Hoechst, blue channel) for GSCs in the control and after 72 h of TTX treatment. Scale bar is 50 μm.(F) Pool data for the percentage of cells positive to SOX2, NANOG and Nav for the two conditions. (G) Representative example of a clonogenic assay in the control (top) and with cells pretreated for 72 h with TTX 30 µM (bottom). Pool data quantifying the number and the relative area of the colonies (on the right). (H) Representative example of a neurosphere formation assay in the control (top) and with cells pretreated for 72 h with TTX (30 µM) (bottom). Pool data quantifying the number and the relative area of the neurospheres
Fig. 3
Fig. 3
Nav is functionally expressed in a cell-cycle phase-specific manner and regulates the G0 to G1 transition: (A) Cell cycle progression was investigated by viral-mediated expression of the Fluorescence Ubiquitin Cell Cycle Indicator (FUCCI) system. A scheme of the FUCCI system is provided. (B) Representative electrophysiological traces from primary GSCs in different cell cycle phases recognized by fluorescence positivity. (C) Pool data for all the recorded cells in different cell cycle phases revealed a significantly higher functional expression of Nav in GSCs in the G0 (Non-labeled) and G2/M phases (green). (D) Correlation between Nav current density and resting membrane potential for each recorded cell. Inset: change in the RMP as a consequence of QX-314 intracellular dialysis (5 min after break-in). (E) Time-lapse example images acquired at 1 h, 12 h, and 48 h for the 56 h time-lapse recording experiment. (F) Average distribution of GSCs in cell cycle phases: the mean percentage distribution of green cells, red cells, or green and red has been quantified in control and after the application of TTX. (G) Cell cycle phases average duration for a pool of representative GSCs tracked for the whole time lapse (30 h) in control condition and in the presence of TTX (H) 96-hours proliferation assay in control and in the presence of TTX 30 µM
Fig. 4
Fig. 4
Nav functional activity suppresses ERK and Akt pathway: (A) (left) Example of a Western Blot for total and phosphorylated p44/p42 ERK1/2 in both control and TTX condition. (center) Analysis quantification for the p44/p42 ERK1/2 and the phospho p44/p42 ERK1/2 in control and TTX condition. (right) Ratio between the p44/p42 ERK1/2 and the phospho p44/p42 ERK1/2 in control and TTX condition. (B)(left) Example of a Western Blot for the Akt and phospho-Akt (Ser473) in both control and TTX condition. (center) Analysis quantification for the Akt and phospho-Akt (Ser473) in control and TTX condition. (right) Ratio between the Akt and the phospho-Akt in control and TTX condition. (C) Example of a Western Blot for the p85 PI3K and the phospho-p85/p55 PI3K in both control and TTX conditions. (center) Analysis quantification for the p85 PI3K and the phospho-p85/p55 PI3K in control and TTX condition. (right) Ratio between the p85 PI3K and the phospho-p85/p55 PI3K in control and TTX condition. (D) Example of a Western Blot for the mTOR and the phospho-mTOR-Ser2448 in both control and TTX conditions. (center) Analysis quantification for the mTOR and the phospho-mTOR-Ser2448 in control and TTX condition. (right) Ratio between the mTOR and the phospho-mTOR-Ser2448in control and TTX condition
Fig. 5
Fig. 5
Blockade of Nav-mediated current increase sensibility to TMZ (A) GSCs proliferation assay comparing the following condition: control (control), TTX-pretreatment for 72 h (TTX), TMZ 3 µM (TMZ), and TMZ with TTX-pretreatment for 72 h (TMZ + TTX). (B) Effects of RB5, TTX, RLZ, RFM CARBA, RAN on cell viability/proliferation of GSCs. Data obtained with the MTT vitality assay after 72 h exposure to the displayed concentrations for each drug. (C) Electrophysiological example traces evoked from recorded GSCs showing the effect of RLZ, RFM, RAN, and CARBA on the Nav-mediated current at the indicated concentrations. The eliciting protocol is also displayed. (D) (left) GSCs proliferation assay comparing the effect of antiepileptic and anticonvulsant drugs that target the Nav channel: control (CTR), rufinamide 30 µM (RFM), riluzole 40 µM (RLZ), and the same conditions in addition with TMZ 3 µM (RFM + TMZ; RLZ + TMZ respectively). (right) Same combinations as for (B left) but with Ranolazine (RAN 10 µM) and Carbamazepine (CARBA 100 µM). (E) (left) TMZ increased sensitivity mediated by Nav blockade (TTX 30 µM) can be increased when combined with ERK1/2 agonist RB5 50 µM. (right) TMZ sensitivity induced by Nav blockade with RFM and RLZ can be increased when combined with ERK1/2 agonist RB5 at 25 µM
Fig. 6
Fig. 6
Characterization of Nav expression on 3D GSC cultures and proliferation assay: (A) Example of the experimental approach for the electrophysiological acquisition on 3D GSCs cultures: cells somata was recognized under bright field configuration (red arrows) and approached for patch-clamp recording. a and b are two recorded cells whose traces are shown in (B). (C) Average I-V Plot of the inward current recorded in 3D GSCs cultures in control and after QX-314 intracellular dialysis. (D) Representative images of immunoreactivity to Pan-Nav antibody, METRN, NANOG, MKI67, SOX2 (green channel) and nuclear staining (Hoechst, blue channel) for 3D GSCs cultures. Scale bars are 100 µM for low magnification pictures and 50 µM for the ROIs (E) Projection intensity profiles of Hoechst, Nav, SOX2, NANOG, METRN and MKI67 (each profile is an average from 3 3D GSCs cultures and 2 slices for each 3D GSCs culture).(F) Representative images of 3D GSC cultures at the first day of recording (Day 1),prior to treatment and after 6 days of treatment (Day 6), for the following conditions: control (CTR), TTX, TMZ, TTX + TMZ + RB5, RLZ + TMZ + RB5. Proliferation was assessed by calculating the surface of each acquired 3D GSCs cultures and averaging them for each condition. (G) The surface summary plot of all the conditions for Day 1 (D1) and Day 6 (D6) is displayed
Fig. 7
Fig. 7
Efficacy of Temozolomide (TMZ) combine with Tetrodotoxin (TTX) in Reducing Tumor Size and Proliferation in GL261 Glioma Models: (A) Representative traces of inward currents recorded from GL261 cells using electrophysiological recordings. Inward currents were observed in 6 out of 11 cells tested, indicating the presence of functional Nav channels. The voltage protocol used is shown below the traces. (B) Top: Average current density-voltage (I-V) relationship for Nav currents in GL261 cells. Representative recording on the effect of QX-314 on Nav currents in GL261 cells. The inclusion of Bottom: QX-314 in the intracellular solution significantly reduced the current density of the inward current. The black trace represents control conditions, and the red trace represents the condition with QX-314. The scatter plot on the right shows pooled individual current densities in control and after QX-314 intracellular dialysis with a significant reduction observed. (C) Proliferation assay of GL261 cells treated with TMZ 50 µM and TTX 30 µM over 96 h. The number of cells in the control group (CTR), TTX treatment alone, TMZ treatment alone, and the combination of TTX and TMZ are displayed. A significant increase in sensitivity to TMZ was observed when combined with TTX (D)(left) Immunoreactivity to the phospho p44/p42 ERK1/2 antibody (magenta channel) and nuclear staining (Hoeckst, blue channel) in control condition (CTR), after 72 h TTX 30 µM treatment alone (TTX) or combined with the ERK1 blocker PD098059. Scale bar is 50 micron. (right) Phospho-ERK Optical density (OD) violin plots illustrating single-cell measurements in CTR condition and after 72 h TTX 30 µM treatment. (E) Schematic representation of the timeline for the in vivo study. Mice were divided into two experimental groups: one group was stereotactically injected into the primary motor cortex (M1) with untreated GL261 cells (CTR) and the other with 72 h TTX-treated GL261 cells (TTX). TMZ treatment (40 mg/kg, intraperitoneal injection) commenced the day after cell injection and was administered daily for two weeks. (F) Left: Representative fluorescent image of Hoechst-stained coronal brain sections from GL261 tumor-bearing mice after two weeks of treatment. Scale bar = 1 mm. Right: Pool data analysis showing that the tumor size was significantly reduced in the TTX group compared to the CTR group. (G) Left: Representative images of proliferating Ki67-positive cells (red) within the glioma mass (cell bodies in blue) in the motor cortex of CTR and TTX mice 14 days after glioma injection. Scale bar = 500 μm. Right: The normalized fraction of tumor area occupied by Ki67-positive cells was significantly reduced in the TTX group compared to the CTR group

References

    1. Wu W, et al. Glioblastoma Multiforme (GBM): an overview of current therapies and mechanisms of resistance. Pharmacol Res. Sep. 2021;171:105780. 10.1016/j.phrs.2021.105780 - PMC - PubMed
    1. Colopi A, et al. Impact of age and gender on glioblastoma onset, progression, and management. Mech Ageing Dev. Apr. 2023;211:111801. 10.1016/j.mad.2023.111801 - PubMed
    1. Goenka A, Tiek D, Song X, Huang T, Hu B, Cheng S-Y. The many facets of Therapy Resistance and Tumor Recurrence in Glioblastoma. Cells. Feb. 2021;10(3):484. 10.3390/cells10030484 - PMC - PubMed
    1. Ohka F, Natsume A, Wakabayashi T. Current trends in targeted therapies for Glioblastoma Multiforme. Neurol Res Int. 2012;2012:1–13. 10.1155/2012/878425 10.1155/2012/878425 - DOI - PMC - PubMed
    1. Department of Neurosurgery, University Hospitals Leuven, Leuven, Belgium and S. De Vleeschouwer, Eds., Glioblastoma. Codon Publications. 2017. 10.15586/codon.glioblastoma.2017

MeSH terms