Review
. 2024 Aug 12:24:542-560.
doi: 10.1016/j.csbj.2024.08.005. eCollection 2024 Dec.

Unveiling the black box: A systematic review of Explainable Artificial Intelligence in medical image analysis

Affiliations
Review

Unveiling the black box: A systematic review of Explainable Artificial Intelligence in medical image analysis

Dost Muhammad et al. Comput Struct Biotechnol J. .

Abstract

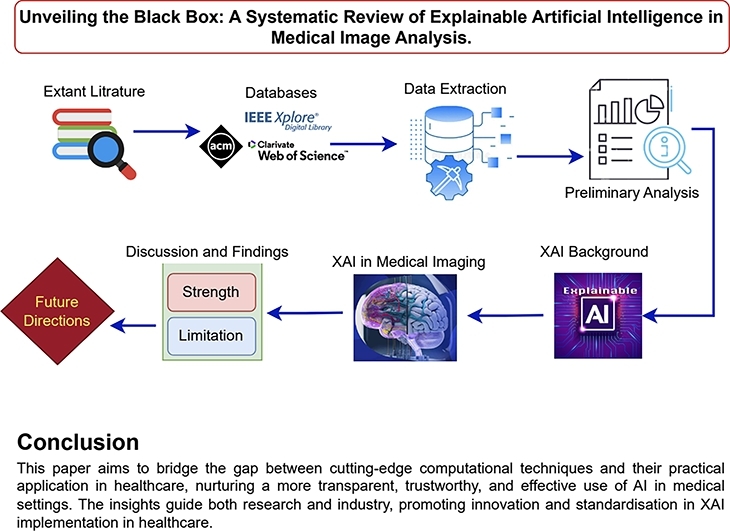
This systematic literature review examines state-of-the-art Explainable Artificial Intelligence (XAI) methods applied to medical image analysis, discussing current challenges and future research directions, and exploring evaluation metrics used to assess XAI approaches. With the growing efficiency of Machine Learning (ML) and Deep Learning (DL) in medical applications, there's a critical need for adoption in healthcare. However, their "black-box" nature, where decisions are made without clear explanations, hinders acceptance in clinical settings where decisions have significant medicolegal consequences. Our review highlights the advanced XAI methods, identifying how they address the need for transparency and trust in ML/DL decisions. We also outline the challenges faced by these methods and propose future research directions to improve XAI in healthcare. This paper aims to bridge the gap between cutting-edge computational techniques and their practical application in healthcare, nurturing a more transparent, trustworthy, and effective use of AI in medical settings. The insights guide both research and industry, promoting innovation and standardisation in XAI implementation in healthcare.

Keywords: Explainable AI; Medical image analysis; XAI in healthcare; XAI in medical imaging.


Conflict of interest statement

The authors have no conflict of interest.

Figures

None
Graphical abstract
Fig. 1
Fig. 1
Proposed framework for categorizing XAI methods based on taxonomies in extant literature.
Fig. 2
Fig. 2
Search string.
Fig. 3
Fig. 3
Flow diagram of our review, it shows the number of studies identified, screened and included in this review.
Fig. 4
Fig. 4
No. of publications per year.
Fig. 5
Fig. 5
RISE, Grad-CAM, OA and LIME explanations by , display human annotations and explanations generated by mentioned methods for a COVID-19 CT image. Each explanation technique highlights salient regions responsible for the prediction. Human annotations highlight different salient regions. In the generated explanations, red regions indicate areas contributing to the prediction when using RISE, Grad-CAM, and OA. LIME differentiates pixels supporting the prediction in green and those negating the prediction in red.
Fig. 6
Fig. 6
SHAP explanations by , illustrated feature importance using SHAP values. Each row in the figure represents a different feature, while each point corresponds to a sample. The colour gradient indicates the value of the feature: redder points signify larger values, while bluer points represent smaller values. In the context of mortality prediction, treated as a binary classification problem where 1 indicates death, the figure shows several red points on the right side of the SHAP values for features like CRP and LDH, suggesting that higher values of these features are associated with an increased risk of mortality. Conversely, for the lymphocyte feature, blue points are concentrated on the right, indicating that lower lymphocyte levels are linked to higher mortality. Overall, the figure demonstrates that elevated levels of LDH and CRP, along with reduced lymphocyte levels, are associated with a higher likelihood of death.
Fig. 7
Fig. 7
CAM visualization utilizing the Saliency map by , illustrates results for four examples, showing annotated input images, ROI patches, saliency maps for benign and malignant classes, and ROI patches with attention scores. The top example features a circumscribed oval mass in the left upper breast middle depth, diagnosed as a benign fibroadenoma via ultrasound biopsy. The second example displays an irregular mass in the right lateral breast posterior depth, diagnosed as invasive ductal carcinoma via ultrasound biopsy. The third example's saliency maps identify benign findings: a circumscribed oval mass confirmed as a benign fibroadenoma, a smaller oval mass recommended for follow-up, and an asymmetry that is stable and benign. The bottom example shows segmental coarse heterogeneous calcifications in the right central breast middle depth, diagnosed as high-grade ductal carcinoma in situ via stereotactic biopsy.
Fig. 8
Fig. 8
LRP, DTD and IG explanations by , present samples of heat maps for three classes: a. normal class, b. ADcR class, and c. ADsR class. The attributions were visualized with heat maps, highlighting important features for each diagnostic case. In all diagnostic cases, the boundary between the three TMJ components in contact with each other was highly activated. In some images, both the surface and the boundary of each component were activated. Despite the different approaches used for calculating explainability, the emphasis was consistently placed on the three TMJ components relevant to the diagnosis of TMJ ADD.

References

    1. Ranjbarzadeh R., Caputo A., Tirkolaee E.B., Ghoushchi S.J., Bendechache M. Brain tumor segmentation of mri images: a comprehensive review on the application of artificial intelligence tools. Comput Biol Med. 2023;152 - PubMed
    1. Bai J., Posner R., Wang T., Yang C., Nabavi S. Applying deep learning in digital breast tomosynthesis for automatic breast cancer detection: a review. Med Image Anal. 2021;71 - PubMed
    1. Leopold H., Singh A., Sengupta S., Zelek J., Lakshminarayanan V. Recent advances in deep learning applications for retinal diagnosis using oct. Tate Art Neural Netw. 2020
    1. Janik A., Dodd J., Ifrim G., Sankaran K., Curran K. Medical imaging 2021: image processing. vol. 11596. SPIE; 2021. Interpretability of a deep learning model in the application of cardiac mri segmentation with an acdc challenge dataset; pp. 861–872.
    1. Meyes R., de Puiseau C.W., Posada-Moreno A., Meisen T. Under the hood of neural networks: characterizing learned representations by functional neuron populations and network ablations. 2020. arXiv:2004.01254 arXiv preprint.

LinkOut - more resources