Moving beyond the mean: an analysis of faecal corticosterone metabolites shows substantial variability both within and across white-tailed deer populations
- PMID: 39252885
- PMCID: PMC11381565
- DOI: 10.1093/conphys/coae062
Moving beyond the mean: an analysis of faecal corticosterone metabolites shows substantial variability both within and across white-tailed deer populations
Abstract
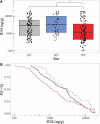
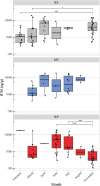
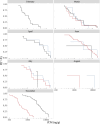
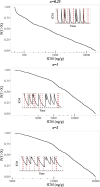
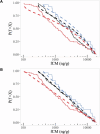
Glucocorticoid (GC) levels have significant impacts on the health and behaviour of wildlife populations and are involved in many essential body functions including circadian rhythm, stress physiology and metabolism. However, studies of GCs in wildlife often focus on estimating mean hormone levels in populations, or a subset of a population, rather than on assessing the entire distribution of hormone levels within populations. Additionally, explorations of population GC data are limited due to the tradeoff between the number of individuals included in studies and the amount of data per individual that can be collected. In this study, we explore patterns of GC level distributions in three white-tailed deer (Odocoileus virginianus) populations using a non-invasive, opportunistic sampling approach. GC levels were assessed by measuring faecal corticosterone metabolite levels ('fCMs') from deer faecal samples throughout the year. We found both population and seasonal differences in fCMs but observed similarly shaped fCM distributions in all populations. Specifically, all population fCM cumulative distributions were found to be very heavy-tailed. We developed two toy models of acute corticosterone elevation in an effort to recreate the observed heavy-tailed distributions. We found that, in all three populations, cumulative fCM distributions were better described by an assumption of large, periodic spikes in corticosterone levels every few days, as opposed to an assumption of random spikes in corticosterone levels. The analyses presented in this study demonstrate the potential for exploring population-level patterns of GC levels from random, opportunistically sampled data. When taken together with individual-focused studies of GC levels, such analyses can improve our understanding of how individual hormone production scales up to population-level patterns.
Keywords: Abbreviations: fCM, faecal corticosterone metabolite level; Faecal corticosterone; GC, glucocorticoid; HPA, hypothalamic–pituitary–adrenal; glucocorticoid modelling; glucocorticoids; hormone distributions.
© The Author(s) 2024. Published by Oxford University Press and the Society for Experimental Biology.
Conflict of interest statement
The authors have no conflicts of interest to declare.
Figures

Similar articles
-
Validation of two enzyme immunoassays for non-invasive glucocorticoid measurement in a lacertid lizard (Podarcis muralis): Effects of pharmacological and biological stimuli on faecal corticosterone metabolites and behaviour.Physiol Behav. 2025 Mar 1;290:114751. doi: 10.1016/j.physbeh.2024.114751. Epub 2024 Nov 15. Physiol Behav. 2025. PMID: 39549867
-
Assessing Stress in Arctic Lemmings: Fecal Metabolite Levels Reflect Plasma Free Corticosterone Levels.Physiol Biochem Zool. 2017 May/Jun;90(3):370-382. doi: 10.1086/691337. Epub 2017 Mar 8. Physiol Biochem Zool. 2017. PMID: 28384423
-
Effects of simulated environmental conditions on glucocorticoid metabolite measurements in white-tailed deer feces.Gen Comp Endocrinol. 2002 Jul;127(3):217-22. doi: 10.1016/s0016-6480(02)00056-4. Gen Comp Endocrinol. 2002. PMID: 12225762
-
Non-invasive measurement of glucocorticoids: Advances and problems.Physiol Behav. 2019 Feb 1;199:229-243. doi: 10.1016/j.physbeh.2018.11.021. Epub 2018 Nov 20. Physiol Behav. 2019. PMID: 30468744 Review.
-
Bovine Viral Diarrhea Virus (BVDV) in White-Tailed Deer (Odocoileus virginianus).Front Microbiol. 2016 Jun 20;7:945. doi: 10.3389/fmicb.2016.00945. eCollection 2016. Front Microbiol. 2016. PMID: 27379074 Free PMC article. Review.
References
-
- Anderson CW, Nielsen CK, Schauber EM (2015) Survival and dispersal of white-tailed deer in the agricultural landscape of east-Central Illinois. Wildlife BiolPractice 11: 26–41. 10.2461/wbp.2015.11.5. - DOI
-
- Baker MR, Gobush KS, Vynne CH (2013) Review of factors influencing stress hormones in fish and wildlife. J Nat Conserv 21: 309–318. 10.1016/j.jnc.2013.03.003. - DOI
LinkOut - more resources
Full Text Sources
Miscellaneous

