[Preprint]. 2024 Aug 28:2024.08.27.24312631.
doi: 10.1101/2024.08.27.24312631.

Biological Insights from Schizophrenia-associated Loci in Ancestral Populations

Tim B Bigdeli  1   2   3   4 Chris Chatzinakos  2   3 Jaroslav Bendl  5   6   7   8 Peter B Barr  1   2   3   4 Sanan Venkatesh  5   6   7   8   9 Bryan R Gorman  10 Tereza Clarence  5   6   7   8 Giulio Genovese  11   12 Conrad O Iyegbe  7 Roseann E Peterson  1   2   3 Sergios-Orestis Kolokotronis  3   4   13   14 David Burstein  5   6   7   8   9   15 Jacquelyn L Meyers  2   3   4 Yuli Li  16   17 Nallakkandi Rajeevan  16   17 Frederick Sayward  16   17 Kei-Hoi Cheung  16   17 Project Among African-Americans to Explore Risks for Schizophrenia (PAARTNERS)Consortium on the Genomics of Schizophrenia (COGS)Genomic Psychiatry Cohort (GPC) InvestigatorsLynn E DeLisi  18 Thomas R Kosten  19   20 Hongyu Zhao  16   17 Eric Achtyes  21 Peter Buckley  22 Dolores Malaspina  8 Douglas Lehrer  23 Mark H Rapaport  24 David L Braff  25   26 Michele T Pato  27 Ayman H Fanous  28   29 Carlos N Pato  27 PsychAD ConsortiumCooperative Studies Program (CSP) #572Million Veteran Program (MVP)Grant D Huang  30 Sumitra Muralidhar  30 J Michael Gaziano  10   11 Saiju Pyarajan  10 Kiran Girdhar  5   6   7   8 Donghoon Lee  5   6   7   8 Gabriel E Hoffman  5   6   7   8   9   15 Mihaela Aslan  16   17 John F Fullard  5   6   7   8 Georgios Voloudakis  5   6   7   8   9   15 Philip D Harvey  31   32 Panos Roussos  5   6   7   8   9   15
Affiliations

Biological Insights from Schizophrenia-associated Loci in Ancestral Populations

Tim B Bigdeli et al. medRxiv. .

Abstract

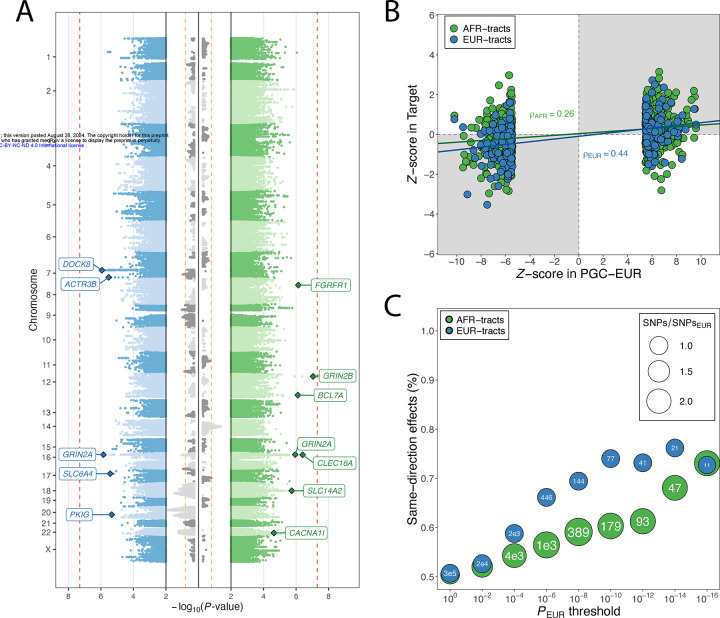
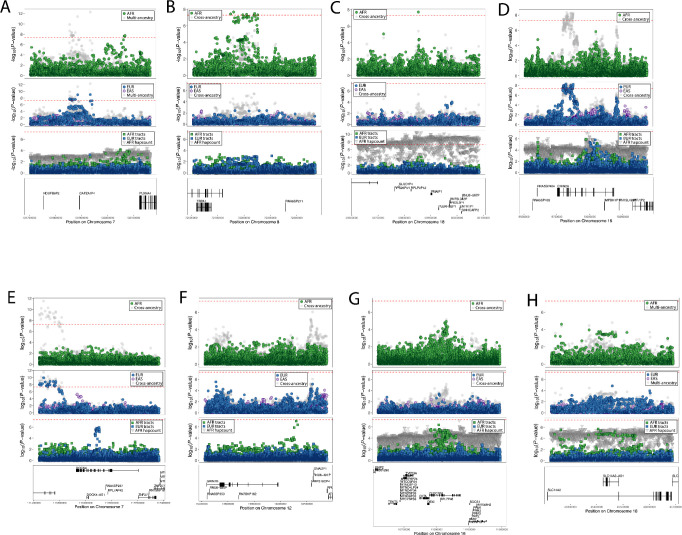
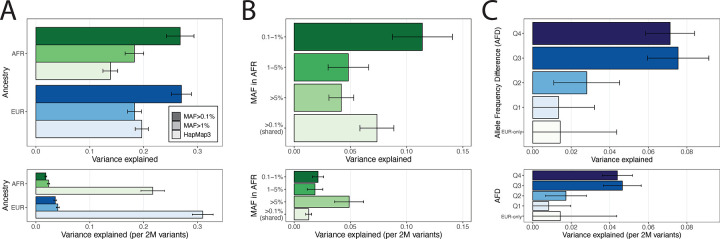
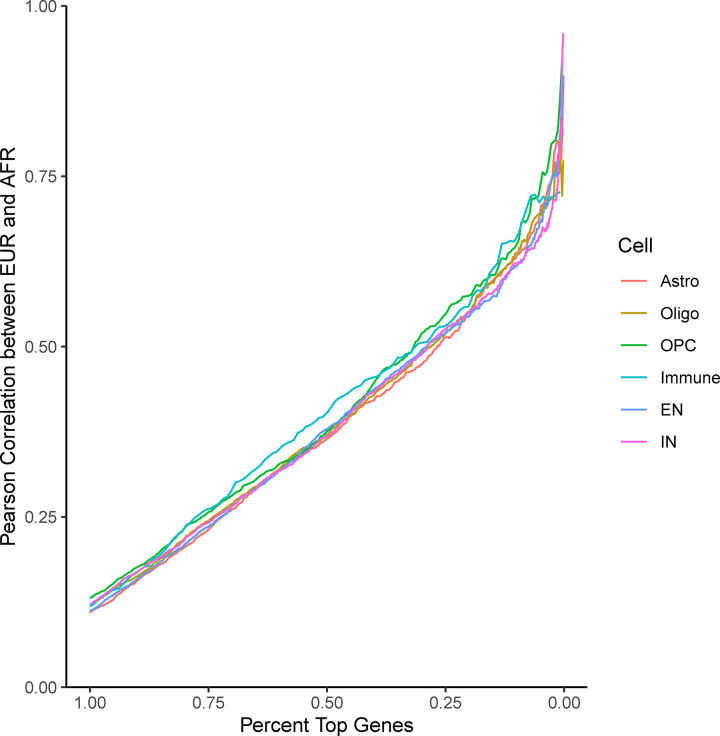
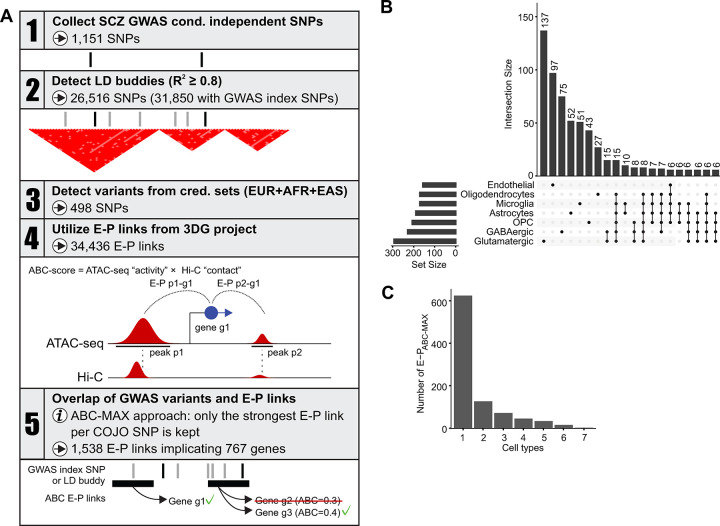
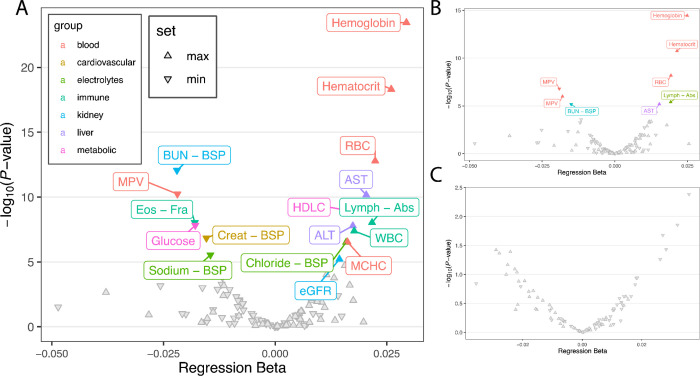
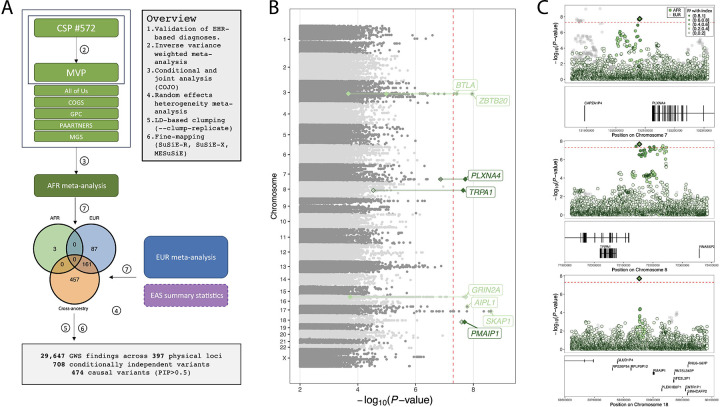
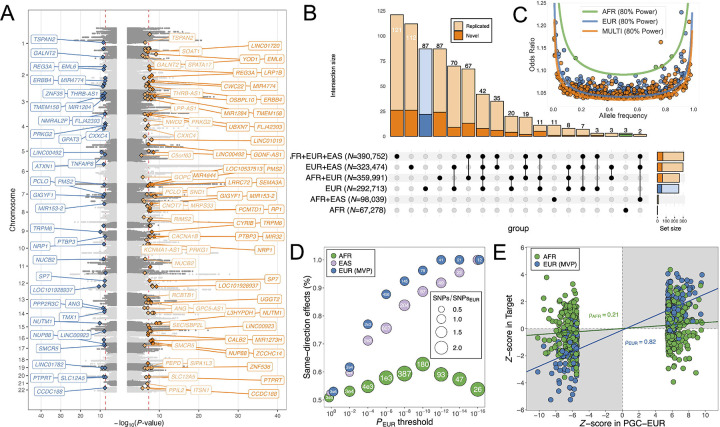
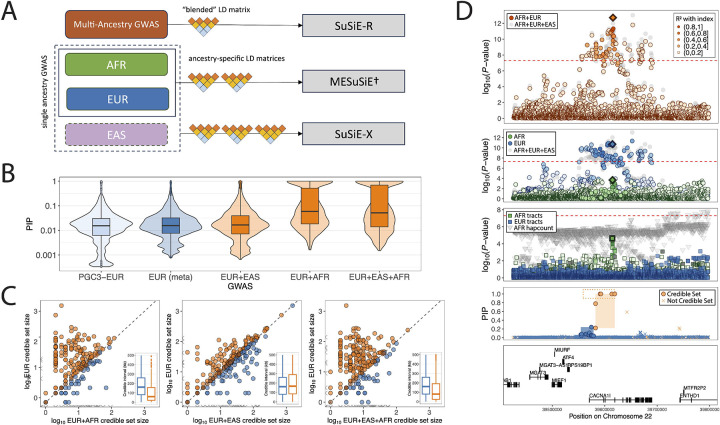
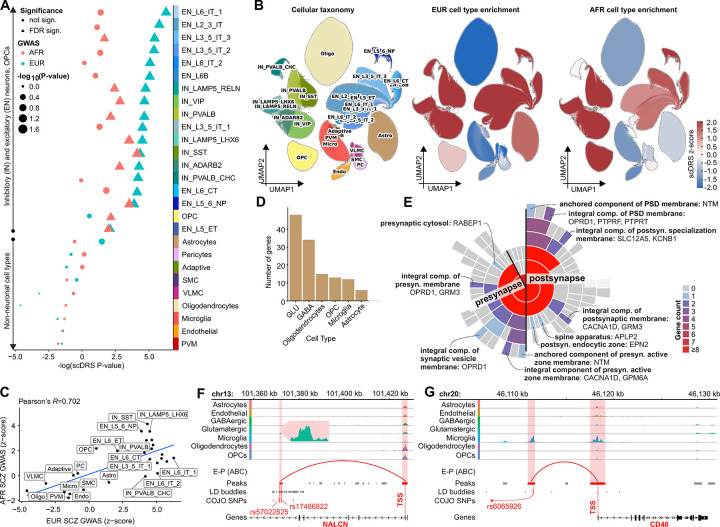
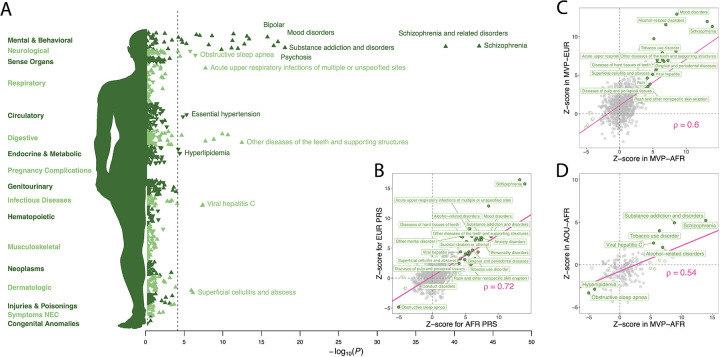
Large-scale genome-wide association studies of schizophrenia have uncovered hundreds of associated loci but with extremely limited representation of African diaspora populations. We surveyed electronic health records of 200,000 individuals of African ancestry in the Million Veteran and All of Us Research Programs, and, coupled with genotype-level data from four case-control studies, realized a combined sample size of 13,012 affected and 54,266 unaffected persons. Three genome-wide significant signals - near PLXNA4, PMAIP1, and TRPA1 - are the first to be independently identified in populations of predominantly African ancestry. Joint analyses of African, European, and East Asian ancestries across 86,981 cases and 303,771 controls, yielded 376 distinct autosomal loci, which were refined to 708 putatively causal variants via multi-ancestry fine-mapping. Utilizing single-cell functional genomic data from human brain tissue and two complementary approaches, transcriptome-wide association studies and enhancer-promoter contact mapping, we identified a consensus set of 94 genes across ancestries and pinpointed the specific cell types in which they act. We identified reproducible associations of schizophrenia polygenic risk scores with schizophrenia diagnoses and a range of other mental and physical health problems. Our study addresses a longstanding gap in the generalizability of research findings for schizophrenia across ancestral populations, underlining shared biological underpinnings of schizophrenia across global populations in the presence of broadly divergent risk allele frequencies.


Figures

Extended Data Fig. 1.
Extended Data Fig. 1.. Tract-based GWAS results and cross-ancestry concordance.
A) Miami plot displaying tract-level association results from the joint analysis of EUR tracts (left), AFR tracts (right), and haplotype count (center). Selected, suggestive findings (P<10−5) within 100kb of a protein-coding gene are highlighted. In the center panel, the haplotype count results are plotted directionally to indicate which ancestral haplotype is risk-increasing. B) Standardized effect estimates for AFR- and EUR-tracts at genome-wide significant SNPs in PGC-EUR, with regression lines; panels shaded in gray contain findings with directionally concordant effects. C) Comparison of directional concordance of AFR- and EUR-tract based results with PGC-EUR findings.
Extended Data Fig. 2.
Regional association plots displaying distinct ancestry-specific evidence of association. In each plot, the top panel displays AFR and multi-ancestry meta-analysis results; the middle panels display EUR and EAS results; and the third panel displays results for deconvolved AFR and EUR tracts and AFR haplotype count; genic context is displayed underneath.
Extended Data Fig. 3.
Extended Data Fig. 3.. SNP-based heritability of schizophrenia in AFR and EUR individuals.
A) Estimates of SNP-based h2 based on progressively more inclusive SNP criteria, comparing HapMap3 SNPs with SNPs with population-specific MAF greater than 1% or 0.1%. B) In AFR individuals, partitioned SNP-h2 for SNPs shared with EUR populations and those unique to the AFR dataset, binned by AFR-specific MAF. C) In EUR individuals, partitioned SNP-h2 for SNPs present only in EUR and those shared with AFR populations, binned by absolute frequency difference (AFD) between EUR and AFR. In each figure, the upper panel displays the total SNP-h2 and the lower panel displays SNP-h2 scaled by the number of SNPs used to calculate the genetic related matrix (GRM), respectively. SNP-h2 is reported on the liability scale, based on an expected population prevalence of 1%, to enhance interpretability with respect to the published literature; observed scale estimates are reported in Supplementary Tables 21–24.
Extended Data Fig. 4.
Line represents the pearson correlation between EUR and AFR schizophrenia TWAS amongst the top X% (x-axis) ranked TWAS genes (ranked by fixed-effect meta-analysis performed on scaled z-scores from each ancestry TWAS). Color represents the cell-type in which each TWAS was performed. Genes are limited to those which are imputable within both ancestries in each cell-type. Imputable genes are considered passing cross-validation R2 (R2CV) ≥ 0.01, pCV ≤ 0.05 and SNPs in model > 0. R2CV and pCV values are prediction performance R2 and prediction performance p-value from the “predict db” software.
Extended Data Fig. 5.
A) Schematic of the overall strategy to connect risk variants associated with schizophrenia to their causal genes. B) Numbers of nominated causal genes and their overlaps among major brain cell types (minimum intersection size for plotting: 6). C) Histogram of distribution of E-PABC across major brain cell types.
Extended Data Fig. 6.
Extended Data Fig. 6.. Association of AFR-trained PRS with common laboratory tests (LabWAS).
A) Volcano plot displaying tested associations in all participants. Highlighted points were significant following Bonferroni adjustment for multiple-testing. Upwards and downwards facing triangles indicate if an observed association is with the highest or lowest observed values across participants’ EHRs. B) Corresponding results based on AFR screened controls. C) Corresponding results based on case-only analysis.
Figure 1 |
Figure 1 |. Overview of AFR and cross-ancestry meta-analyses.
(A) Stages 1 and 2 of AFR meta-analysis, and incorporation of summary statistics for EUR and EAS, with summaries of GWAS variants, conditionally independent signals, causal variants, and physical loci. (B) Manhattan plot of discovery (Stage 1) AFR GWAS of schizophrenia in CSP #572 and MVP. Loci achieving genome-wide significance in discovery (Stage 1) (light green text) and meta-analysis (Stage 2) (dark green text) stages are highlighted; empty and filled diamonds represent the corresponding P-values in each stage. Index variants absent in AFR meta-analysis are displayed by an empty diamond. (C) Regional association plots for the three genome-wide significant loci in the AFR meta-analysis; (green dots, where the shade represents the strength of LD with the index variant (a diamond); corresponding results for EUR meta-analysis are displayed (grey dots).
Figure 2 |
Figure 2 |. Cross-ancestry schizophrenia meta-analyses.
(A) Miami plot displaying expanded EUR results (left; 59,965 cases and 232,748 controls) and cross-ancestry findings (right; 86,981 cases and 303,771 controls). Each conditionally independent lead variant within 1Mb is displayed as a diamond; novel findings in expanded EUR meta-analyses (blue); novel findings in cross-ancestry GWAS (orange); novel variants in analyses of two ancestries are also shown (lighter shades). (B) Upset Plot displaying the distribution of distinct index SNPs across updated EUR meta-analysis and cross-ancestry meta-analyses. The total number of conditionally independent SNPs for each are displayed in the lower left panel. Single-ancestry (blue) EUR versus cross-ancestry (orange) meta-analyses are highlighted. (C) Frequencies and Odds Ratios for COJO SNPs in EUR, AFR, and cross-ancestry meta-analyses, with respect to the alternative (tested) allele. Corresponding 80% power lines are displayed. (D) Comparison of directional concordance across single-ancestry meta-analysis results. (E) Standardized effect estimates for MVP-EUR and AFR at genome-wide SNPs in PGC3-EUR, with regression lines; panels shaded in grey contain findings with directionally concordant effects.
Figure 3 |
Figure 3 |. Improved fine-mapping resolution in cros-ancestry schizophrenia GWAS.
(A) Overview of fine-mapping approaches employed and their particular handling of cross-ancestry LD information. (B) Distribution of PIP values for SNPs in credible sets identified for PGC-EUR (6,234), EUR meta-analysis (8,066), EUR and EAS (7,931), EUR and AFR (2,514), and cross-ancestry meta-analysis of EUR, EAS, and AFR (3,467). Values are transformed to the log10-scale (C) Comparative improvements in fine-mapping resolution from cross-ancestry versus EUR-only analyses. Each point represents a credible set of SNPs in a given meta-analysis; points above the dotted line indicate a smaller credible set size in the trans-ancestry meta-analysis; grey points along axes indicate signals which SuSiE-R did not detect as causal. Inset panels display these distributions as split violin plots. (D) Regional findings at CACNA1I with EUR with EUR+AFR meta-analysis results (upper), and deconvolved AFR tracts and haplotype counts (lower).
Figure 4 |
Figure 4 |. Cell-type specific heritability patterns and disease regulation in schizophrenia.
(A) Enrichment of EUR and AFR for 27 cell subtypes from the single cell atlas of the prefrontal cortex. (B) UMAP visualizations of single cell atlas colored by the cell taxonomy (left), EUR enrichment (middle) and AFR enrichment (right). IN: inhibitory neurons / GABAergic, EN: excitatory neurons / glutamatergic, SMC: smooth muscle cells, VLMC: vascular leptomeningeal cells, PVM: Perivascular macrophages. (C) Correlation of scDRS z-score across cell subtypes between EUR and AFR. (D) Number of causal genes per cell type, stratified by E-PABC-MAX, TWAS, and shared nominations (top). Shared nominations are also displayed separately in the bottom plot for better clarity. (E) Mapping of prioritized genes in the synaptic structure using the SynGO database. The sunburst plot positions the synapse at its core, with layers for pre- and post-synaptic regions in the first ring, followed by specific categories in outer rings. The color coding represents the gene count for each category. (F-G) Normalized snATAC-seq pseudobulk tracks demonstrating the cell-specific regulation of the NALCN (E) and CD40 (F) affected by GWAS COJO SNPs rs6065926 and rs17486822/rs57022825
Figure 5 |
Figure 5 |. Pleiotropic influences of AFR-derived PRS across diseases.
(A) PheWAS results for an independent AFR-derived PRS tested against 1,650 disease categories in MVP. The dotted line indicates the Bonferroni adjusted P-value threshold for the number of tests. (B) Effect sizes for AFR PRS and EUR PRS tested in AFR participants; highlighted points were significant in tests of AFR PRS and labeled if replicated using EUR PRS (P<0.05). (C) Effect sizes of AFR PRS tested in AFR participants in MVP and AOU; highlighted points were significant in AFR participants, and labeled if replicated in AOU (P<0.05). (D) Effect sizes of AFR PRS tested in AFR and EUR participants in MVP; highlighted points were significant in AFR participants, and labeled if replicated in EUR (P<0.05). Unfilled points (empty circles) represented significant findings in MVP AFR that were not replicated.

Similar articles

References

    1. van der Ven E. et al. Ethnoracial Risk Variation Across the Psychosis Continuum in the US: A Systematic Review and Meta-Analysis. JAMA Psychiatry 81, 447–455 (2024). - PMC - PubMed
    1. Nagendra A. et al. Neighborhood socioeconomic status and racial disparities in schizophrenia: An exploration of domains of functioning. Schizophr. Res. 224, 95–101 (2020). - PubMed
    1. Anglin D. M. Racism and Social Determinants of Psychosis. Annu. Rev. Clin. Psychol. 19, 277–302 (2023). - PubMed
    1. International Schizophrenia, Consortium et al. Common polygenic variation contributes to risk of schizophrenia and bipolar disorder. Nature 460, 748–752 (2009). - PMC - PubMed
    1. Ikeda M. et al. Genome-wide association study of schizophrenia in a Japanese population. Biol. Psychiatry 69, 472–478 (2011). - PubMed

Publication types

LinkOut - more resources