. 2024 Aug 6;27(9):110683.
doi: 10.1016/j.isci.2024.110683. eCollection 2024 Sep 20.

Spastin regulates ER-mitochondrial contact sites and mitochondrial homeostasis

Affiliations

Spastin regulates ER-mitochondrial contact sites and mitochondrial homeostasis

Amelie Raby et al. iScience. .

Abstract

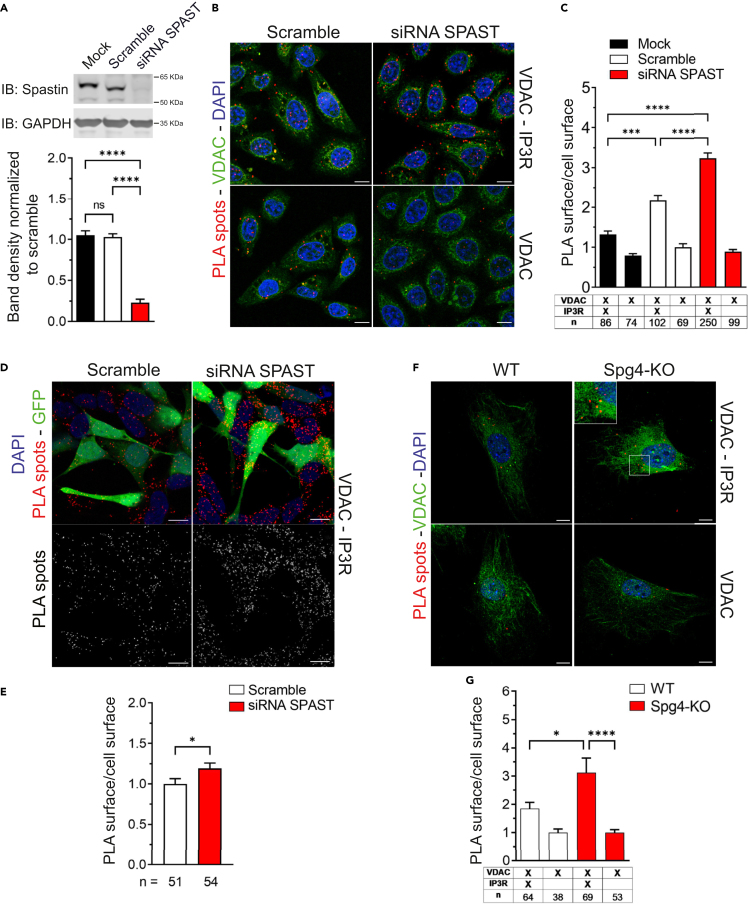
Mitochondria-endoplasmic reticulum (ER) contact sites (MERCs) emerged to play critical roles in numerous cellular processes, and their dysregulation has been associated to neurodegenerative disorders. Mutations in the SPG4 gene coding for spastin are among the main causes of hereditary spastic paraplegia (HSP). Spastin binds and severs microtubules, and the long isoform of this protein, namely M1, spans the outer leaflet of ER membrane where it interacts with other ER-HSP proteins. Here, we showed that overexpressed M1 spastin localizes in ER-mitochondria intersections and that endogenous spastin accumulates in MERCs. We demonstrated in different cellular models that downregulation of spastin enhances the number of MERCs, alters mitochondrial morphology, and impairs ER and mitochondrial calcium homeostasis. These effects are associated with reduced mitochondrial membrane potential, oxygen species levels, and oxidative metabolism. These findings extend our knowledge on the role of spastin in the ER and suggest MERCs deregulation as potential causes of SPG4-HSP disease.

Keywords: Biological sciences; Molecular biology; Molecular interaction.


Conflict of interest statement

The authors declare no competing interests.

Figures

None
Graphical abstract
Figure 1
Figure 1
Spastin partially colocalizes with mitochondria and accumulates in MERCs (A) Representative images of HeLa cells cotransfected with M1-GFP (green) and mito-mCherry (red) and relative fluorescence intensities for the indicated linear regions measured by line scan analysis along the mito-mcherry staining (dotted lines in magnified inbox, overlay). Arrows indicate representative overlaps between M1-GFP puncta and mitochondria. Scale bar, 10 μm. (B) Representative live-cell image of HeLa cells expressing M1-GFP (green) and mito-mCherry (red). Time-lapse images of boxed area reveal interaction between M1-GFP puncta (arrows) and dynamic mitochondrion over the entire video. Time is indicated in min:sec. Scale bar, 10 μm. (C) HeLa cells were transfected with M1-GFP, fixed, and then stained for TOM20 and calreticulin to visualize mitochondria and ER, respectively. Arrows in the inbox indicate representative overlaps between M1-GFP puncta, ER, and mitochondria. Scale bar, 10 μm. (D) Line scan analysis of the intensity fluorescence along the TOM20 staining (dot line in the overlay inbox) reveals partial overlaps between mitochondria, ER, and M1-GFP. (E) Quantification of the overlap as percentage between M1-GFP and TOM20 or calreticulin and TOM20 or M1-GFP and calreticulin staining. Data are shown as mean ± SEM. One-way ANOVA Tukey’s multiple comparisons test. ∗∗∗p < 0.005; ∗∗∗∗p < 0.001; ns, not significant. n, number of cells analyzed. (F) Immunoblots of subcellular fractions isolated from HeLa cells, mouse brain, or mouse liver tissues. The following markers were used: IP3R3 for the ER, VDAC1, and cytochrome c (Cyt C) for mitochondria (Mp, mito pure), SigmaR1 for MAMs (MERCs), and β-tubulin for cytosol (Cyt). H: homogenate. All markers were enriched in their respective compartments. The close apposition between ER and mitochondria membranes at MAMs explained the presence of both VDAC1 and IP3R3 in these microdomains.
Figure 2
Figure 2
Depletion of spastin increases the number of MERCs (A–C) HeLa cells were mock transfected or treated with scramble or siRNA SPAST for 72 h. Cells were then lysed or fixed and processed for WB and PLA, respectively. (A) Representative immunoblot of protein extracts for spastin and GAPDH and quantification of the band densities normalized to both GAPDH and scramble condition. (B) Cells were costained for VDAC1 (cat# ab15895) and IP3R (cat# 610312, upper panels) or labeled only for VDAC1 (bottom panels) as control. Cells were then processed for PLA as described in MM. (C) Quantification of the surface of PLA-positive spots per surface of the cell. Data are normalized to scramble condition stained only with VDAC1. (D) SH-SY5Y cells were treated twice with scramble or siRNA SPAST for 72 h and then fixed and processed for PLA. SH-SY5Y cells were cotransfected with GFP to better visualize their morphology. Cells were costained for VDAC1 (cat# ab14734) and IP3R (cat# ab5804). (E) Quantification of the surface of PLA-positive spots in GFP-positive cell per area of each cell shown in (D). Data are normalized to scramble condition. (F) Mouse embryonic fibroblasts from WT or Spg4-KO mice were fixed, costained for VDAC1 (cat# ab15895) and IP3R (cat# 610312, upper panels) or labeled only for VDAC1 (bottom panels) and processed for PLA. (G) Quantification of the surface of PLA signal per area of each cell shown in (F). Data are normalized to WT fibroblasts stained only with VDAC1. Data are shown as mean ± SEM. One-way ANOVA Tukey’ or Sidak’s multiple comparisons test. ∗p < 0.05; ∗∗∗p < 0.005; ∗∗∗∗p < 0.001; ns, not significant. n, number of cells analyzed. Scale bars, 10 μm.
Figure 3
Figure 3
MERCs deregulation in spastin-lacking cells does not correlate with altered microtubule dynamics (A) HeLa cells were mock transfected or treated with scramble or siRNA SPAST for 72 h as described in MM, then their protein extracts were analyzed by immunoblot. (B) Quantification of the band densities in (A). Data are normalized to GAPDH and scramble conditions. No significant statistical difference was observed. (C–F) Spg4-KO or WT MEF were cultured, and proteins were extracted and analyzed by immunoblot (C and D) or cells were fixed and costained for acetylated (red) and tyrosinated (green) tubulin (E and F). Scale bar, 20 μm. (D) Quantification of the band densities of the immunoblot in (C). Data were normalized to both GAPDH and WT signal. (F) Ratio between acetylated and tyrosinated average fluorescence intensities measured for each cell in (E). (G) HeLa cells were treated with scramble or siRNA SPAST for 48 h, then transfected with GFP-tagged full-length mouse spastin M1 (M1-GFP) or mutated forms of the protein (M1CY-GFP, M1RC-GFP, or M1Δ-GFP), fixed after 24 h and finally processed for PLA using VDAC1 (cat# ab14734) and IP3R (cat# ab5804) antibodies. Scale bars, 10 μm. (H) Quantification of PLA surface spots in GFP-positive cells per area of each cell shown in (G). Data are normalized to scramble condition. Data are shown as mean ± SEM. One-way ANOVA Tukey’s multiple comparisons test for (B), (D), and (H), unpaired Student’s t test for (F). ∗p < 0.05; ∗∗∗∗p < 0.001. ns, not significant. n, number of cells analyzed.
Figure 4
Figure 4
Decreased spastin expression alters mitochondria morphology (A–D) HeLa cells were mock transfected or treated with scramble or siRNA SPAST for 72 h, then fixed and stained for TOM20 (A and B) or processed for transmission electronic microscopy (C and D). (A) Representative images of HeLa cells treated with siRNA, fixed and stained for TOM20. Scale bars, 10 μm. (B) Images in (A) were segmented as described in MM, and the total mitochondrial surface was quantified and normalized by the surface of each cell. (C) Representative TEM images of HeLa cells treated with siRNA. Scale bar, 1 μm. (D) Quantification of both the average length (major axis of the equivalent ellipse) and the perimeter of mitochondria (M) in (C). Data are shown as mean ± SEM. One-way ANOVA Dunnett’s or Tukey’s multiple comparisons test. ∗p < 0.05; ∗∗∗∗p < 0.001; ns, not significant. n, number of cells analyzed. m, number of mitochondria analyzed.
Figure 5
Figure 5
Ca2+ dysregulation in spastin-deficient cells (A–C) Kinetics of reticular (A), cytosolic (B), and mitochondrial (C) Ca2+ in HeLa cells treated with scramble or siRNA SPAST for 72 h. Where indicated, recombinant aequorin-transfected cells were treated with 100 μM histamine (Hist). Reticular Ca2+ concentration ([Ca2+]er) peaks: scramble 241.49 ± 15.35, siRNA SPAST 196.71 ± 11.07; cytosolic Ca2+ concentration ([Ca2+]c) peaks: scramble 1.74 ± 0.078, siRNA SPAST 1.25 ± 0.05; mitochondrial Ca2+ concentration ([Ca2+]m peaks: scramble 73.79 ± 4.60, siRNA SPAST 55.77 ± 5.33. (D–F) Experiments analogous to (A–C) were carried out in SH-SY5Y cells. In these cells, the agonist used was 500 μM carbachol (Cch). [Ca2+]er peaks: scramble 337.2 ± 17.35, siRNA SPAST 271.2 ± 15.90; [Ca2+]c peaks: scramble 0.936 ± 0.080, siRNA SPAST 0.686 ± 0.068; [Ca2+]m peaks: scramble 2.33 ± 0.237, siRNA SPAST 1.123 ± 0.181. (G–I) Measurements of [Ca2+] using recombinant aequorin upon agonist stimulation (100 μM ATP) in MEF from WT or Spg4-KO mice. [Ca2+]er peaks: WT 198.41 ± 32.73, Spg4-KO 124.94 ± 10.39; [Ca2+]c peaks: WT 1.34 ± 0.048, Spg4-KO 1.06 ± 0.06. [Ca2+]m peaks: scramble 85.58 ± 4.77; Spg4-KO 65.22 ± 5.28. Data are shown as mean ± SEM. Unpaired Student’s t test. ∗p < 0.05; ∗∗p < 0.01; ∗∗∗p < 0.005; ∗∗∗∗p < 0.001; N, number of experiments analyzed.
Figure 6
Figure 6
Reduction of spastin expression impairs ROS production (A and B) HeLa cells were mock transfected or treated with scramble or siRNA SPAST for 72 h. Cells were then incubated with 2.5 μM MitoSOX for 30 min and imaged live. Cells were then incubated with 20 μM antimycin A for 10 min to induce ROS production. (C–F) Mouse fibroblasts from WT or Spg4-KO mice were loaded with 2.5 μM MitoSOX for 30 min and imaged live (C and D) or processed by FACS (E and F). Cells were then incubated with 20 μM antimycin A for 10 min to induce ROS production. Data are shown as mean ± SEM. One-way ANOVA Sidak’s multiple comparisons test. ∗p < 0.05; ∗∗p < 0.01; ∗∗∗p < 0.005; ∗∗∗∗p < 0.001; ns, not significant. n, number of cells analyzed. N, number of experiments analyzed. Scale bars, 10 μm. In (A) and (C), MitoSOX fluorescence intensity is shown as pseudo colors.
Figure 7
Figure 7
Mitochondrial membrane potential (ΔΨm) is decreased in spastin-deficient cells (A and B) HeLa or SH-SY5Y (C and D) cells were treated with scramble or siRNA SPAST for 72 h and then incubated for 30 min with 100 nM or 400 nM TMRM, respectively. Cells were imaged live at resting conditions and then treated with 10 μM FCCP to induce dissipation of ΔΨm. Scale bars, 10 μm; ∗, nuclei. Dotted lines show typical analyzed cells. TMRM fluorescence intensity is shown as pseudo colors. (B and D) Quantification of TMRM fluorescence intensity shown in (A and C). (E and F) WT or Spg4-KO MEF were coincubated for 30 min with 100 nM TMRM and 100 nM MitoTracker green and imaged live for 15 min. Scale bars, 20 μm. Note that MitoTracker green fluorescence intensity is unaffected between WT and Spg4-KO MEF and by 10 μM FCCP treatment. Data are shown as mean ± SEM. One-way ANOVA Sidak’s multiple comparisons test. ∗p < 0.05; ∗∗p < 0.01; ∗∗∗p < 0.005; ∗∗∗∗p < 0.001. n, number of cells analyzed.
Figure 8
Figure 8
OXPHOS is altered in Spg4-KO MEF (A) Representative graph of mitochondrial respiration quantified by mitochondrial stress tests performed in WT and Spg4-KO MEF obtained from two different WT and Spg4-KO embryos, respectively. (B) Comparison of different bioenergetic parameters between WT and Spg4-KO MEF. Data were obtained from at least 20 replicates for each biological sample. (C) Total ATP levels were measured in protein extracts from four different WT and Spg4-KO MEF lines. Each sample has been analyzed in technical triplicate and the experiments repeated at least two times. Data are normalized to the total ATP levels measured in WT samples. N, number of MEF lines analyzed. Data are shown as mean ± SEM. One-way ANOVA Sidak’s multiple comparisons test for (B) and unpaired Student’s t test for (C). ∗p < 0.05; ∗∗p < 0.01; ∗∗∗p < 0.005; ∗∗∗∗p < 0.001; ns, not significant.

References

    1. Roll-Mecak A., Vale R.D. Structural basis of microtubule severing by the hereditary spastic paraplegia protein spastin. Nature. 2008;451:363–367. doi: 10.1038/nature06482. - DOI - PMC - PubMed
    1. Kuo Y.W., Howard J. Cutting, Amplifying, and Aligning Microtubules with Severing Enzymes. Trends Cell Biol. 2021;31:50–61. doi: 10.1016/j.tcb.2020.10.004. - DOI - PMC - PubMed
    1. Lo Giudice T., Lombardi F., Santorelli F.M., Kawarai T., Orlacchio A. Hereditary spastic paraplegia: clinical-genetic characteristics and evolving molecular mechanisms. Exp. Neurol. 2014;261:518–539. doi: 10.1016/j.expneurol.2014.06.011. - DOI - PubMed
    1. Mohan N., Qiang L., Morfini G., Baas P.W. Therapeutic Strategies for Mutant SPAST-Based Hereditary Spastic Paraplegia. Brain Sci. 2021;11 doi: 10.3390/brainsci11081081. - DOI - PMC - PubMed
    1. Fink J.K. Hereditary spastic paraplegia: clinico-pathologic features and emerging molecular mechanisms. Acta Neuropathol. 2013;126:307–328. doi: 10.1007/s00401-013-1115-8. - DOI - PMC - PubMed

LinkOut - more resources