[Preprint]. 2024 Aug 27:2024.08.27.609789.
doi: 10.1101/2024.08.27.609789.

Temporally discordant chromatin accessibility and DNA demethylation define short and long-term enhancer regulation during cell fate specification

Affiliations

Temporally discordant chromatin accessibility and DNA demethylation define short and long-term enhancer regulation during cell fate specification

Lindsey N Guerin et al. bioRxiv. .

Update in

Abstract

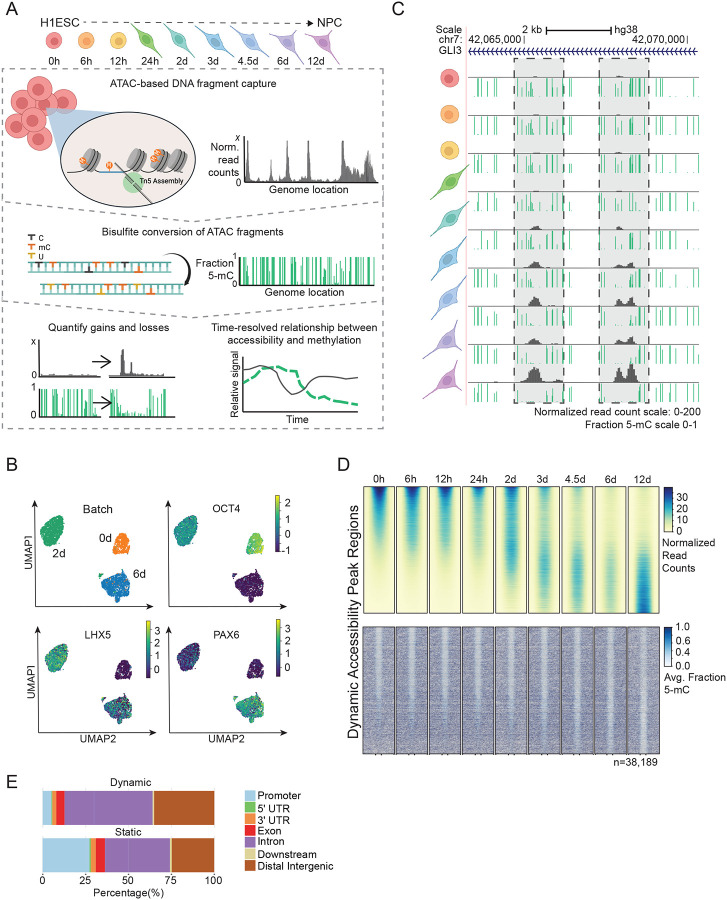
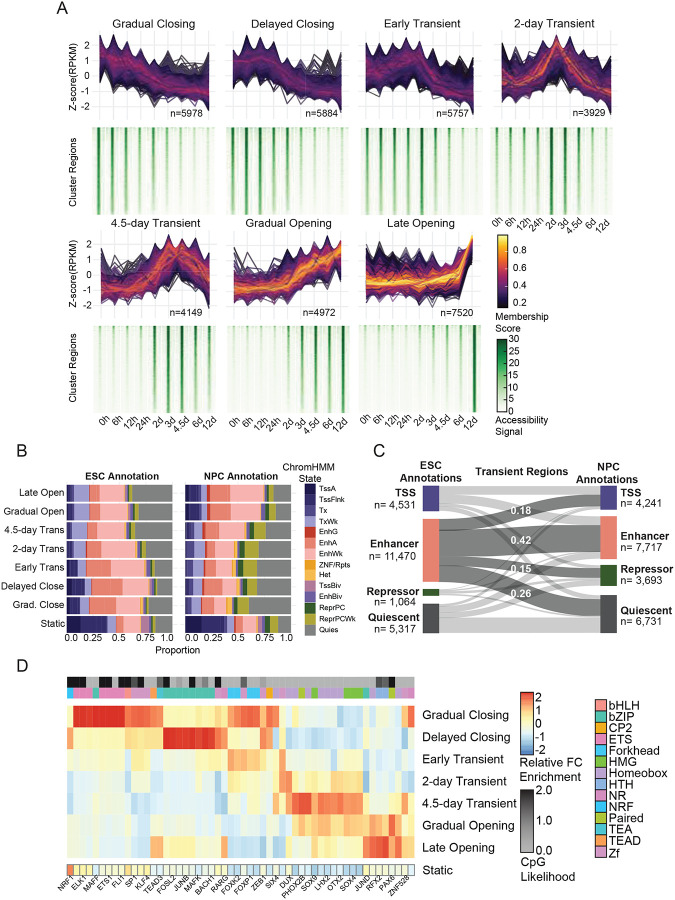
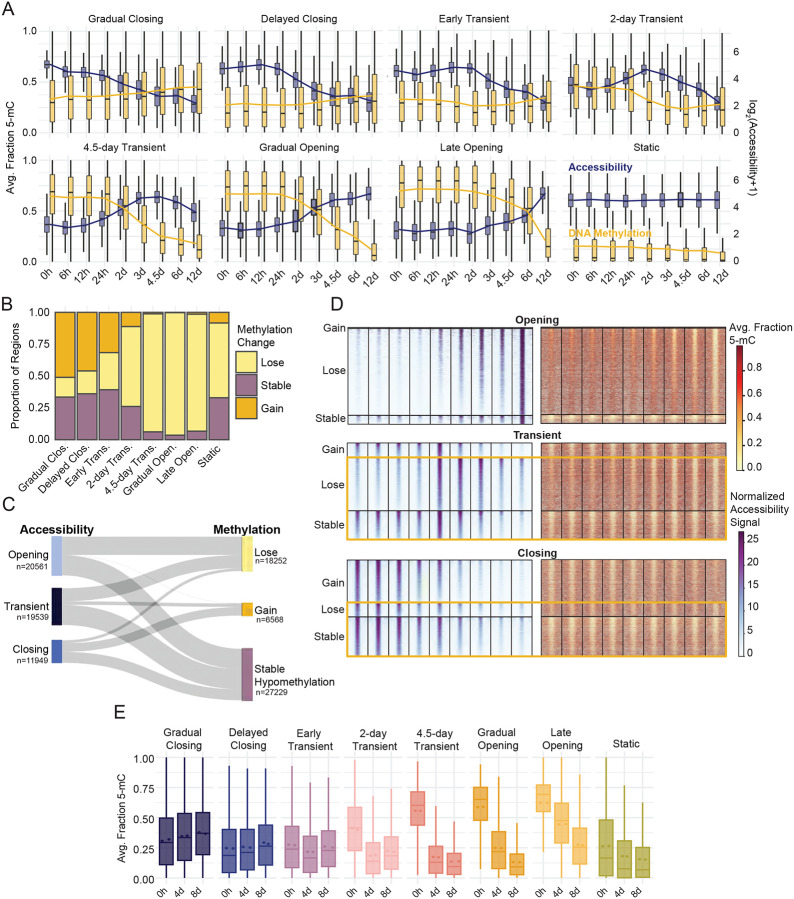
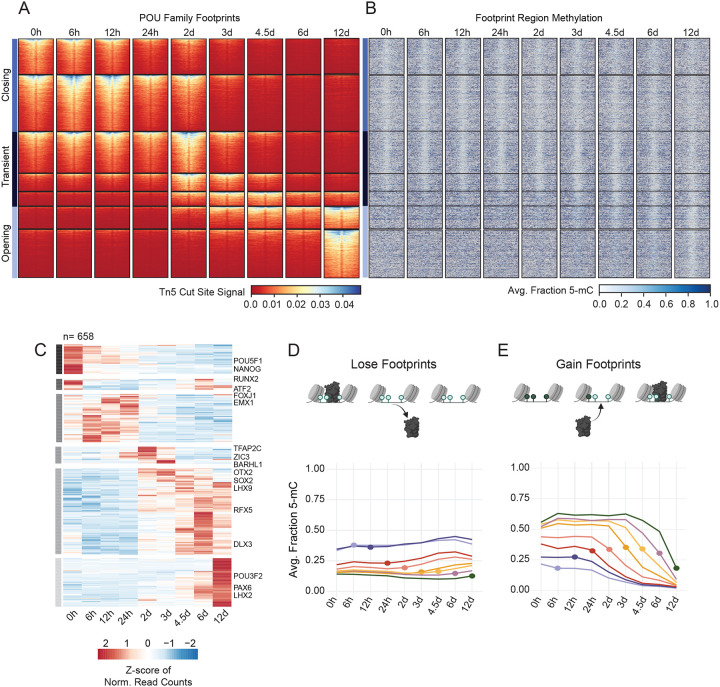
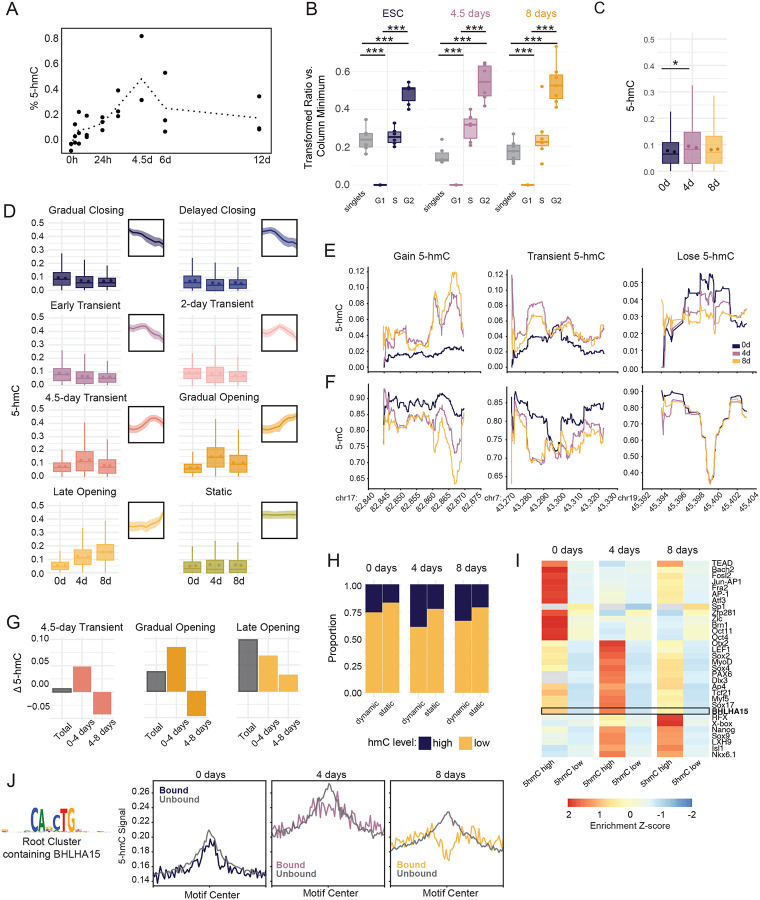
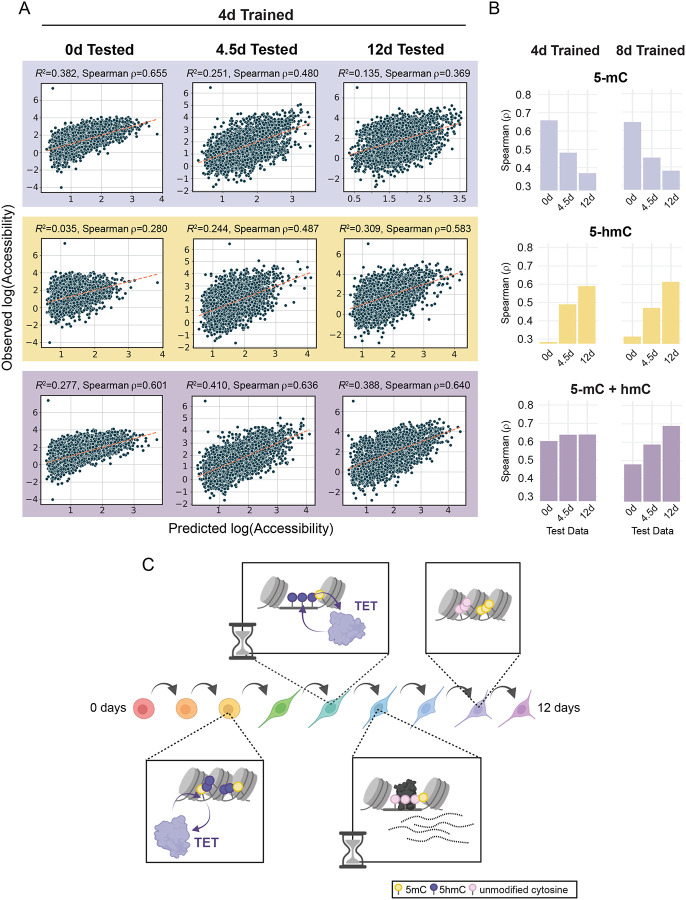
Epigenetic mechanisms govern the transcriptional activity of lineage-specifying enhancers; but recent work challenges the dogma that joint chromatin accessibility and DNA demethylation are prerequisites for transcription. To understand this paradox, we established a highly-resolved timeline of DNA demethylation, chromatin accessibility, and transcription factor occupancy during neural progenitor cell differentiation. We show thousands of enhancers undergo rapid, transient accessibility changes associated with distinct periods of transcription factor expression. However, most DNA methylation changes are unidirectional and delayed relative to chromatin dynamics, creating transiently discordant epigenetic states. Genome-wide detection of 5-hydroxymethylcytosine further revealed active demethylation begins ahead of chromatin and transcription factor activity, while enhancer hypomethylation persists long after these activities have dissipated. We demonstrate that these timepoint specific methylation states predict past, present and future chromatin accessibility using machine learning models. Thus, chromatin and DNA methylation collaborate on different timescales to mediate short and long-term enhancer regulation during cell fate specification.

Keywords: 5-hydroxymethylation; 6-base sequencing; ATAC-Me; Chromatin Accessibility; DNA Methylation; Differentiation; Enhancers; Epigenetics; Machine Learning; Neural Progenitor Cells.


Conflict of interest statement

DECLARATION OF INTERESTS F.P., A.J., and T.C. are employees of biomodal, formerly Cambridge Epigenetix. All other authors declare no competing interests.

Figures

Figure 1:
Figure 1:. Directed differentiation of HESCs to NPCs displays extensive DNA demethylation within chromatin accessibility loci.
(A) The experimental design of ATAC-Me consists of four main steps. HESCs are differentiated to NPCs for 12 days and samples are taken at nine time points throughout the differentiation process. DNA fragments are isolated from Tn5 accessible chromatin followed by sodium bisulfite conversion to quantify methylation state of open chromatin regions. Analysis of resulting data captures dynamic behaviors of DNAme and ChrAcc over time. (B) UMAPs of single cell RNA-seq data for samples analyzed at 0, 2 and 6 days of differentiation. Groups (Batches) segregate according to timepoint and homogeneously express markers of ESCs (OCT4), intermediate NPCs (LHX5), and differentiated NPCs (PAX6). Marker gene overlays are scaled by normalized and transformed read count values. (C) UCSC Genome Browser tracks display ATAC-Me derived DNAme and ChrAcc measurements at the GLI3 locus. Grey boxes highlight two regions that gain accessibility and lose DNAme. The fraction methylated reads at each CpG site is represented by the height of the green bar. Accessibility is represented by normalized read counts shown in grey. Both tracks are merged signal of two replicates. (D) Heatmaps display the ChrAcc and DNAme signal of all dynamic ChrAcc peaks at each time point. Regions are sorted by decreasing normalized read count signal intensity at the 0-hour time point. Regions are scaled to 500 bp and plotted along the center of each +/− 0.5 kilobases and 1 kilobases for ChrAcc and DNAme, respectively. (E) Proportion of dynamic (n=38,189) and static (n=63026) regions annotated to genomic region classes is shown. Related to Figure S1.
Figure 2:
Figure 2:. Unsupervised clustering of chromatin accessibility reveals temporally distinct regulatory groups with divergent changes in enhancer states.
(A) ChrAcc regions with differential accessibility over time (|log2-fold| > 2, adjusted p-value < 0.05) were clustered using fuzzy C-means clustering. The standard difference of normalized ATAC-Me signal intensity (z-score) over time for each region within a cluster is shown, with line color representing the membership score defined by that cluster. Heatmaps displaying the normalized accessibility signal across the cluster regions for each timepoint are shown below. Heatmaps are sorted by decreasing normalized read count signal intensity at the 0-hour time point for each cluster. The region count for each cluster is displayed. (B) Chromatin state annotations of cluster regions using the chromHMM 18-state annotations from HESCs and NPCs. The proportion of regions in each state for the cluster is displayed for all dynamic and static regions. (C) A Sankey plot displays the change in regions’ chromatin states from the ESC to NPC stages for all Transient regions. (D) Motif enrichment was performed for each dynamic ChrAcc group using HOMER. The relative enrichment (z-score of enrichment values across all dynamic clusters) of the topmost variable TFs are shown and are filtered for motif redundancy. For a comprehensive list, see Table S3. The enrichment score of the same motifs in static regions is also shown. TF family is displayed as an annotation column along with CpG content likelihood. CpG likelihood in each TF consensus motif is calculated as described in Motto. Related to Figure S2.
Figure 3:
Figure 3:. DNAme dynamics are unidirectional and temporally discordant with chromatin accessibility.
(A) Dual-axis boxplots of accessibility signal distribution (normalized read counts, blue) for each timepoint grouped by dynamic TCseq clusters. A pseudocount is added and the displayed data is log transformed for display. The corresponding average fraction methylation distribution across each region group and timepoint is shown in gold. The boxplots display the median of the signal distribution, and the line overlay represents the average signal at each timepoint. (B) The proportion of regions within each accessibility cluster that experience a gain, loss or no change in methylation over time. Regions were grouped based on the change of average regional methylation values over the entire time course, 0 to 12 days. The stable methylation group represents those regions which showed a change less than 10% between the 0 hour and 12-day time point. Methylation classification of “lose” or “gain” indicates a change of at least 10% in the average methylation between the 0 hour and 12-day timepoints in either direction. (C) The temporal relationship between accessibility and methylation behaviors represented by a Sankey plot. Accessibility subgroups represent dynamic regions from all TCseq clusters. Clusters were grouped by their dominant accessibility trend (i.e., opening, transient and closing) while the methylation classification from (B) was maintained. (D) Regional methylation and accessibility are displayed for all dynamic accessible regions. Heatmaps are grouped by accessibility subgroup then methylation behavior, the methylation classification from (B) was maintained. Yellow boxes highlight regions which display discordant epigenetic states by the end of the time course. (E) Average fraction DNAme values determined by whole genome 6-base sequencing across regions contained in each ChrAcc cluster are shown. 6-base sequencing was performed on samples collected at 0, 4, and 8 days of differentiation. Regional methylation values represent the average fraction methylation from two biological replicates. Related to Figure S3.
Figure 4:
Figure 4:. Enhancer demethylation appears prior to, and is maintained independently of, TF binding.
(A) Heatmaps display cut site signal centered around TF footprint sites containing POU family motifs +/−200bp. Footprint sites are defined by POU motif sequences +/− 50bp. Regions are grouped by previously defined accessibility clusters and organized within each cluster according to descending cut site signal intensity. Horizontal bars indicate the larger subgroups defined by accessibility behavior over the time course. (B) The methylation heatmap displays the corresponding proportion methylation at each CpG site within in the footprint site with a flanking distance of +/−1kb. Regions are sorted according to (A). (C) Heatmap displays TF expression determined by RNA-seq for all TFs expressed at any time point. Normalized read counts (FPKM) are scaled by row and ordered by hierarchical clustering. Horizontal grey bars define six groups with specific temporal expression patterns. Select TFs are labeled to the right of their respective rows. (D, E) Line plots show average regional methylation values over time visualized by TF binding behavior. The dot represents the time point of the TF binding event, or the time point at which a motif transitions from being bound to unbound (lose events, E) or vice versa (gain events, D). Related to Figure S4.
Figure 5:
Figure 5:. Early and sustained accumulation of 5-hmC demarcates demethylation timing at lineage specifying enhancers
(A) Dotted line plot shows the average global %5-hmC of biological replicates measured by ELISA at nine timepoints. Individual biological replicates are shown as black dots. Each biological replicate is the average of two technical replicates. % 5-hmC is determined via standard curve. (B) Boxplots display the distribution of 5-hmC signal across cell cycle stages for each timepoint. 5-hmC was measured by immunostaining and flow cytometry and is displayed as a transformed ratio versus the minimum median signal intensity using Cytobank. The transformed ratio was calculated using the minimum within each sample group (timepoint, See Methods). Events were gated into cell cycle stage using PI/BrdU staining, which is shown in Figure S5B. ANOVA and Tukey HSD were used to compare 5-hmC across cell cycle stages (p-value <2e-16 for all comparisons). (C) Boxplots show average proportion 5-hmC (reads reporting 5-hmC/total reads) at CpG sites within dynamic accessible peaks at 2, 4, and 8 days. 5-hmC proportion was measured using whole genome 6-base sequencing for two biological replicates. The mean proportion 5-hmC of individual replicates is shown for each timepoint as colored dots, *, p= 0.0365, one-sided t-test. (D) Boxplots display the average proportion 5-hmC (reads reporting 5-hmC/total reads) of CpG sites across regions in each accessibility cluster. Individual biological replicate means are displayed as points within the boxplot. Thumbnail visualizations of accessibility signal for each cluster are displayed. (E) Representative traces for proportion 5-hmC and (F) proportion 5-mC at three genomic loci displaying different types of 5-hmC changes between the three time points. Chromosome and coordinates (x1,000) for each locus are printed below the plot. Proportion 5-hmC is calculated as the average number of reads reporting 5-hmC over the average total number of reads for two biological replicates. Proportion 5-mC is calculated as the average number of reads reporting 5-mC over the average total number of reads for two biological replicates. CpGs with coverage less than 15 reads over both replicates were excluded for this analysis. (G) The average change in proportion 5-hmC was calculated for ChrAcc regions in three representative dynamic ChrAcc clusters. “Total” represents the average difference between 8-day and 0-day timepoints, “0–4 days” represents the difference between 4-day and 0-day timepoints, and “4–8 days” represents the difference between 8-day and 4-day timepoints. (H) The proportion of static and dynamic ChrAcc regions with high or low 5-hmC within at each 6-base timepoint. Regions with an average fraction 5-hmC ≥ 0.106 (top 25% of regional 5-hmC fractions) across replicates were termed “high” and regions with an average fraction 5-hmC < 0.106 across replicates were termed “low”. (I) Heatmap displaying motif enrichment for 5-hmC high and 5-hmC low regions at each timepoint. Motif enrichment is displayed as the fold-change over background and is scaled by TF across each row. Grey boxes represent values that were not significant (>0.05) at the respective timepoint. The boxed row represents the motif enrichment for BHLHA15 which is selectively enriched in regions with high 5-hmC at 4 days. (J) Aggregate profiles display 5-hmC signal at TF footprints for the JASPAR root cluster containing BHLHA15 (shown to the left). TF footprinting and binding state designation was performed using TOBIAS. Profiles display signal at footprint sites with a flanking distance of +/−1000bp. Signal is binned into 25bp bins. Related to Figure S5.
Figure 6:
Figure 6:. Chromatin accessibility prediction by machine learning.
(A) Scatter plots display the observed accessibility versus the predicted accessibility for machine learning models trained on 4-day 5-hmC and 5-mC data (5-mC alone, 5-hmC alone, and 5-mC + 5-hmC). XGBoost models were trained on dynamic ChrAcc regions (excluding regions on chromosome 1) using methylation data from each singular timepoint (0, 4, and 8 days) and tested on regions from chromosome 1 at each timepoint. The spearman correlation coefficient is shown for each model. Dotted lines are defined by the slope between the points [minimum predicted value, minimum predicted value] and [maximum predicted value, maximum predicted value] in each scatterplot. (B) Bar plots of spearman ρ values (predicted vs. observed accessibility) for dynamic accessibility region models trained on 4-day or 8-day trained methylation data. Models were tested on all three timepoints in a similar fashion to those in A. Plots are divided by which methylation states were used for fitting. (C) A representative schematic of the molecular timeline proposed in this study. During the cell fate transitions that accompany NPC differentiation, enhancer regions that will be opened and activated first undergo 5-mC oxidation whereby 5-mC becomes 5-hmC (purple lollipops). This is followed by increases in accessibility and further oxidation, resulting in subsequent demethylation. TFs can bind these hydroxymethylated sites and facilitate the completion of demethylation while activating transcription of associated genes. Both the initial demethylation steps and the completion of the demethylation cycle are discretely timed events that occur between 2–6 days of differentiation. When an enhancer region is no longer required by the new cell fate, it loses TF binding and decreases in accessibility. However, the regions remain hypomethylated. Related to Figure S6.

References

    1. Barnett K.R., et al. (2020). ATAC-Me Captures Prolonged DNA Methylation of Dynamic Chromatin Accessibility Loci during Cell Fate Transitions. Mol Cell, 77, 1350–1364 e6. 10.1016/j.molcel.2020.01.004 - DOI - PMC - PubMed
    1. Kreibich E., et al. (2023). Single-molecule footprinting identifies context-dependent regulation of enhancers by DNA methylation. Molecular Cell, 83, 787–802.e9. 10.1016/j.molcel.2023.01.017 - DOI - PubMed
    1. Luo C., Hajkova P., and Ecker J.R.. (2018). Dynamic DNA methylation: In the right place at the right time. Science, 361, 1336–1340. doi: 10.1126/science.aat6806 - DOI - PMC - PubMed
    1. Greenberg M.V.C. and Bourc’his D.. (2019). The diverse roles of DNA methylation in mammalian development and disease. Nature Reviews Molecular Cell Biology, 20, 590–607. 10.1038/s41580-019-0159-6 - DOI - PubMed
    1. Cusack M., et al. (2020). Distinct contributions of DNA methylation and histone acetylation to the genomic occupancy of transcription factors. Genome Res, 30, 1393–1406. 10.1101/gr.257576.119 - DOI - PMC - PubMed

Publication types

LinkOut - more resources