[Preprint]. 2024 Aug 27:2024.08.27.609961.
doi: 10.1101/2024.08.27.609961.

The asymmetric opening of HIV-1 Env by a potent CD4 mimetic enables anti-coreceptor binding site antibodies to mediate ADCC

Affiliations

The asymmetric opening of HIV-1 Env by a potent CD4 mimetic enables anti-coreceptor binding site antibodies to mediate ADCC

Jonathan Richard et al. bioRxiv. .

Abstract

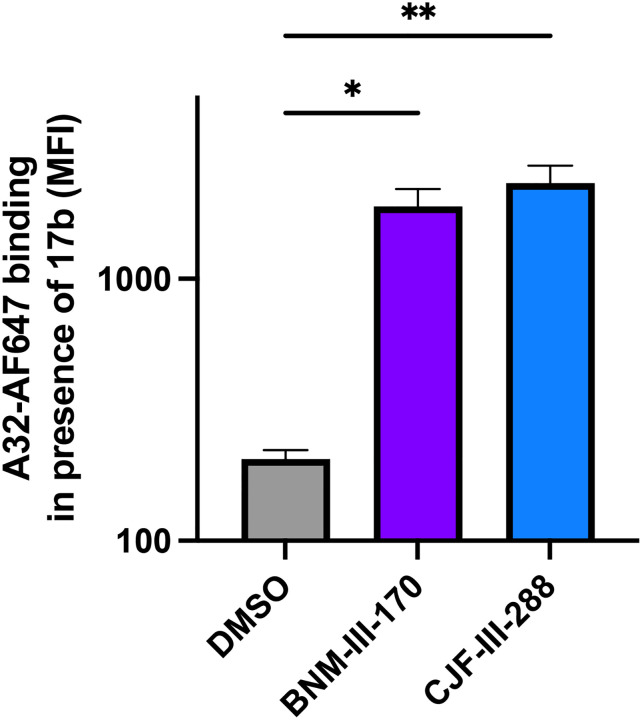
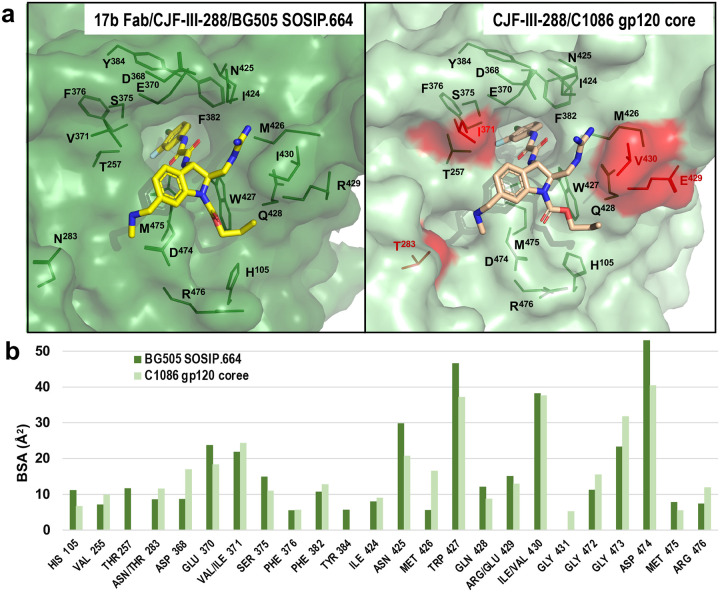
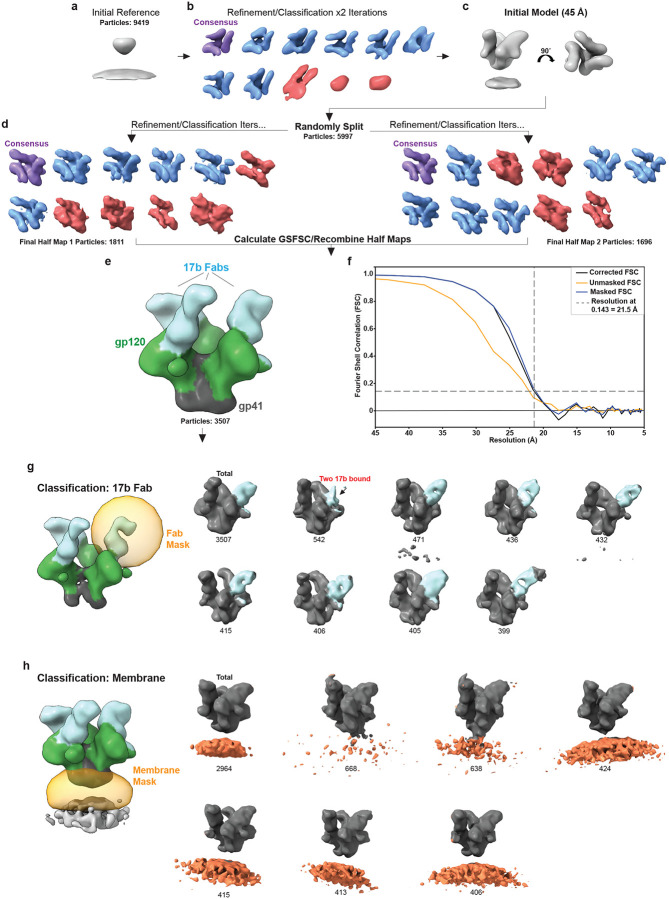
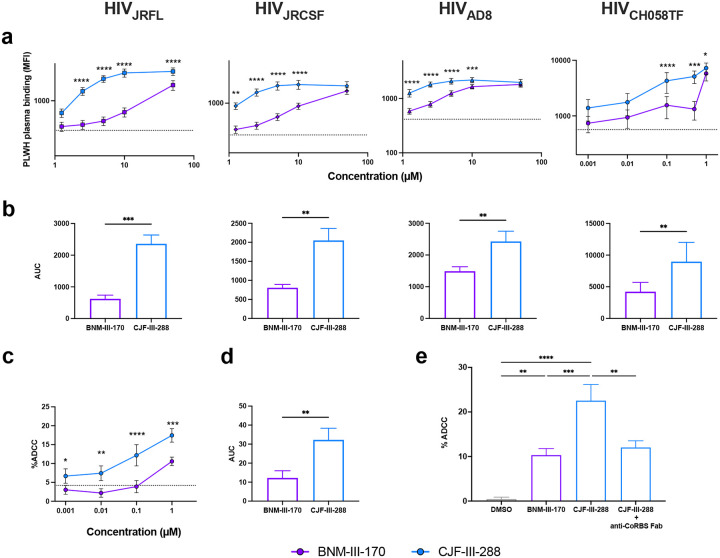
HIV-1 envelope glycoproteins (Env) from primary HIV-1 isolates typically adopt a pretriggered "closed" conformation that resists to CD4-induced (CD4i) non-neutralizing antibodies (nnAbs) mediating antibody-dependent cellular cytotoxicity (ADCC). CD4-mimetic compounds (CD4mcs) "open-up" Env allowing binding of CD4i nnAbs, thereby sensitizing HIV-1-infected cells to ADCC. Two families of CD4i nnAbs, the anti-cluster A and anti-coreceptor binding site (CoRBS) Abs, are required to mediate ADCC in combination with the indane CD4mc BNM-III-170. Recently, new indoline CD4mcs with improved potency and breadth have been described. Here, we show that the lead indoline CD4mc, CJF-III-288, sensitizes HIV-1-infected cells to ADCC mediated by anti-CoRBS Abs alone, contributing to improved ADCC activity. Structural and conformational analyses reveal that CJF-III-288, in combination with anti-CoRBS Abs, potently stabilizes an asymmetric "open" State-3 Env conformation, This Env conformation orients the anti-CoRBS Ab to improve ADCC activity and therapeutic potential.


Figures

Extended data Fig. 1.
Extended data Fig. 1.. CJF-III-288 and 17b combination enable recognition of HIV-1-infected cells by A32
Recognition of HIV-1CH058TF-infected primary CD4+ T cells by Alexa-Fluor-647 conjugated A32 in combination with 17b and DMSO, BNM-III-170 or CJF-III-288. Graphs represent the median fluorescence intensities (MFI) obtained in 3 independent experiments. Statistical significance was tested using One-way ANOVA test with a Tukey post-test (* p<0.05,** p<0.01).
Extended data Fig. 2.
Extended data Fig. 2.. Improved recognition of HIV-1BG505-infected cells by nnAbs in presence of CJF-III-288.
Recognition of HIV-1BG505-infected primary CD4+ T cells by anti-CoRBS Abs a, alone or b, in combination with anti-cluster A Abs, in the presence of indicated concentration of BNM-III-170 or CJF-III-288. Graphs represent the median fluorescence intensities (MFI) obtained in at least 4 independent experiments. The dashed lines represent the mean binding obtained in absence of CD4mc. Statistical significance was tested using Two-way ANOVA test with a Holm-Sidak post-test (* p<0.05,**** p<0.0001).
Extended data Fig. 3.
Extended data Fig. 3.. A32 binding and ADCC activity in presence of different concentrations of CD4mc.
a, Recognition of primary CD4+ T cells infected with indicated IMC by the anti-cluster A Abs A32 in the presence of indicated concentration of BNM-III-170 or CJF-III-288. Graphs represent the median fluorescence intensities (MFI) obtained in at least 4 independent experiments with each IMCs. b, ADCC-mediated elimination of CD4+ T cells infected HIV-1CH058TF by A32 in the presence of indicated concentration of BNM-III-170 or CJF-III-288. Shown are percentage of ADCC obtained in at least 4 experiments. The dashed lines represent the mean binding or ADCC obtained in absence of CD4mc.
Extended data Fig. 4.
Extended data Fig. 4.. Cryo-EM structure of the CJF-III-288-BG505 SOSIP.664-17b Fab complex.
a, Selected 2D classes for ab initio map reconstruction. Micrographs were collected using on a FEI Titan Krios electron microscope operating at 300 kV equipped with Gatan Bioquantum Image filter-K3 direct electron detector (Gatan Inc). b, The Fourier shell correlation curves (FSC cutoff 0.143) from the final non-uniform refinement step and the direction distribution plot of all particles used in the final refinement. c, Local resolution estimation. d, Density and corresponding model for CJF-III-288 from each protomer (protomer A corresponds to chain C, protomer B corresponds to chain A and protomer C corresponds to chain E).
Extended data Fig. 5.
Extended data Fig. 5.. Superimposition of the three protomers of the asymmetric trimer of the CJF-III-288-BG505-17b Fab complex
a, Superimposition of protomers. 17b, gp120 and gp41 in each protomer are shown as cartoons and CJF-III-288 is shown as sticks. Protomer A is colored green, protomer B colored cyan and protomer C colored yellow. The protomers were superimposed and the root-mean-square deviation (RMSD) values of Cα atoms between protomers calculated. The RMSD between protomers A and B, protomers A and C, and protomers B and C are 2.7 Å, 1.73 Å, 3.14 Å, respectively. b, Residues forming the binding pockets in each protomer. The RMSD values of Cα atoms of pocket residues are 0.565 Å, 0.563 Å, 0.524 Å for protomers A and B, protomers A and C, and protomers B and C, respectively.
Extended data Fig. 6.
Extended data Fig. 6.. Comparison of the CJF-III-288 binding pockets as in the CJF-III-288-BG505-17b Fab and the CJF-III-288-C1086 gp120 coree complexes.
a, The CJF-III-170 binding pocket (from Protomer A) is superimposed based upon gp120 to the complex of the CJF-III-288 gp20 coree (8FM3) . Strain specific residues in CJF-III-288-gp120 coree complex are highlighted red. b, Buried surface area (BSA) of gp120 residues buried at the CJF-III-288 binding interfaces.
Extended data Fig. 7.
Extended data Fig. 7.. CryoET refinement and classification workflow.
a, HIV-1BaL Env trimers in complex with CJF-III-288 and 17b Abs, along with the center of each virion, were manually picked using IMOD software. PEET program spikeInit was used to determine approximate particle orientations to generate an initial reference. b,c, Refinement and classification were performed to remove junk particles (red) and generate an initial model. Resolution was limited to 45 Å by strong lowpass filtration and binning. d, Particles were randomly split into two halves for further refinement. Classification was performed to select Env trimers bound to three 17b Abs (blue). e, Isosurface rendering of the structure. f, Fourier shell correlation calculated from the two half-maps. Resolution was estimated at FSC = 0.143. g, Masked classification of the 17b Fab domain with weaker density shows heterogeneity in the 17b binding orientation. h, Masked classification on the membrane for Env bound to three 17b shows tilting on the membrane. The number of particles in each subclass for g and h are shown.
Fig. 1
Fig. 1. CJF-III-288 sensitizes HIV-1-infected cells to ADCC mediated by various anti-CoRBS Abs.
a, Recognition and b, ADCC-mediated elimination of primary CD4+ T cells infected with HIV-1CH058TF by anti-cluster A Abs (A32 or N5i5) and anti-CoRBS Abs (17b), alone or in combination (at 5μg/ml total concentration), in the presence of 50 μM of indicated CD4mc or equivalent volume of DMSO. c, Recognition and d, ADCC-mediated elimination of primary CD4+ T cells infected with indicated IMCs by anti-cluster A and anti-CoRBS, alone or in combination, in the presence of 50 μM of indicated CD4mc or equivalent volume of DMSO. c-d, Shown are the median fluorescence intensities (MFI) and percentage of ADCC obtained in at least 3 experiments for each IMC. e, Recognition and f, ADCC-mediated elimination of primary CD4+ T cells infected with HIV-1CH058TF by indicated anti-CoRBS Abs in the presence of 50 μM of indicated CD4mc or equivalent volume of DMSO. e-f, Shown are the mean MFI and percentage of ADCC obtained from at least 3 experiments for each tested anti-CoRBS Abs (17b, N12i2, X5, C2, 412D and 48D). Statistical significance was tested using a-b, Two-way ANOVA test with a Tukey post-test, c-f one-way ANOVA with a Tukey post-test or Kruskal-Wallis test with a with a Holm-Sidak post-test based on the normality test. (* p<0.05,** p<0.01,*** p<0.001,**** p<0.0001)
Fig. 2
Fig. 2. CJF-III-288 outperforms BNM-III-170 at lower concentrations.
a-d, Recognition of primary CD4+ T cells infected with indicated IMC by anti-CoRBS Ab (17b) alone or in combination with anti-cluster A Ab (A32), in the presence of indicated concentration of BNM-III-170 or CJF-III-288. a,c, Graphs represent the median fluorescence intensities (MFI) obtained in at least 4 independent experiments with each IMCs . b,d, Graphs represent the area under the curve (AUC) calculated from the MFI obtained in a and c. e-h, ADCC-mediated elimination of CD4+ T cells infected HIV-1CH058TF by anti-CoRBS Abs alone or in combination with anti-cluster A Abs, in the presence of indicated concentration of BNM-III-170 or CJF-III-288. e,g, Shown are percentage of ADCC obtained in at least 4 experiments. f,h, Shown are the area under the curve (AUC) calculated from the percentage of ADCC obtained in e and g. The dashed lines represent the mean binding or ADCC obtained in absence of CD4mc. Statistical significance was tested using a,c,e,g, Two-way ANOVA test with a Holm-Sidak post-test, b,d,f,h paired t test or Wilcoxon test based on the normality test. (* p<0.05,** p<0.01,*** p<0.001,**** p<0.0001).
Fig. 3
Fig. 3. CJF-III-288 shows superior ADCC activity than BNM-III-170 against ex-vivo-expanded CD4+ T cells from PLWH.
a-d, Recognition of ex-vivo-expanded CD4+ T cells from four PLWH under ART by anti-CoRBS Abs alone or in combination with anti-cluster A Abs, in the presence of indicated concentration of BNM-III-170 or CJF-III-288. a,c, Graphs represent MFI obtained with each donor. b,d, Graphs represent the AUC calculated from the MFI obtained in a and c. e-h, ADCC-mediated elimination of ex-vivo-expanded CD4+ T cells from three PLWH under ART by anti-CoRBS Abs alone or in combination with anti-cluster A Abs, in the presence of indicated concentration of BNM-III-170 or CJF-III-288. e,g, Shown are percentage of ADCC obtained with each donor. f,h, Shown are the area under the curve (AUC) calculated from the percentage of ADCC obtained in in e and g. The dashed lines represent the mean binding or ADCC obtained in absence of CD4mc. Statistical significance was tested using a,c,e,g, Two-way ANOVA test with a Holm-Sidak post-test, b,d,f,h paired t test or Wilcoxon test based on the normality test. (* p<0.05,** p<0.01,*** p<0.001,**** p<0.0001)
Fig. 4
Fig. 4. Anti-CoRBS Abs contribute to the improved ADCC activity of PLWH plasma in the presence of CJF-III-288.
a,b, Recognition of primary CD4+ T cells infected with indicated IMC by PLWH plasma, in the presence of indicated concentration of BNM-III-170 or CJF-III-288. a, Shown are median fluorescence intensities obtained with plasma from 8 PLWH. b, Shown are the area under the curve (AUC) calculated from the MFI obtained in a. c,d, ADCC-mediated elimination of HIV-1CH058TF-infected primary CD4 T cells by plasma from PLWH in the presence of indicated concentration of BNM-III-170 or CJF-III-288. c, Shown are percentage of ADCC obtained with plasma from 8 PLWH. d, Shown are the AUC calculated from the ADCC values presented in c. The dashed lines represent the mean MFI or ADCC obtained in absence of CD4mc. e, ADCC-mediated elimination of HIV1-CH058TF-infected primary CD4 T cells preincubated or not with 17b Fab fragments, by plasma from PLWH in the presence of 1 μM of BNM-III-170 or CJF-III-288. Statistical significance was tested using a,c, Two-way ANOVA test with a Holm-Sidak post-test, b,d, paired t test or Wilcoxon test based on the normality test, e, One-way ANOVA with a Holm-Sidak post-test (* p<0.05,** p<0.01,*** p<0.001,**** p<0.0001)
Fig. 5
Fig. 5. CJF-III-288 in combination with anti-CoRBS Abs stabilize Env State 3
a,b Histograms of FRET values compiled from the population of individual HIV-1JRFLEnv trimers on the virion surface in the absence or presence of CD4mc (BNM-III-170 or CJF-III-288), the anti-CoRBS Ab 17b, or PLWH plasma. Histograms are presented as the mean determined from three technical replicates with error bars reflecting the standard error. Overlaid on the histograms are Gaussian distributions determined from HMM analysis of the individual FRET trajectories. Conformational state labels (States 1, 2, 2A, and 3), which have been previously identified,, are indicated on the corresponding Gaussian. c,d, The occupancies in States 1 and State 3 were calculated from the HMM analysis for each trace and represented with violin plots. c, The mean and median occupancy are shown as horizontal lines and circles, respectively. Vertical lines reflect the 25–75% quantiles. e, Correlation between State 1 and State 3 occupancy and ADCC mediated by plasma from PLWH d,e, Each shape represents a different plasma from PLWH. Statistical significance was tested using (c,d) one-way ANOVA with a Holm-Sidak post-test and (e) Spearman rank correlation test (* p<0.05,** p<0.01,*** p<0.001,**** p<0.0001, ns: not significant).
Fig. 6.
Fig. 6.. Cryo-EM structure of the CJF-III-288-BG505 SOSIP.664–17b Fab complex and a comparison of the binding pockets of CJF-III-288 and BNM-III-170 in BG505 SOSIP.664.
a, Left, the overall structure of CJF-III-288-BG505–17b Fab complex with a molecular surface displayed over gp120 and gp41, gp120 is colored dark green and gp41 is colored grey. The 17b Fab variable region is shown as a cartoon with darker and lighter shades of cyan for heavy and light chains respectively. A side view of the complex is shown. Middle, a blow-up view shows the details of the CJF-III-288 binding pocket. Secondary structures are shown within the pocket. Residues forming the pocket are colored magenta and are labeled. Right, comparison of the two binding pockets of CJF-III-288 and BNM-III-170 bound to BG505 SOSIP.664 (as in PDB 7LO6). Pockets in protomer A in each complex were selected to do the comparison. CJF-III-288 is shown as yellow sticks and BNM-III-170 is shown as orange sticks. The gp120 of CJF-III-288 and BNM-III-170 BG505 SOSIP.664 complexes are colored darker and lighter shades of green respectively. b, The residue-resolved buried-surface-area (BSA) of gp120 residues contributing to the CJF-III-288-protein and BNM-III-170-protein interfaces, as determined by PISA. BSA values represent the average of the three copies in the trimer. Residues present only in the CJF-III-288-BG505 SOSIP.664 complex are highlighted with magenta.
Fig. 7.
Fig. 7.. The CJF-III-288 versus the BNM-III-170-bound conformation of Env.
a, CJF-III-288-BG505 SOSIP.664–17b Fab and BNM-III-170-BG505 SOSIP.664–17b Fab (PDB:7LO6) complexes superimposed based upon gp120/gp41 protomers. Center, the gp120 and gp41 in the CJF-III-288 and BNM-III-170 complexes are shown as ribbons in darker and lighter shades of green/grey, respectively (the α0 helix is shown as red/blue). Right and left , blow-up views show the structural alignments of Protomers A, B and C; the 17b Fab is colored light and dark cyan for the BNM-III-170 complex and red for the CJF-III-288 complex. The angle of approach for 17b in each complex is shown by a line drawn from the center of gp41 (calculated as the average of gp41 α-carbon positions for residues 570–595 in both structures) and the center of mass of the Fab variable domain (calculated as the average α-carbon position for heavy and light chain variable residues) with the distance between the Fab centers shown above by a black arrow. b, Changes to the opening of the timer induced by CJF-III-288 or BNM-III-170. The CJF-III-288-BG505 SOSIP.664 and BNM-III-170-BG505 SOSIP.664 trimers are shown superimposed based upon gp120/gp41 protomers (colored as in panel a). Relative bound positions of 17b Fab from each complex are shown with heavy- and light-chain (VH and VL) positions determined by the center of mass of their α-carbon atoms (displayed as balls). The distance between the centers of the α0-helices in the two structures (calculated as the average of α-carbon atoms for residues 65–73) in the superimposed trimers is shown above with a black arrow indicating the rotation of the helix. c, Changes to overall Env trimer assembly, calculated based upon changes to the position of the α-carbon of S375 relative to the gp41 center (calculated as the average of the α-carbon positions of the central gp41 α7 helices, residues 570–595). Distances between the 375 Cα of each protomer (a, b c), the 375Cα and the gp41 center (d, e, f) and the angle between the gp41 center and two neighboring 375 Cα’s (α, β, γ) are shown.
Fig. 8
Fig. 8. CryoET structure of HIV-1 Env in complex with CJF-III-288 and 17b Abs on virions
a, AT-2 inactivated HIV-1BaL was incubated with 100 μM CJF-III-288 before addition of 100 μg/ml 17b Abs and subsequent plunge freezing for cryoET analysis. Tomographic slices of 17b Abs binding to Env on virions in the presence of CJF-III-288 are shown (blue: 17b, green: Env). b, Subtomogram averaging was performed on Env in complex with CJF-III-288 and 17b Abs (EMDB: 46646). A central slice along the density is shown. Panels to the right show three slices along the length of the structure. 17b Fabs, V1/V2 loops, and gp41 domains are indicated by arrows. c, Isosurface rendering of the structure. d, The atomic model of BG505 SOSIP.664 in complex with CJF-III-288 and 17b Fab was rigid fit into the cryoET density. e, The atomic model of BG505 SOSIP.664 in complex with BNM-III-170 and 17b Fab (PDB: 7LO6) was superimposed onto the gp41 helices of the CJF-III-288 atomic model (PDB:9CF5, this paper). The three 17b Fab domains from the BNM-III-170 structure (red) and the CJF-III-288 structure (blue) are compared for their agreement with the cryoET density. f, Focused classification on the 17b Fab revealed heterogeneity in the 17b binding angle. Two representative subclasses are shown (pink and yellow) and compared to the combined average (grey). g, The 17b Fab angle between subclass 1 and subclass 2 relative to the approximate position of N335 (green sphere) is shown for each protomer. h, Focused classification on the membrane region revealed subclasses at different tilting angles. Two representative subclasses (pink and yellow) are compared with the combined average density (grey). i, Per-particle tilting analysis. The polar plot coloring indicates the normalized frequency of angles (n = 3512). j, Histogram and box-and-whisker plot showing the distribution of Env tilting. The median, range, and interquartile ranges are shown. The most prominent four apparent modes are indicated by red circles and dashed lines.

References

    1. Antiretroviral Therapy Cohort C. Life expectancy of individuals on combination antiretroviral therapy in high-income countries: a collaborative analysis of 14 cohort studies. Lancet 372, 293–9 (2008). - PMC - PubMed
    1. Deeks S.G., Lewin S.R. & Havlir D.V. The end of AIDS: HIV infection as a chronic disease. Lancet 382, 1525–33 (2013). - PMC - PubMed
    1. Finzi D. et al. Identification of a reservoir for HIV-1 in patients on highly active antiretroviral therapy. Science 278, 1295–300 (1997). - PubMed
    1. Chomont N. et al. HIV reservoir size and persistence are driven by T cell survival and homeostatic proliferation. Nat Med 15, 893–900 (2009). - PMC - PubMed
    1. Chun T.W. et al. Presence of an inducible HIV-1 latent reservoir during highly active antiretroviral therapy. Proc Natl Acad Sci U S A 94, 13193–7 (1997). - PMC - PubMed

Publication types