

This is a preprint.
Predicting Alzheimer's Cognitive Resilience Score: A Comparative Study of Machine Learning Models Using RNA-seq Data
- PMID: 39253457
- PMCID: PMC11383294
- DOI: 10.1101/2024.08.25.609610
Predicting Alzheimer's Cognitive Resilience Score: A Comparative Study of Machine Learning Models Using RNA-seq Data
Abstract
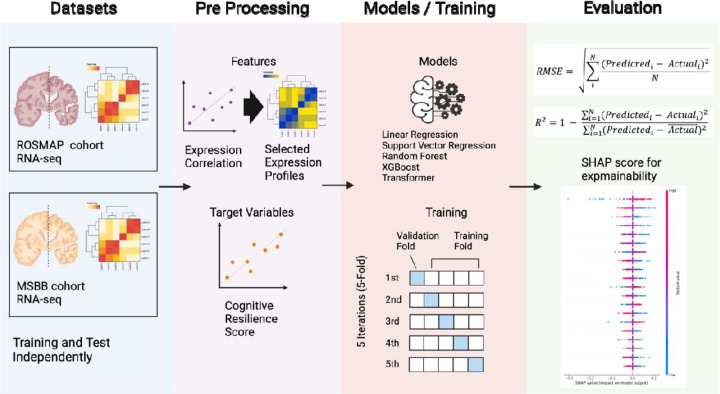
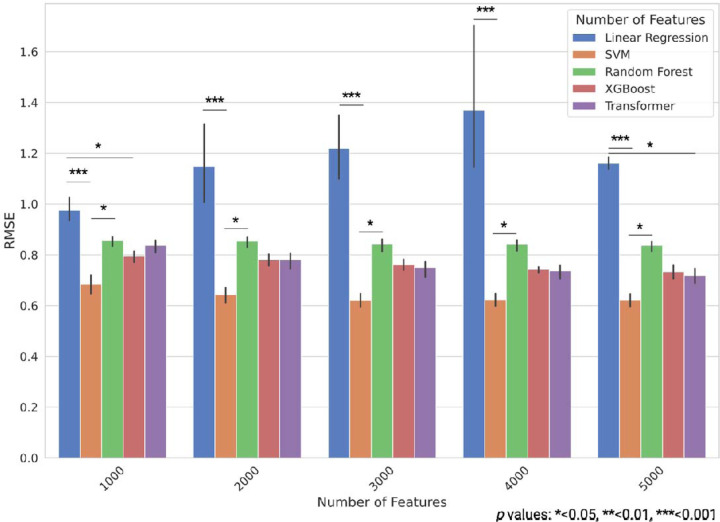
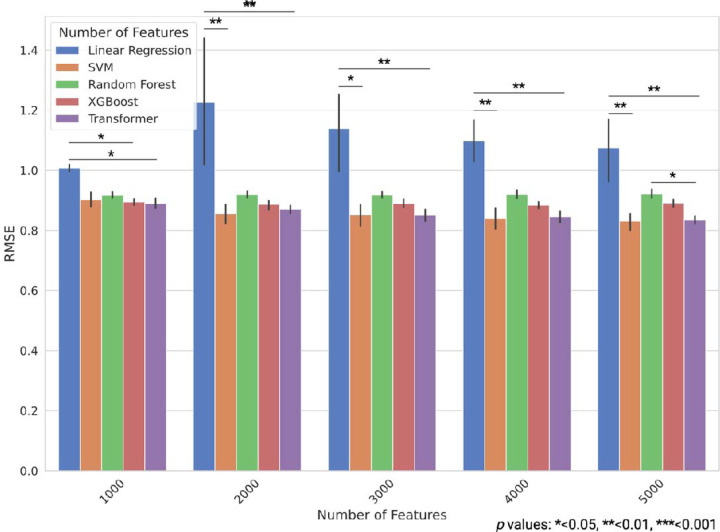
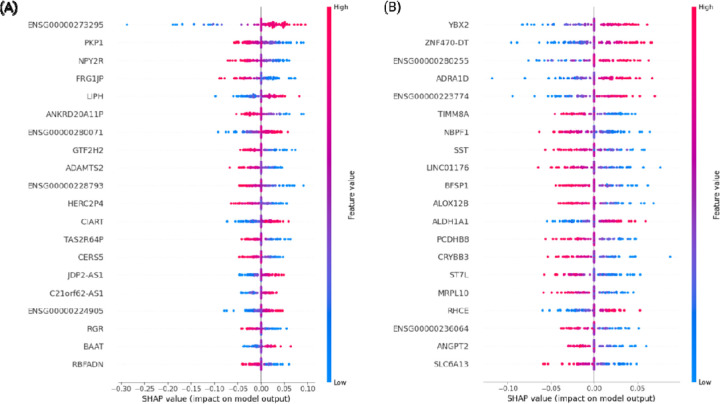
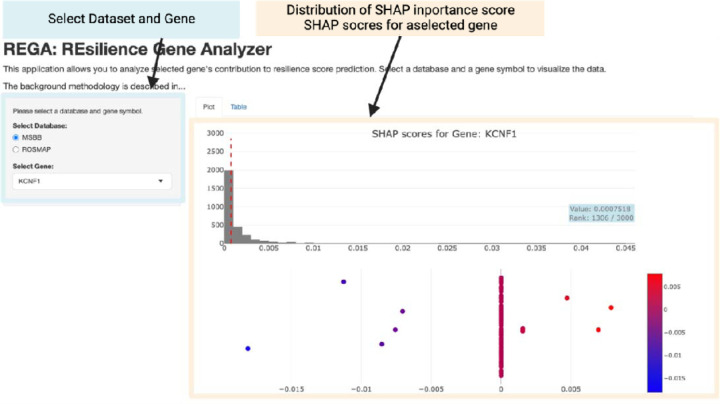
Alzheimer's disease (AD) is an important research topic. While amyloid plaques and neurofibrillary tangles are hallmark pathological features of AD, cognitive resilience (CR) is a phenomenon where cognitive function remains preserved despite the presence of these pathological features. This study aimed to construct and compare predictive machine learning models for CR scores using RNA-seq data from the Religious Orders Study and Memory and Aging Project (ROSMAP) and Mount Sinai Brain Bank (MSBB) cohorts. We evaluated support vector regression (SVR), random forest, XGBoost, linear, and transformer-based models. The SVR model exhibited the best performance, with contributing genes identified using Shapley additive explanations (SHAP) scores, providing insights into biological pathways associated with CR. Finally, we developed a tool called the resilience gene analyzer (REGA), which visualizes SHAP scores to interpret the contributions of individual genes to CR. REGA is available at https://igcore.cloud/GerOmics/REsilienceGeneAnalyzer/.
Keywords: Alzheimer’s disease; Shapley additive explanations; machine learning; resilience gene analyzer; transcriptomics.
Figures
Similar articles
-
Interpretable deep learning framework for understanding molecular changes in human brains with Alzheimer's disease: implications for microglia activation and sex differences.NPJ Aging. 2025 Jul 16;11(1):66. doi: 10.1038/s41514-025-00258-5. NPJ Aging. 2025. PMID: 40670382 Free PMC article.
-
Supervised Machine Learning Models for Predicting Sepsis-Associated Liver Injury in Patients With Sepsis: Development and Validation Study Based on a Multicenter Cohort Study.J Med Internet Res. 2025 May 26;27:e66733. doi: 10.2196/66733. J Med Internet Res. 2025. PMID: 40418571 Free PMC article.
-
A Novel Design of a Portable Birdcage via Meander Line Antenna (MLA) to Lower Beta Amyloid (Aβ) in Alzheimer's Disease.IEEE J Transl Eng Health Med. 2025 Apr 10;13:158-173. doi: 10.1109/JTEHM.2025.3559693. eCollection 2025. IEEE J Transl Eng Health Med. 2025. PMID: 40657533 Free PMC article.
-
Selegiline for Alzheimer's disease.Cochrane Database Syst Rev. 2003;(1):CD000442. doi: 10.1002/14651858.CD000442. Cochrane Database Syst Rev. 2003. PMID: 12535396
-
18F PET with florbetapir for the early diagnosis of Alzheimer's disease dementia and other dementias in people with mild cognitive impairment (MCI).Cochrane Database Syst Rev. 2017 Nov 22;11(11):CD012216. doi: 10.1002/14651858.CD012216.pub2. Cochrane Database Syst Rev. 2017. PMID: 29164603 Free PMC article.
References
Publication types
Grants and funding
- P30 AG072975/AG/NIA NIH HHS/United States
- U01 AG046152/AG/NIA NIH HHS/United States
- RF1 AG057440/AG/NIA NIH HHS/United States
- P50 AG016574/AG/NIA NIH HHS/United States
- U01 AG061356/AG/NIA NIH HHS/United States
- P30 AG010161/AG/NIA NIH HHS/United States
- R01 AG032990/AG/NIA NIH HHS/United States
- R01 NS080820/NS/NINDS NIH HHS/United States
- U01 AG046139/AG/NIA NIH HHS/United States
- P01 AG017216/AG/NIA NIH HHS/United States
- R01 AG018023/AG/NIA NIH HHS/United States
- U01 AG046170/AG/NIA NIH HHS/United States
- U24 AG061340/AG/NIA NIH HHS/United States
- R01 AG017917/AG/NIA NIH HHS/United States
- P30 AG072980/AG/NIA NIH HHS/United States
- P01 AG003949/AG/NIA NIH HHS/United States
- U24 NS072026/NS/NINDS NIH HHS/United States
- P30 AG019610/AG/NIA NIH HHS/United States
- P50 AG025711/AG/NIA NIH HHS/United States
- U01 AG006786/AG/NIA NIH HHS/United States
- R01 AG036836/AG/NIA NIH HHS/United States
- R01 AG015819/AG/NIA NIH HHS/United States
LinkOut - more resources
Full Text Sources