[Preprint]. 2024 Aug 26:2024.08.26.609683.
doi: 10.1101/2024.08.26.609683.

LAT encodes T cell activation pathway balance

Affiliations

LAT encodes T cell activation pathway balance

Adam J Rubin et al. bioRxiv. .

Abstract

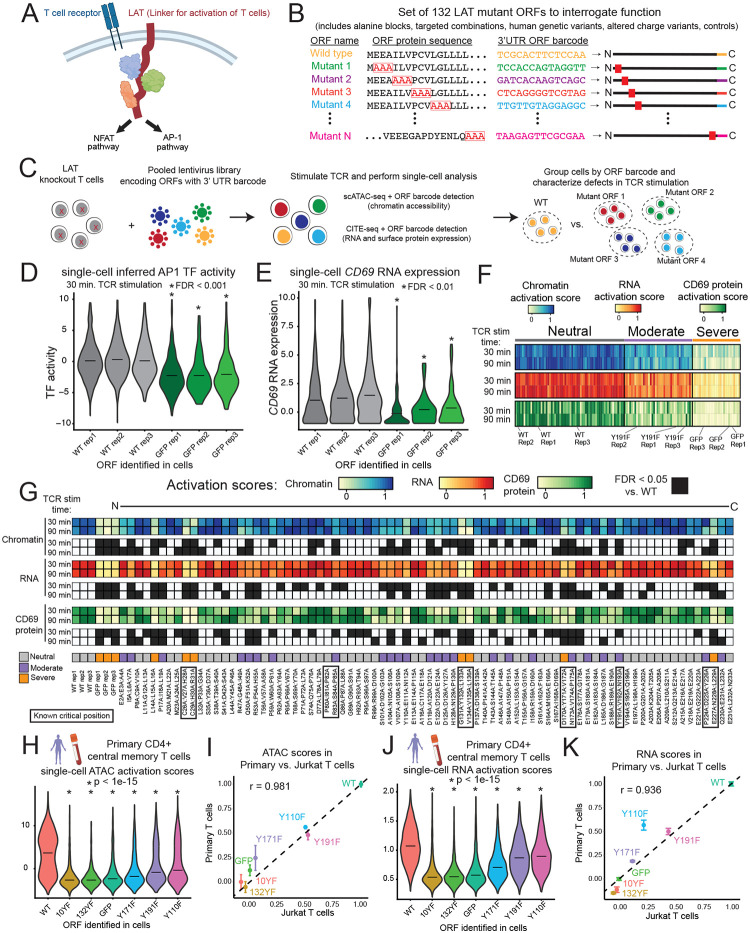
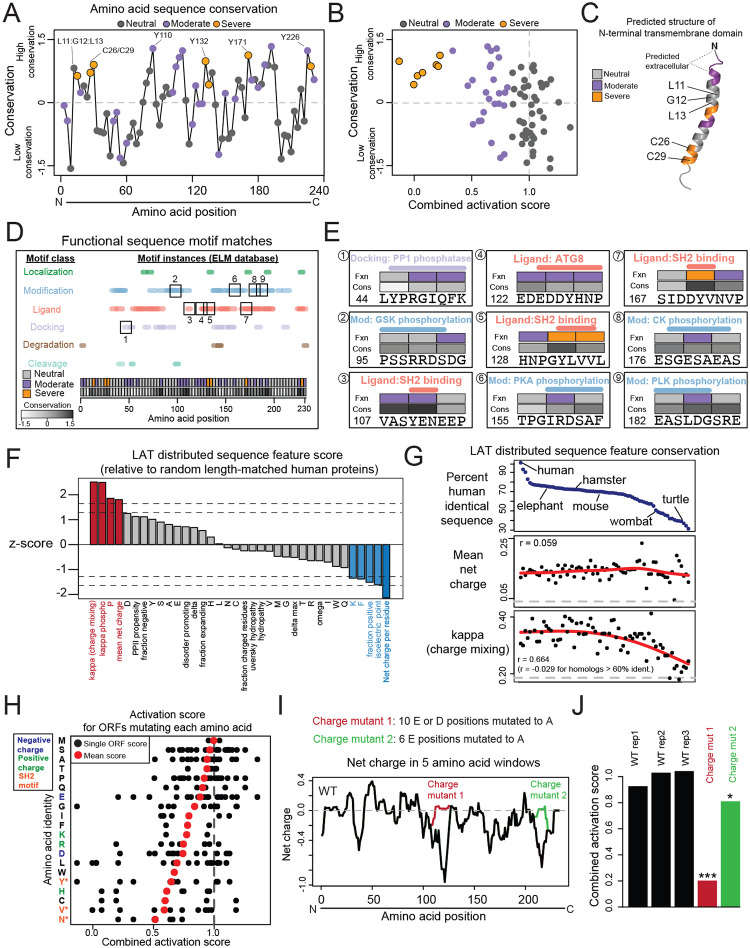
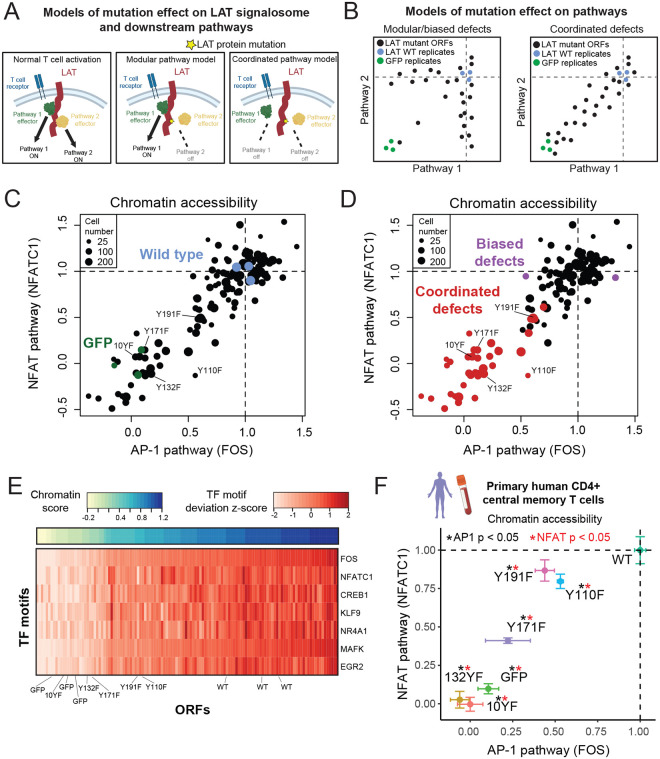
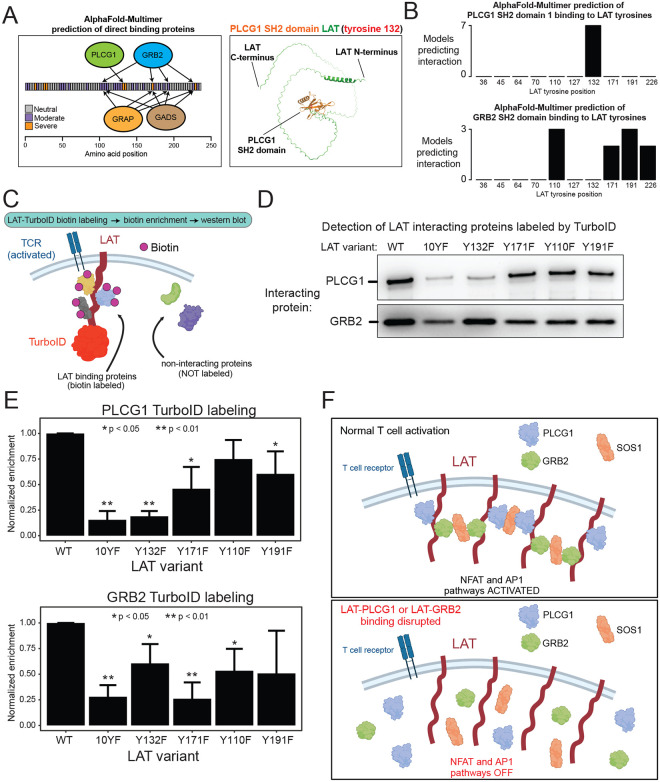
Immune cells transduce environmental stimuli into responses essential for host health via complex signaling cascades. T cells, in particular, leverage their unique T cell receptors (TCRs) to detect specific Human Leukocyte Antigen (HLA)-presented peptides. TCR activation is then relayed via linker for activation of T cells (LAT), a TCR-proximal disordered adapter protein, which organizes protein partners and mediates the propagation of signals down diverse pathways including NFAT and AP-1. Here, we studied how balanced downstream pathway activation is encoded in the amino acid sequence of LAT. To comprehensively profile the sequence-function relationship of LAT, we developed a pooled, single-cell, high-content screening approach in which a large series of mutants in the LAT protein were analyzed to characterize their effects on T cell activation. Measuring epigenetic, transcriptomic, and cell surface protein dynamics of single cells harboring distinct LAT mutants, we found functional regions spanning over 40% of the LAT amino acid sequence. Conserved sequence motifs for protein interactions along with charge distribution are critical sequence features, and contribute to interpretation of human genetic variation in LAT. While mutant defect severity spans from moderate to complete loss of function, nearly all defective mutants, irrespective of their position in LAT, confer balanced defects across all downstream pathways. To understand the molecular basis for this observation, we performed proximal protein labeling which demonstrated that disruption of LAT interaction with a single partner protein indirectly disrupts other partner interactions, likely through the dual roles of these proteins as effectors of downstream pathways and bridging factors between LAT molecules. Overall, we report widely distributed functional regions throughout a disordered adapter and a precise physical organization of LAT and interacting molecules which constrains signaling outputs. More broadly, we describe an approach for interrogating sequence-function relationships for proteins with complex activities across regulatory layers of the cell.


Conflict of interest statement

Competing Interests A.K.S. reports compensation for consulting and/or SAB membership from Honeycomb Biotechnologies, Cellarity, Bio-Rad Laboratories, Fog Pharma, Passkey Therapeutics, Ochre Bio, Relation Therapeutics, IntrECate biotherapeutics, and Dahlia Biosciences unrelated to this work. A.R. is employed by Genentech, Inc., South San Francisco, CA, USA, and is a co-founder and equity holder of Celsius Therapeutics, an equity holder in Immunitas and, until 31 July 2020, was a scientific advisory board member of Thermo Fisher Scientific, Syros Pharmaceuticals, Neogene Therapeutics and Asimov.

Figures

Figure 1:
Figure 1:. A pooled screen links protein sequence to high-content readouts of parallel LAT activities.
(A) LAT is a largely disordered membrane-integrated adapter protein which, upon TCR stimulation, aggregates numerous protein interactors to trigger intracellular signaling pathways. (B) Triple alanine block mutant ORFs were designed to cover the entire length of LAT. Other ORFs in the library include single and multisite mutants reported in previous studies, variants observed in humans, ORFs altering net charge, and controls. Each ORF is encoded in a cDNA expression construct with an ORF-identifying barcode in the 3’ UTR. (C) A single pool of lentivirus corresponding to all 132 ORFs was used to transduce LAT-knockout Jurkat T cells for subsequent TCR stimulation and single-cell epigenomic, transcriptomic, and protein characterization. (D) Violin plot and mean inferred AP-1 transcription factor activity from chromatin accessibility for cells assigned to one of the wild type (WT) or GFP replicate ORF barcodes at 30 minutes of TCR stimulation. Replicate ORFs are identical except for the barcode. False discovery rate (FDR) from cell sampling test (See Methods). (E) Similar to (D), for RNA gene expression of CD69 from the 30 minute TCR stimulation CITE-seq experiment. (F) Heatmap of ORF activation scores (mean scores across cells), clustered by k-means. Scores are scaled such that 0 represents the mean of GFP-expressing cells and 1 represents the mean of WT LAT-expressing cells. (G) Heatmaps representing chromatin, RNA, and CD69 protein activation scores for ORFs encoding alanine blocks. Scores with an FDR < 0.05 are shaded black in corresponding heatmap rows, and known critical positions from the literature are boxed. Neutral, moderate, and severe indicate cluster labels. (H) Violin plot of mean chromatin activation score for primary human CD4+ central memory T cells assigned to each ORF. p-value from KS test, r indicates Pearson correlation. (I) Scatter plot comparing chromatin activation scores between Jurkat T cell and primary human T cell models. Error bars represent standard deviation. (J) Similar to (H) for RNA activation score. (K) Similar to (I) for RNA activation score.
Figure 2:
Figure 2:. Determinants of sequence function in LAT.
(A) Amino acid sequence conservation of triple alanine blocks was calculated using the ConSurf tool. ConSurf computes a normalized score for each residue in the protein, whereby the mean value across all residues is zero and the standard deviation is one. Plotted values represent the mean conservation score for residues in the three-residue block. (B) Scatter plot of combined activation score (from chromatin and RNA scores) vs. conservation for each alanine block. (C) AlphaFold prediction of LAT transmembrane domain structure. (D) Motif position matches from the Eukaryotic Linear Motif (ELM) database. Boxed ligand motifs are displayed in detail in (E). (E) Detailed examples of ELM motif matches in LAT. The number in the bottom left of each square indicates the starting amino acid position in LAT. Fxn refers to the functional categories of Neutral, Moderate, or Severe. Cons refers to conservation score as displayed in (D). (F) Bar plot indicating the zscore of various sequence features for LAT compared to 100 random length-matched human proteins. Feature values were computed by localCIDER (Materials and Methods). Vertical lines at 5 and 10 percentiles. (G) Scatter plots of CIDER distributed amino acid sequence features for LAT homologs, ordered by amino acid sequence identity with human LAT. Pearson correlation (r) calculated between sequence identity percent and each feature. Red line indicates a smooth spline calculated in R and gray line represents the mean of random length- matched proteins. (H) For each amino acid, dots represent each ORF in which that amino acid is mutated at least once, located on the x axis position indicated the combined activation score for that ORF. Red dot indicates the mean across all ORFs mutating a particular amino acid. Asterisk indicates FDR < 0.05 compared to mean of score for all residues based on permuting residue positions. (I) Running charge (mean within five amino acid windows) for WT LAT and charge mutants. (J) Combined activation scores for each charge mutant. (***, FDR < 0.05 in at least one time point of chromatin, RNA, and CD69 protein samples; *, FDR < 0.05 in one time point of CD69 protein sample, Supplementary Data 4).
Figure 3:
Figure 3:. LAT encodes downstream pathway balance.
(A) Models of LAT with interacting proteins which mediate intracellular signaling pathways controlling chromatin, RNA, or protein features. The complex of LAT with interactors (“signalosome”) could control downstream pathways in a modular or coordinated fashion. In a modular model, mutation in one region of LAT and disruption of a particular interactor will disrupt one downstream pathway while leaving others active. In a coordinated model, mutation in one region of LAT which disrupts a particular interactor may disrupt other interactions or pathway activities (either directly through higher-order physical interactions or indirectly through signal cross-talk). (B) Expected results for the models proposed in (A). Modular or coordinated signaling will exhibit distinct patterns of mutant effects on pairs of pathway activities measured in the screen. (C) Scatter plot of the accessibility of two chromatin features (inferred TF activity, averaged across cells expressing a particular ORF) representing central pathways of T cell activation. FDR from permutation sampling test. ORFs supported by at least 50 cells are displayed. (D) Scatter plot of the same data as in (C), with ORFs labeled as exhibiting balanced or biased defects across AP1 and NFAT pathways. Balanced defects exhibit statistically significant defects in both AP1 and NFAT pathways. (E) Heatmap of inferred TF activity for TFs representing motif families that increase in T cell activation. ORFs (columns) are ordered by chromatin activation score. (F) Scatter plot of AP1 and NFAT TF activity in primary human CD4+ central memory T cells. Error bars represent standard deviation across replicates, p-value from KS test of single-cell values.
Figure 4:
Figure 4:. Indirect disruption of protein interactions underlies balanced defects.
(A) Left: Schematic of binding sites of SH2 domains predicted by AlphaFold Multimer. Right: predicted structure of LAT interacting with the PLCG1 SH2 domain. (B) Counts of models (out of 10 total predicted models) for each LAT interaction with an SH2 domain. Models were scored as interaction with a particular LAT tyrosine based on exclusive proximity of 10 angstroms. (C) Schematic of LAT-TurboID proximity labeling experiment. LAT fused to TurboID was expressed in Jurkat cells. Cells were activated by pervanadate stimulation for 10 min, and biotinylated proteins were detected by western blot of the streptavidin enriched lysate. (D) Representative western blots from four replicate labeling experiments detecting PLCG1 and GRB2 abundance in streptavidin-enriched samples. (E) Quantification of band intensity from four replicate labeling experiments. Error bars represent standard deviation and p-values were calculated by t-test. (D) Model of LAT interaction with partner proteins. Disruption of one interaction has indirect effects on distinct interactors, resulting in balanced loss of pathway activation.

References

    1. Macián F. et al. Transcriptional mechanisms underlying lymphocyte tolerance. Cell 109, 719–731 (2002). - PubMed
    1. Balagopalan L., Coussens N. P., Sherman E., Samelson L. E. & Sommers C. L. The LAT Story: A Tale of Cooperativity, Coordination, and Choreography. Cold Spring Harb Perspect Biol 2, a005512 (2010). - PMC - PubMed
    1. Malissen B., Grégoire C., Malissen M. & Roncagalli R. Integrative biology of T cell activation. Nature Immunology 2014 15:9 15, 790–797 (2014). - PubMed
    1. Zhang W. et al. Association of Grb2, Gads, and Phospholipase C-γ1 with Phosphorylated LAT Tyrosine Residues: EFFECT OF LAT TYROSINE MUTATIONS ON T CELL ANTIGEN RECEPTOR-MEDIATED SIGNALING. Journal of Biological Chemistry 275, 23355–23361 (2000). - PubMed
    1. Lin J. & Weiss A. Identification of the Minimal Tyrosine Residues Required for Linker for Activation of T Cell Function. Journal of Biological Chemistry 276, 29588–29595 (2001). - PubMed

References (Methods)

    1. Ursu O. et al. Massively parallel phenotyping of coding variants in cancer with Perturb-seq. Nature Biotechnology 2022 40:6 40, 896–905 (2022). - PubMed
    1. Corces M. R. et al. An improved ATAC-seq protocol reduces background and enables interrogation of frozen tissues. Nature Methods 2017 14:10 14, 959–962 (2017). - PMC - PubMed
    1. Picelli S. et al. Full-length RNA-seq from single cells using Smart-seq2. Nature Protocols 2013 9:1 9, 171–181 (2014). - PubMed
    1. Li B. et al. Cumulus provides cloud-based data analysis for large-scale single-cell and single-nucleus RNA-seq. Nature Methods 2020 17:8 17, 793–798 (2020). - PMC - PubMed
    1. Brinkman E. K., Chen T., Amendola M. & Van Steensel B. Easy quantitative assessment of genome editing by sequence trace decomposition. Nucleic Acids Res 42, e168–e168 (2014). - PMC - PubMed

Publication types

LinkOut - more resources