[Preprint]. 2024 Aug 26:2024.08.26.608843.
doi: 10.1101/2024.08.26.608843.

Common DNA sequence variation influences epigenetic aging in African populations

Affiliations

Common DNA sequence variation influences epigenetic aging in African populations

Gillian L Meeks et al. bioRxiv. .

Update in

Abstract

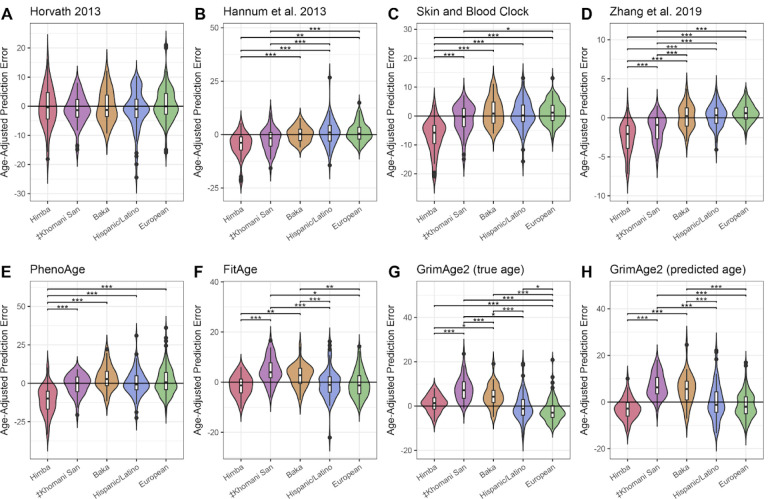
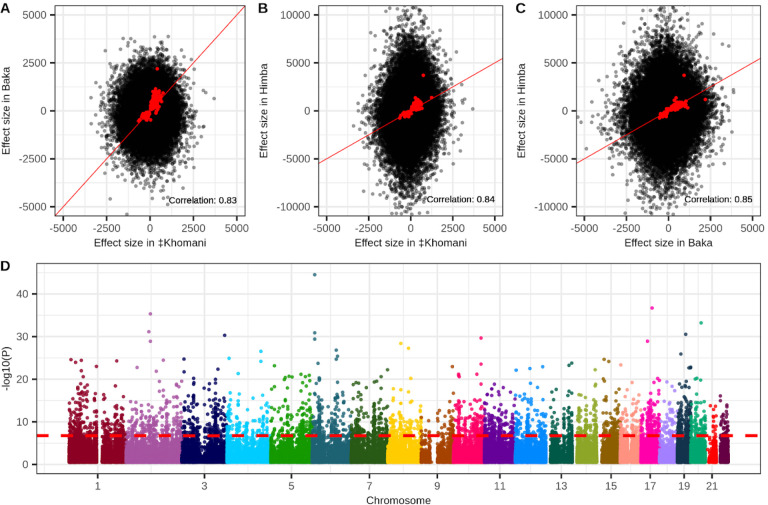
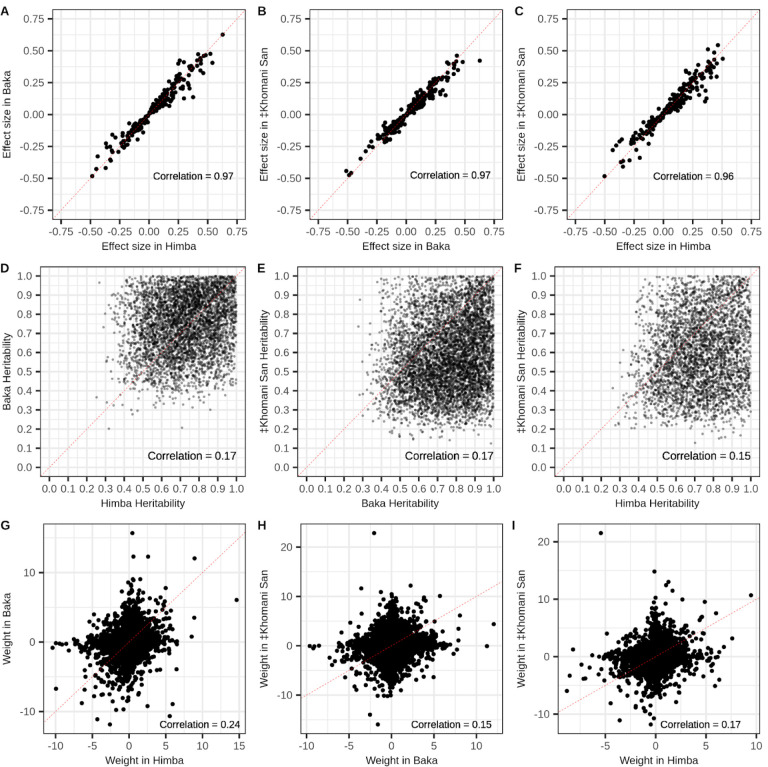
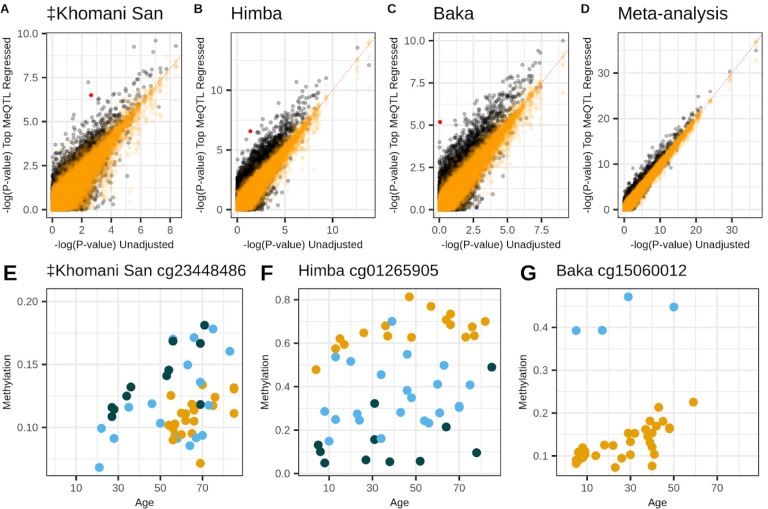
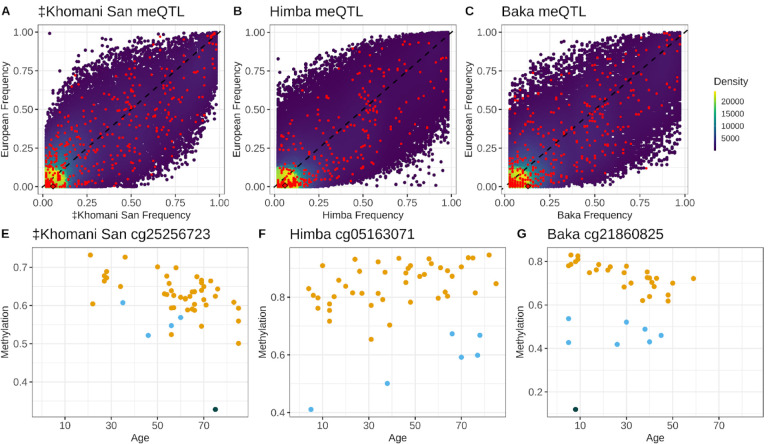
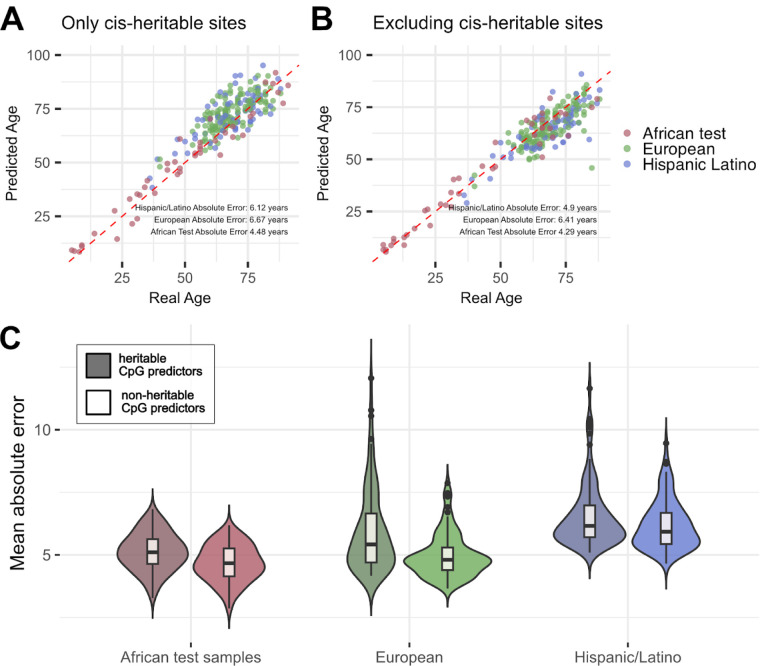
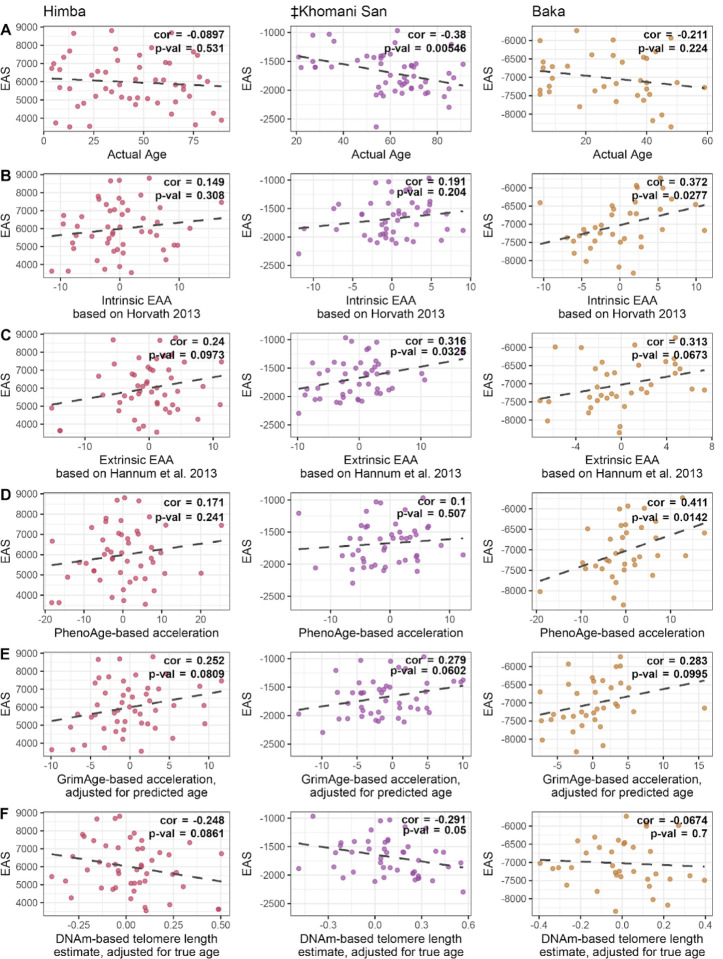
Aging is associated with genome-wide changes in DNA methylation in humans, facilitating the development of epigenetic age prediction models. However, most of these models have been trained primarily on European-ancestry individuals, and none account for the impact of methylation quantitative trait loci (meQTL). To address these gaps, we analyzed the relationships between age, genotype, and CpG methylation in 3 understudied populations: central African Baka (n = 35), southern African ‡Khomani San (n = 52), and southern African Himba (n = 51). We find that published prediction methods yield higher mean errors in these cohorts compared to European-ancestry individuals, and find that unaccounted-for DNA sequence variation may be a significant factor underlying this loss of accuracy. We leverage information about the associations between DNA genotype and CpG methylation to develop an age predictor that is minimally influenced by meQTL, and show that this model remains accurate across a broad range of genetic backgrounds. Intriguingly, we also find that the older individuals and those exhibiting relatively lower epigenetic age acceleration in our cohorts tend to carry more epigenetic age-reducing genetic variants, suggesting a novel mechanism by which heritable factors can influence longevity.


Conflict of interest statement

Competing Interests The authors have no competing interests to declare.

Figures

Figure 1 -
Figure 1 -. Distributions of age-adjusted prediction error across diverse cohorts.
Violin plots A-H show differences in prediction error, adjusted for individual age, among Himba, ‡Khomani San, Baka, European, and Hispanic/Latino samples across 8 published epigenetic clocks. We tested for significant differences in age-adjusted prediction error among all populations by ANOVA, followed by a Tukey test to identify significant pairwise differences. * indicates an adjusted p-value of < .05, ** < .01, and *** < .001.
Figure 2 -
Figure 2 -. Epigenome-wide associations with chronological age.
Panels A-C show the correlation of estimated effect sizes of DNA methylation on age for all pairwise comparisons of the Baka, ‡Khomani San, and Himba. Red points indicate CpG sites that were identified as significantly associated with age in at least one of the three populations. For these points the correlation between effect sizes estimated in different populations is indicated at the bottom right of each panel. Panel D is a Manhattan plot depicting the strength of association with age along the entire genome from a meta-analysis of the individual epigenome-wide association studies run in the three populations. A total of 3,211 CpG sites exceed the threshold for significance.
Figure 3 -
Figure 3 -. Shared cis-genetic architecture of CpG methylation among populations.
Panels A-C show the correlations of estimated effect sizes of SNP genotype on DNA methylation level from baseline cis-meQTL scans of the Baka, ‡Khomani San, and Himba for cases where the same SNP-CpG relationship was identified in both populations. Panels D-F show the correlation in cis-heritability measures for significantly heritable (p value < .05) CpG sites across all pairwise combinations of populations. Panels G-I show the correlations of cis-SNP weights on DNA methylation levels estimated from the FUSION regression models for the instances where the same SNP was estimated to have a non-zero weight across different populations, but the selected model was allowed to vary between populations. Weights were scaled within model typeIn each panel, the dashed represents the line of equality.
Figure 4 -
Figure 4 -. Accounting for meQTL genotype improves power to detect age associations.
Panels A-D show p-values for the association between CpG methylation and chronological age from the unadjusted epigenome-wide association study (x-axes) versus p-values from the meQTL-adjusted epigenome-wide association study (y-axes). Orange points show the results of 100 permutations where a random SNP’s genotype is regressed out rather than the true meQTL. Panels D-F highlight the red points from A-C, respectively, illustrating the influence of genotype on DNA methylation at CpG sites showing particularly large p-value improvements in the adjusted EWAS. The three colors indicate the three genotype classes possible for each meQTL.
Figure 5 -
Figure 5 -. Allele frequencies of meQTL influencing CpG predictors in published epigenetic clocks are differentiated across human populations.
Panels A-C show density plots of the allele frequencies of meQTL identified in each of the three African populations relative to their frequency in 1000 Genomes Phase 3 Europeans. Red points are meQTL influencing CpGs in published age prediction models. Panels D-F show the influence of genotype on baseline methylation level for the meQTL highlighted with a diamond from the top row. The three colors indicate the three possible genotype classes for each meQTL.
Figure 6 -
Figure 6 -. Performance of epigenetic clocks trained on a set of CpG sites that do not exhibit significant cis-heritability of DNA methylation and a set of CpG sites that do exhibit evidence of cis-heritability.
The top row of panels show predicted age on the y-axis plotted against true age on the x-axis for the epigenetic age prediction models that are comprised of either significantly cis-heritable CpG predictors (A) or not significantly cis-heritable predictors. Panels A and B are each based on a single model that exhibited median accuracy among a total of 100 models. Panel C depicts the mean absolute error across all 100 models within the African test subset, European, and Hispanic/Latino cohort, restricted to individuals aged 36–91. Models based on CpG predictors that are not significantly impacted by cis-genetic variation exhibit lower absolute error and less bias when applied out-of-cohort than models based on CpG sites that are significantly heritable.
Figure 7 -
Figure 7 -. Relationship between EAS and aging metrics.
Scatterplots show the relationship between the genotype-based epigenetic aging score (EAS) and various metrics of age for the Himba, ≠Khomani San, and Baka. Each EAS model was built from the respective population’s epigenome-wide association study and baseline meQTL scan results. Individuals’ EAS values were plotted against A) chronological age itself, B) ‘Intrinsic Epigenetic Age Acceleration’, based on the Horvath multi-tissue age predictor, C) ‘Extrinsic Epigenetic Age Acceleration’, based on the Horvath multi-tissue age predictor, D) epigenetic age acceleration based on PhenoAge, E) epigenetic age acceleration based on GrimAge, adjusted for predicted age, and F) DNA methylation-based telomere length, adjusted for true age.

References

    1. 1000 Genomes Project Consortium et al. A global reference for human genetic variation. Nature 526, 68–74 (2015). - PMC - PubMed
    1. Johansson A., Enroth S. & Gyllensten U. Continuous Aging of the Human DNA Methylome Throughout the Human Lifespan. PLoS One 8, e67378 (2013). - PMC - PubMed
    1. Jones M. J., Goodman S. J. & Kobor M. S. DNA methylation and healthy human aging. Aging Cell 14, 924–932 (2015). - PMC - PubMed
    1. Heyn H. et al. Distinct DNA methylomes of newborns and centenarians. Proc. Natl. Acad. Sci. U. S. A. 109, 10522–10527 (2012). - PMC - PubMed
    1. Weidner C. I. et al. Aging of blood can be tracked by DNA methylation changes at just three CpG sites. Genome Biol. 15, 1–12 (2014). - PMC - PubMed

Publication types