[Preprint]. 2025 Apr 25:2023.04.09.536178.
doi: 10.1101/2023.04.09.536178.

PD-linked LRRK2 G2019S mutation impairs astrocyte morphology and synapse maintenance via ERM hyperphosphorylation

Affiliations

PD-linked LRRK2 G2019S mutation impairs astrocyte morphology and synapse maintenance via ERM hyperphosphorylation

Shiyi Wang et al. bioRxiv. .

Abstract

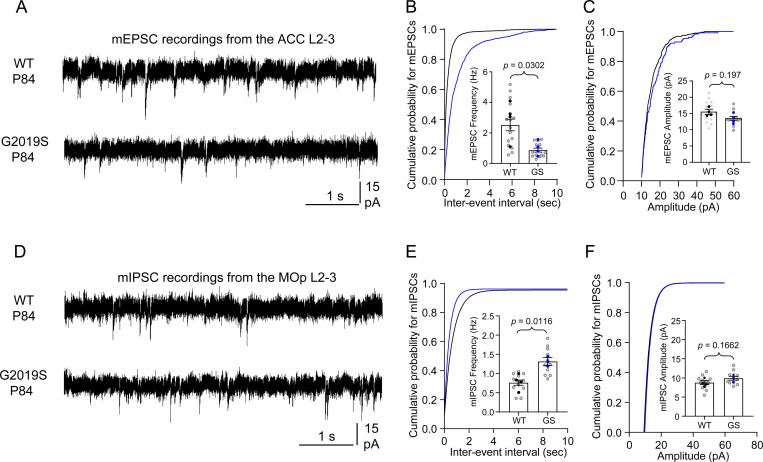
Astrocytes are highly complex cells that mediate critical roles in synapse formation and maintenance by establishing thousands of direct contacts with synapses through their perisynaptic processes. Here, we found that the most common Parkinsonism gene mutation, LRRK2 G2019S, enhances the phosphorylation of the ERM proteins (Ezrin, Radixin, and Moesin), components of the perisynaptic astrocyte processes in a subset of cortical astrocytes. The ERM hyperphosphorylation was accompanied by decreased astrocyte morphological complexity and reduced excitatory synapse density and function. Dampening ERM phosphorylation levels in LRRK2 G2019S mouse astrocytes restored both their morphology and the excitatory synapse density in the anterior cingulate cortex. To determine how LRRK2 mutation impacts Ezrin interactome, we used an in vivo BioID proteomic approach, and we found that astrocytic Ezrin interacts with Atg7, a master regulator of autophagy. The Ezrin/Atg7 interaction is inhibited by Ezrin phosphorylation, thus diminished in LRRK2 G2019S astrocytes. Importantly, the Atg7 function is required to maintain proper astrocyte morphology. Our data provide a molecular pathway through which the LRRK2 G2019S mutation alters astrocyte morphology and synaptic density in a brain-region-specific manner.


Conflict of interest statement

DECLARATION OF INTERESTS The authors declare no competing interests.

Figures

Figure 1:
Figure 1:. ERM phosphorylation is impaired in PD patients carrying LRRK2 G2019S mutation.
(A) Schematic of human frontal cortex regions analyzed for phospho-ERM staining. (B) Representative confocal images of GFAP (green) and phospho-ERM (purple) in the frontal cortex of human controls (n = 4; 3M, 1F) and LRRK2 G2019S mutation carriers (n = 3; 2M, 1F), aged >80 years. Scale bar, 200 μm. (C) Quantification of GFAP integrated density in (B). GFAP: t (5) = 2.822, p = 0.037; phospho-ERM: t (5) = 5.695, p = 0.0023. Grey dots: individual images; black dots: control averages; blue dots: mutation carrier averages. (D) Schematic of mouse anterior cingulate cortex (ACC) and primary motor cortex (MOp) analyzed for phospho-ERM staining. (E-F) Representative confocal images of phospho-ERM in the ACC and the MOp of WT or LRRK2 G2019Ski/ki Aldh1L1-eGFP mice at P21. Scale bar, 10 μm. (G-H) Representative confocal images of phospho-ERM in the ACC and MOp of WT (n = 4; 2M, 2F) or LRRK2 G2019Ski/ki Aldh1L1-eGFP mice (n = 4; 2M, 2F) at P21. Scale bar, 200 μm. (I) Quantification of phospho-ERM integrated density in (G-H). For the ACC, nested t-test, unpaired two-tailed t-test. t (6) = 4.247, p = 0.0054. For the MOp, nested t-test, unpaired two-tailed t-test. t (6) = 2.392, p = 0.0536. (J-K) Representative confocal images of phospho-ERM (purple) in the ACC and MOp of WT (n = 4; 2M, 2F) or LRRK2 G2019Ski/ki Aldh1L1-eGFP (n = 4; 2M, 2F) mice at P84. Scale bar, 200 μm. (L) Quantification of phospho-ERM integrated density in (J-K), For the ACC, nested t-test, unpaired Two-tailed t-test. t (6) = 4.383, p = 0.0047. For the MOp, nested t-test, unpaired Two-tailed t-test. t (6) = 3.898, p = 0.0080. Grey dots: individual images; black dots: WT averages; blue dots: mutant averages.
Figure 2:
Figure 2:. LRRK2 G2019S affects excitatory and inhibitory synapse densities in the ACC and MOp.
(A-B) Schematics of analyzed brain regions (ACC and MOp) and methods for quantifying VGluT1-PSD95 and VGAT-GEPHYRIN colocalized puncta. (C) Representative images of VGluT1-PSD95 staining in ventral ACC L1 of WT and LRRK2 G2019Ski/ki mice at P84. Scale bar, 10 μm. (D) Quantification of VGluT1-PSD95 puncta in ventral ACC L1 and L2–3, normalized to WT means. n = 5/group (3M, 2F). Nested One-way ANOVA: [F(3, 56) = 12.48, p < 0.0001]. Bonferroni’s test: L1 (p < 0.0001), L2–3 (p = 0.0002). (E) Representative images of VGluT1-PSD95 staining in MOp L1 at P84. Scale bar, 10 μm. (F) Quantification of VGluT1-PSD95 puncta in MOp L1 and L2–3. n = 5/group (3M, 2F). No significant differences (Bonferroni’s test: p > 0.05). (G) Representative images of VGAT-GEPHYRIN staining in ventral ACC L1. Scale bar, 10 μm. (H) Quantification of VGAT-GEPHYRIN puncta in ACC L1 and L2–3, normalized to WT means. n = 4/group (2M, 2F). No significant differences (Bonferroni’s test: p > 0.05). (I) Representative images of VGAT-GEPHYRIN staining in MOp L1. Scale bar, 10 μm. (J) Quantification of VGAT-GEPHYRIN puncta in MOp L1 and L2–3. n = 6/group (3M, 3F). Nested One-way ANOVA: [F(3, 68) = 25.88, p < 0.0001]. Bonferroni’s test: L1 (p < 0.0001), L2–3 (p < 0.0001). Grey dots: individual images; black dots: WT averages; blue dots: mutant averages.
Figure 3:
Figure 3:. LRRK2 G2019S affects excitatory and inhibitory synapse function in the ACC and MOp.
(A) Representative mEPSC traces from ventral ACC L2–3 pyramidal neurons in WT and LRRK2 G2019Ski/ki mice. (B) Cumulative probability and quantification of mEPSC frequency: n = 15 (WT), 13 (LRRK2 G2019Ski/ki) neurons, 4 mice/genotype. Kolmogorov-Smirnov test: D = 0.504, p < 0.001. Mean frequency: WT (2.878 ± 0.6355), LRRK2 G2019Ski/ki (0.9673 ± 0.2328). Unpaired t-test: t (6) = 2.823, p = 0.0302. (C) Cumulative probability and quantification of mEPSC amplitude: n = 14 (WT), 12 (LRRK2 G2019Ski/ki) neurons. Kolmogorov-Smirnov test: D = 0.194, p < 0.0001. Mean amplitude: WT (15.5 ± 0.6325), LRRK2 G2019Ski/ki (13.9 ± 0.9017). Unpaired t-test: t (6) = 1.451, p = 0.197. (D) Representative mIPSC traces from MOp L2–3 pyramidal neurons in WT and LRRK2 G2019Ski/ki mice. (E) Cumulative probability and quantification of mIPSC frequency: n = 12 (WT), 11 (LRRK2 G2019Ski/ki) neurons, 4 WT, 3 LRRK2 G2019Ski/ki mice. Kolmogorov-Smirnov test: D = 0.424, p < 0.0001. Mean frequency: WT (0.7788 ± 0.1012), LRRK2 G2019Ski/ki (1.301 ± 0.07291). Unpaired t-test: t (5) = 3.883, p = 0.0116. (F) Cumulative probability and quantification of mIPSC amplitude: n = 12 (WT), 11 (LRRK2 G2019Ski/ki) neurons. Kolmogorov-Smirnov test: D = 0.382, p < 0.0001. Mean amplitude: WT (8.633 ± 0.4883), LRRK2 G2019Ski/ki (9.834 ± 0.5558). Unpaired t-test: t (5) = 1.62, p = 0.1662. Data are presented as mean ± s.e.m.
Figure 4:
Figure 4:. Overexpression of phospho-dead Ezrin in adult LRRK2 G2019Ski/ki astrocytes restores excitatory synapse number and function in the ventral ACC.
(A) Representative ventral ACC images of WT and LRRK2 G2019Ski/ki mice injected with AAV-HA-WT or Phospho-dead EZRIN, stained for HA and phospho-ERM (P84). Scale bar, 200 μm. (B) Quantification of phospho-ERM intensity (n = 6/group, 3 males, 3 females). One-way ANOVA [F(3, 20) = 31.62, p < 0.0001], Bonferroni’s test: significant differences between WT + WT EZRIN vs. LRRK2 + WT EZRIN (p < 0.0001), and LRRK2 + WT EZRIN vs. LRRK2 + Phospho-dead EZRIN (p < 0.0001). No significant differences for other comparisons (p > 0.05). (C-D) Representative ACC L1 and L2–3 images of VGluT1/PSD95 staining (P84). Scale bar, 10 μm. Quantification of co-localized puncta normalized to WT + WT EZRIN (n = 5–6/group). L1: One-way ANOVA [F(3, 19) = 5.882, p = 0.0051], Bonferroni’s test: significant differences among WT + WT EZRIN, LRRK2 + WT EZRIN, and their Phospho-dead counterparts (p < 0.05). L2–3: One-way ANOVA [F(3, 18) = 10.45, p = 0.0003], Bonferroni’s test: significant group differences (p < 0.05). (E) Representative mEPSC traces from L2–3 pyramidal neurons. (F) Synaptic event frequency quantification (n = 11–15 neurons from 4 mice/group). Kruskal-Wallis test [H(3) = 36.83, p < 0.0001], Dunn’s posthoc: significant differences between WT + WT EZRIN vs. all other groups (p < 0.0001), except LRRK2 + Phospho-dead EZRIN (p > 0.9999). (G) Synaptic event amplitude (n = 11–15 neurons from 4 mice/group). Kruskal-Wallis test [H(3) = 7.051, p = 0.0703]; no significant differences across groups (p > 0.05). Data are mean ± s.e.m. Data are mean ± s.e.m.
Figure 5:
Figure 5:. Astrocytic LRRK2 controls astrocyte morphology by balancing ERM phosphorylation levels in vivo.
(A) Representative images of ACC and MOp L2–3 astrocytes in WT and LRRK2 G2019Ski/ki (P21) expressing PB-mCherry-CAAX ± Phospho-dead EZRIN. Astrocyte territory in cyan. Scale bar, 10 μm. (B) Astrocyte territory volume (n = 16–18 astrocytes, 6 mice/group). One-way ANOVA [F(3, 20) = 7.987, p = 0.0011] with Bonferroni’s test showed significant differences: WT vs. LRRK2 G2019Ski/ki (p = 0.0178), WT vs. WT + Phospho-dead EZRIN O/E (p = 0.0037), and WT + Phospho-dead EZRIN O/E vs. LRRK2 G2019Ski/ki + Phospho-mimetic EZRIN O/E (p = 0.0165); other comparisons were not significant (p > 0.05). (C) Astrocyte branching complexity. n = 16–18 astrocytes (6 mice per group). Two-way ANOVA showed main effects of condition [F(2.505, 3305) = 158.4, p < 0.0001], radius [F(88, 1602) = 218.5, p < 0.0001], and their interaction [F(264, 3958) = 10.62, p < 0.0001]. Bonferroni’s test identified significant differences between groups (all p < 0.0001), except WT vs. LRRK2 G2019Ski/ki + Phospho-dead EZRIN O/E (p = 0.5469). (D) Proposed model of Ezrin conformational transition and LRRK2 regulation in astrocyte morphogenesis. (E) Images of ACC and MOp L2–3 astrocytes expressing shControl-mCherry-CAAX or shLRRK2-mCherry-CAAX ± Phospho-mimetic EZRIN. Scale bar, 10 μm. (F) Astrocyte territory volume. n = 18–22 astrocytes (5–6 mice/group). One-way ANOVA [F(3, 19) = 5.47, p = 0.0070] with Bonferroni’s test showed significant differences between shControl and shLRRK2 (p = 0.0132), and shLRRK2 vs. shLRRK2 + Phospho-mimetic EZRIN O/E (p = 0.0152); no other comparisons were significant (p > 0.05). (G) Astrocyte branching complexity. n = 16–22 astrocytes. Two-way ANOVA revealed significant main effects of condition [F(2.435, 7008) = 225.0, p < 0.0001], radius [F(88, 8633) = 325.4, p < 0.0001], and their interaction [F(264, 8633) = 5.908, p < 0.0001]. Bonferroni’s test identified significant differences between most groups (all p < 0.0001) except shControl vs. shControl + Phospho-mimetic EZRIN O/E (p > 0.9999). Data are mean ± s.e.m.
Figure 6:
Figure 6:. LRRK2 G2019S alters the interactome of astrocytic Ezrin in vivo.
(A) astrocyte-specific AAVs (serotype PHP.eB) were used to express Ezrin or nonspecific cytosolic control. NES, nuclear export sequence; ITR, inverted terminal repeats; GfaABC1D truncated GFAP promoter; HA, hemagglutinin tag; pA, polyadenylation. (B) outline of the experimental paradigm. n = 3 biological replicates/construct/genotype (1 replicate = 2 animals per pooled sample). (C) Volcano plot showing the differential abundance of proteins detected by Astro-EZRIN-BioID in WT and LRRK2 G2019Ski/ki cortices. (D-E) Bars show the top 10 most significant Gene Ontology (GO) terms, ordered by lowest adjusted p-value, for the proteins differentially detected by Astro-EZRIN-BioID in WT compared to LRRK2 G2019Ski/ki (D) Molecular function (E) Biological Process. (F) The interaction network depicts 58 high-confidence proteins that gained or lost proximity to Ezrin in LRRK2 G2019Ski/ki compared to WT mice. (G-H) heatmaps depict fold-change in abundance (Astro-EZRIN-BioID / Asto-Cyto-BioID) of proteins with high confidence changed proximity to Ezrin in LRRK2 G2019Ski/ki astrocytes.
Figure 7:
Figure 7:. Interaction Between Atg7 and Ezrin Depends on Ezrin’s Phosphorylation State.
(A) Schematic of Atg7 domains. (B) Predicted Atg7 homodimer model. (C) Schematic of Ezrin domains. (D) Predicted Ezrin structures in closed and open conformations. (E) Predicted Atg7-Ezrin interaction. (F) Structural changes in Ezrin and Atg7 upon binding. (G) Co-immunoprecipitation of Ezrin-HA by Atg7-Myc in HEK293T cells expressing WT, phospho-dead, or phospho-mimetic Ezrin. Ezrin was detected with anti-HA and Atg7 was detected with anti-Myc. (H) Quantification of (G). One-way ANOVA [F(2,6) = 9.932, p = 0.0125] with Tukey’s test: WT vs. phospho-mimetic Ezrin (p = 0.0151), phospho-dead vs. phospho-mimetic Ezrin (p = 0.0272), WT vs. phospho-dead Ezrin (p = 0.8658). n = 3 experiments. (I) Images of ACC and MOp L2–3 astrocytes at P21 expressing shControl or shAtg7-PB-mCherry-CAAX. Scale bar, 10 μm. (J) Quantification of astrocyte territories. Nested ANOVA [F(3,28) = 9.484, p = 0.0002] with Bonferroni tests: WT shControl vs. LRRK2 G2019Ski/ki shControl (p = 0.0036), WT shControl vs. WT shAtg7 (p = 0.0003), WT shAtg7 vs. LRRK2 G2019Ski/ki shAtg7 (p = 0.0109). n = 20–25 cells from 4–5 mice/group. (K) Astrocyte branching complexity. Two-way ANOVA revealed significant condition [F(2.324, 472.6) = 43.1, p < 0.05], radius [F(9, 250) = 301.8, p < 0.05], and interaction effects [F(27, 610) = 4.539, p < 0.05]. Bonferroni tests showed significant differences between groups, including WT shControl vs. LRRK2 G2019Ski/ki shControl (p < 0.0001) and WT shControl vs. WT shAtg7 (p < 0.0001).

References

    1. Semyanov A. and Verkhratsky A., Astrocytic processes: from tripartite synapses to the active milieu. Trends Neurosci, 2021. 44(10): p. 781–792. - PubMed
    1. Allen N.J. and Eroglu C., Cell Biology of Astrocyte-Synapse Interactions. Neuron, 2017. 96(3): p. 697–708. - PMC - PubMed
    1. Clavreul S., et al. , Cortical astrocytes develop in a plastic manner at both clonal and cellular levels. Nat Commun, 2019. 10(1): p. 4884. - PMC - PubMed
    1. Torres-Ceja B. and Olsen M.L., A closer look at astrocyte morphology: Development, heterogeneity, and plasticity at astrocyte leaflets. Curr Opin Neurobiol, 2022. 74: p. 102550. - PMC - PubMed
    1. Farizatto K.L.G. and Baldwin K.T., Astrocyte-synapse interactions during brain development. Curr Opin Neurobiol, 2023. 80: p. 102704. - PubMed

Publication types