[Preprint]. 2024 Aug 27:2024.08.26.608813.
doi: 10.1101/2024.08.26.608813.

Epididymis-specific RNase A family genes regulate fertility and small RNA processing

Affiliations

Epididymis-specific RNase A family genes regulate fertility and small RNA processing

Joshua F Shaffer et al. bioRxiv. .

Update in

Abstract

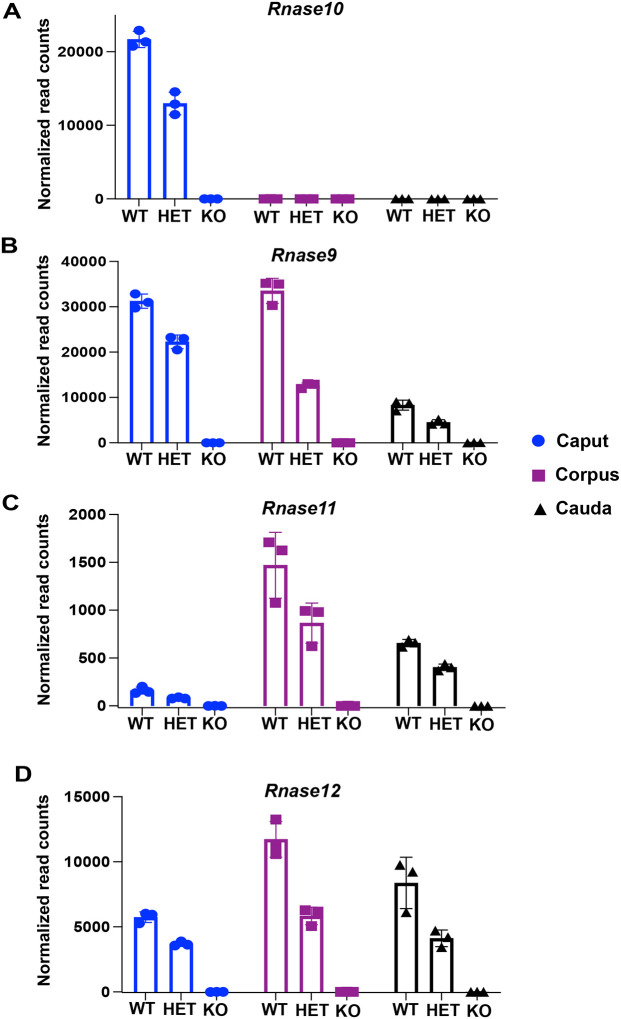
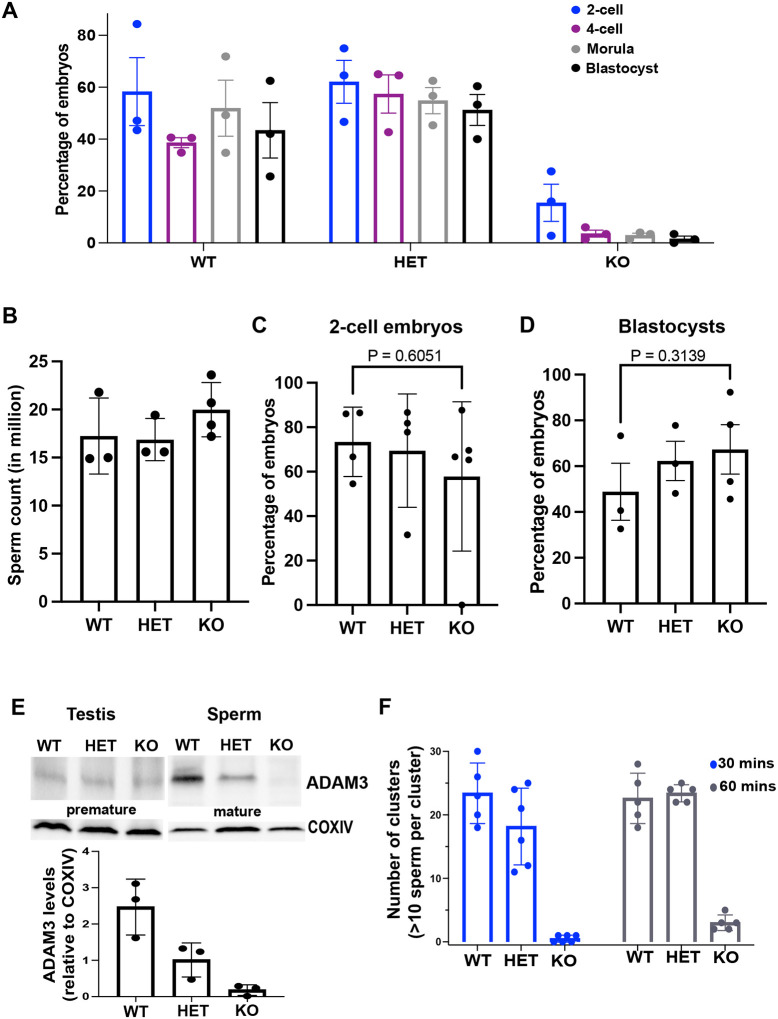
Sperm small RNAs are implicated in intergenerational transmission of paternal environmental effects. Small RNAs generated by cleavage of tRNAs, known as tRNA fragments (tRFs), are an abundant class of RNAs in mature sperm, and can be modulated by environmental conditions. The ribonuclease(s) responsible for the biogenesis of tRFs in the male reproductive tract remains unknown. Angiogenin, a member of the Ribonuclease A superfamily (RNase A), cleaves tRNAs to generate tRFs in response to cellular stress. Four paralogs of Angiogenin, namely Rnase9, Rnase10, Rnase11, and Rnase12, are specifically expressed in the epididymis-a long, convoluted tubule where sperm mature and acquire fertility and motility. The biological functions of these genes remain largely unknown. Here, by generating mice deleted for all four genes (Rnase9-12-/-, termed "KO" for Knock Out), we report that these genes regulate fertility and RNA processing. KO mice showed complete male sterility. KO sperm fertilized oocytes in vitro but failed to efficiently fertilize oocytes in vivo, likely due to an inability of sperm to pass through the utero-tubular junction. Intriguingly, there were decreased levels of fragments of tRNAs (tRFs) and rRNAs (rRNA-derived small RNAs or rsRNAs) in the KO epididymis and epididymal luminal fluid, implying that Rnase9-12 regulate the biogenesis and/or stability of tRFs and rsRNAs. Importantly, KO sperm showed a dramatic decrease in the levels of tRFs, demonstrating a role of Rnase9-12 in regulating sperm RNA composition. Together, our results reveal an unexpected role of four epididymis-specific non-canonical RNase A family genes in fertility and RNA processing.


Conflict of interest statement

DECLARATION OF INTERESTS The authors declare no competing interests.

Figures

Figure 1:
Figure 1:. Generation of mice with deletion of a genomic locus harboring four reproductive-tract-specific RNase A family genes.
Normalized read counts of Rnase10 (A), Rnase9 (B), Rnase11 (C), and Rnase12 (D) from mRNA-seq performed on the caput, corpus, and cauda epididymis tissues of wild-type (WT), heterozygous deletion (HET) and homozygous deletion (KO) males. Normalized read counts were obtained using DESeq2 analysis, and bar graphs represent read counts from three biological replicates.
Figure 2:
Figure 2:. Loss of male fertility in Rnase9-12 KO mice.
A) Number of pups obtained per litter from a mating between wild-type (WT) females and males that were either WT, HET, or KO. Each data point represents an independent litter resulting from the following breeding pairs: 3 (WT male X WT female), 5 (HET male X WT female), and 8 (KO male X WT female, p-value <0.0001). B-C) Frequency of litters born days after the start of the breeding cages of females (B) or males (C) of WT, HET, and KO genotypes with WT animals of the opposite sex. D) Number of pups obtained per litter from a mating between WT females and WT males, males heterozygous for a deletion of the Rnase10 gene (Rnase10 −/+), or males homozygous for a deletion of the Rnase10 gene (Rnase10−/−), p-value = 0.0035). **** p-value <0.0001, ** p-value <0.01, ns (not significant).
Figure 3:
Figure 3:. Rnase9-12 KO sperm are capable of fertilizing oocytes in vitro.
A) Percentage of embryos at specific preimplantation developmental stages. WT females were mated with WT, HET, or KO males overnight, and oocytes were collected from females that showed copulatory plugs the next day. The fertilized oocytes were allowed to develop in vitro to the blastocyst stage, and embryos at each stage were qualified as the percent of total oocytes that reached the specific developmental stage. For example, the percentage of 2-cell embryos was calculated as a percentage of oocytes that reached the 2-cell stage. The experiment was performed with 3 males per genotype and 7–9 total females per genotype. B) Total cauda epididymis sperm count in WT, HET and KO males. C-D) Oocytes from WT females were in vitro fertilized using sperm from WT, HET, or KO males. The plots show the percentage of oocytes that developed to the 2-cell embryo stage (C) and the percentage of 2-cell embryos that reached the blastocyst stage (D). E) Western blot analysis of mature ADAM3 protein levels in WT, HET, and KO sperm. A premature form of ADAM3 was detected in the testis (~100 kDa), and mature ADAM3 was detected in cauda sperm (~30 kDa). COXIV was used as a loading control. The bar graph represents the quantification of ADAM3 levels relative to COXIV in three independent biological replicates. F) Bar graph depicting the number of sperm clusters observed in the three genotypes. Sperm aggregates (10 or more sperm per cluster) in each microscopic field were calculated in three independent biological replicates. Representative microscopic images are included in supplementary Figure S2.
Figure 4:
Figure 4:. Transcriptomic and proteomic alterations in Rnase9-12 KO epididymides.
A) Volcano plot showing mRNA-seq results from DESeq2 analysis of significantly differentially expressed transcripts in the KO cauda epididymis relative to the WT (n=3 biological replicates). As Rnase9-12 genes showed the highest and most significant changes in mRNA abundance, those four genes were removed from this plot to make other changes discernable. Volcano plots with all genes in all three regions of the epididymis are included in Figure S3. B) Gene Ontology Reactome Pathway enrichment analysis of significantly downregulated genes in cauda epididymis tissue. C) Cytokine and chemokine levels in the cauda epididymal fluid of WT and KO mice.
Figure 5:
Figure 5:. Small RNA abundance changes in the Rnase9-12 KO epididymis.
A) Percentage of tRF and rsRNA reads in the cauda epididymis tissues of WT and KO mice (n=3 biological replicates). B) Volcano plot showing differentially expressed small RNAs in the KO cauda epididymis relative to the WT cauda epididymis. tRFs are labeled red, tRNAs are green, rsRNAs are blue, and all other RNAs are black. The dashed lines show the cut-off used for calling significantly differentially expressed transcripts. The number of significantly differentially expressed transcripts (Log2Fold change >1 and padj value <0.05) as determined by DESeq2 analysis are shown in the right panel. C) Histograms showing tRF (tRF_5’, tRF_3’ and tRF_other) and rsRNA abundance changes in KO cauda epididymis relative to the WT. The X-axis shows the log2 fold change of the median of normalized reads, and the Y-axis shows the total count of tRFs or rsRNAs. D) Northern blot analysis of fragments derived from tRNA-ValCAC and 5S rRNA. Arrows indicate the fragments that were quantified. E) Quantification of tRF-ValCAC and 5S rsRNA levels relative to U6. F) Heatmap showing log2 mean of normalized read counts of top tRFs significantly differentially expressed between KO and WT cauda epididymides.
Figure 6:
Figure 6:. Reduced levels of tRFs in the epididymal luminal fluid of Rnase9-12 KO mice.
A) Percentage of reads of different RNA classes sequenced from the epididymal fluid (n=3 biological replicates). tRFs are fragments mapping to tRNA genes and are further classified for downstream analysis as a 5’, 3’, or “other” fragment based on the read alignment with respect to the ends of the respective tRNA (see Materials and Methods). The epididymal fluid had a high abundance of reads mapping to tRFs (> 85%). B) Volcano plot showing differentially expressed small RNAs in KO corpus epididymal fluid relative to WT. tRFs are labeled red, tRNAs are green, rsRNAs are blue, and all other RNAs are black. The dashed lines show the cut-off used for calling significantly differentially expressed transcripts. The number of significantly differentially expressed transcripts (Log2Fold change >1 and padj value <0.05) as determined by DESeq2 analysis are shown in the right panel. C) The heatmap shows the abundance (Log2 mean of normalized read counts) of tRFs in the epididymal fluid across all segments of the epididymis. Top differentially expressed tRFs in the KO corpus epididymal fluid relative to the WT are shown. Notably, most of these tRFs are also downregulated in the KO caput epididymal fluid relative to the WT. D) Heatmap showing Log2 fold change of top differentially expressed full-length tRNAs in the KO caput, corpus, and cauda epididymal fluid relative to WT. E) RNase activity measurement in the epididymal fluid collected from WT and KO mice (n=2). Purified RNase A and water were used as positive and negative controls. The bar graph represents mean ± SEM.
Figure 7:
Figure 7:. Changes in small RNA abundance in sperm from KO mice.
A) Percentage of reads that mapped to tRFs in WT and KO sperm (n=4 biological replicates). B) The volcano plot shows differentially expressed small RNAs in KO sperm relative to WT. tRFs are labeled red, tRNAs are green, rsRNAs are blue, and all other RNAs are black. The dashed lines show the cut-off used for calling significantly differentially expressed transcripts. The number of significantly differentially expressed transcripts (Log2Fold change >1 and padj value <0.05) as determined by DESeq2 analysis are shown in the right panel. C) tRF (tRF_5’, tRF_3’ and tRF_other) and miRNA abundance change in KO sperm relative to WT sperm. The X-axis is the log2 fold change of the median of normalized reads, and the Y-axis shows the total number of tRFs or miRNAs. D) The heatmap shows the log2 mean of normalized read counts of top tRFs, which is significantly differentially expressed between KO and WT sperm.

References

    1. Orgebin-Crist M.C., Sperm maturation in rabbit epididymis. Nature, 1967. 216(5117): p. 816–8. - PubMed
    1. Bjorkgren I. and Sipila P., The impact of epididymal proteins on sperm function. Reproduction, 2019. 158(5): p. R155–R167. - PubMed
    1. Breton S., et al., Regulation of epithelial function, differentiation, and remodeling in the epididymis. Asian J Androl, 2016. 18(1): p. 3–9. - PMC - PubMed
    1. Cornwall G.A., New insights into epididymal biology and function. Human Reproduction Update, 2009. 15(2): p. 213–227. - PMC - PubMed
    1. Gervasi M.G. and Visconti P.E., Molecular changes and signaling events occurring in spermatozoa during epididymal maturation. Andrology, 2017. 5(2): p. 204–218. - PMC - PubMed

Publication types