[Preprint]. 2024 Aug 22:arXiv:2408.12715v1.

Programmable scanning diffuse speckle contrast imaging of cerebral blood flow

Affiliations

Programmable scanning diffuse speckle contrast imaging of cerebral blood flow

Faezeh Akbari et al. ArXiv. .

Update in

Abstract

Significance: Cerebral blood flow (CBF) imaging is crucial for diagnosing cerebrovascular diseases. However, existing large neuroimaging techniques with high cost, low sampling rate, and poor mobility make them unsuitable for continuous and longitudinal CBF monitoring at the bedside.

Aim: This study aimed to develop a low-cost, portable, programmable scanning diffuse speckle contrast imaging (PS-DSCI) technology for fast, high-density, and depth-sensitive imaging of CBF in rodents.

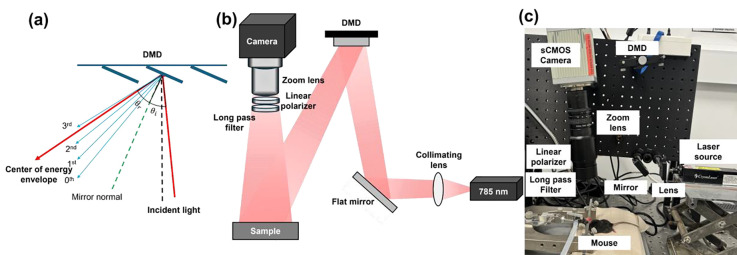
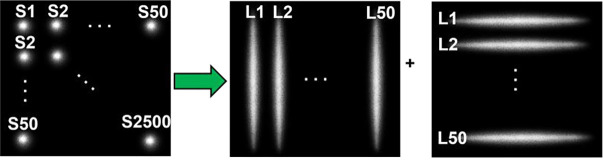
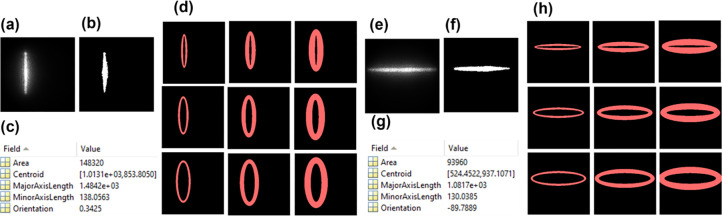
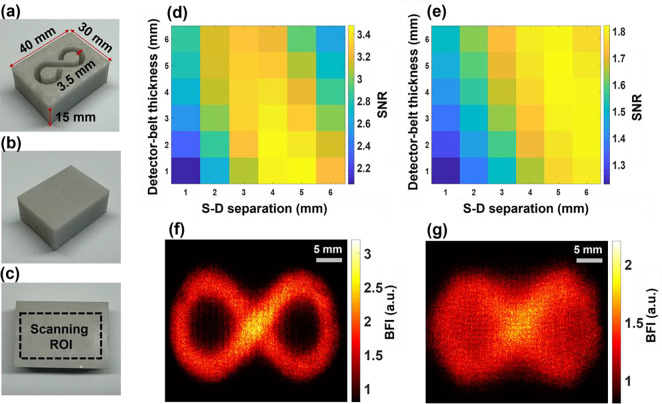
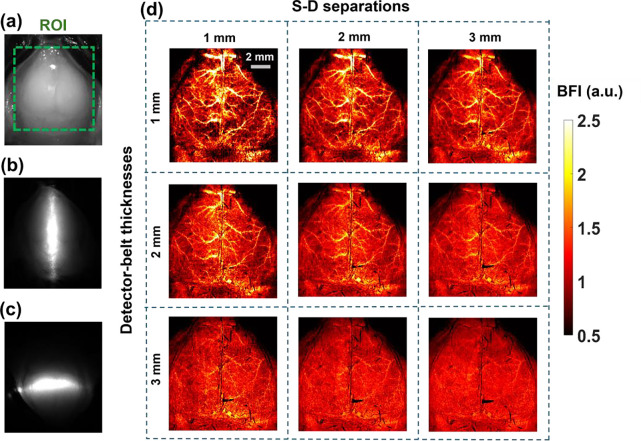
Approach: The PS-DSCI employed a programmable digital micromirror device (DMD) for remote line-shape laser (785 nm) scanning on tissue surface and synchronized a 2D camera for capturing boundary diffuse laser speckle contrasts. New algorithms were developed to address deformations of line-shape scanning, thus minimizing CBF reconstruction artifacts. The PS-DSCI was examined in head-simulating phantoms and adult mice.

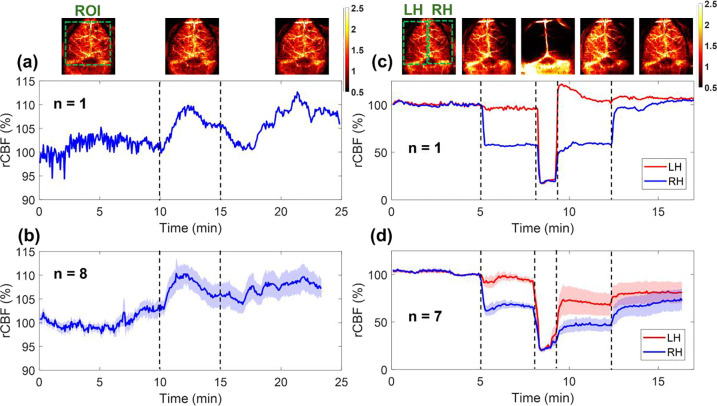
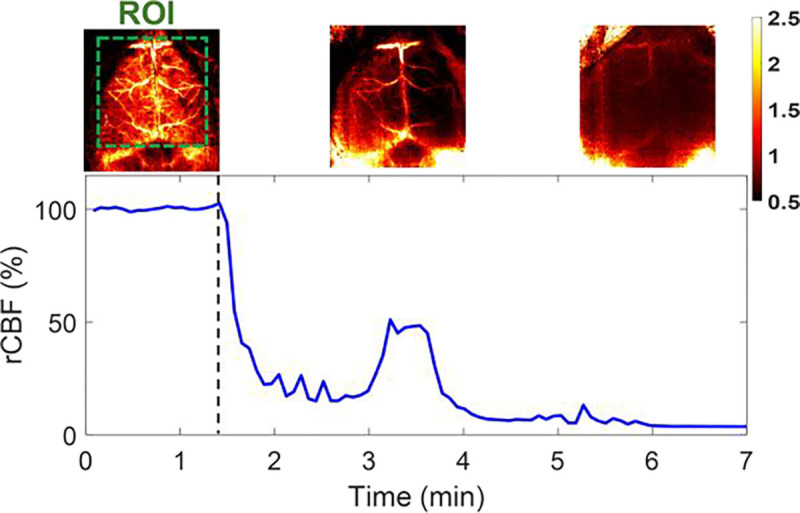
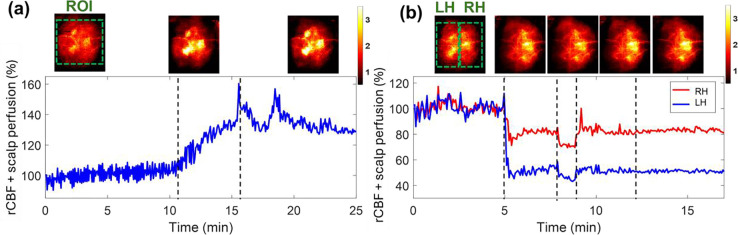
Results: The PS-DSCI enables resolving Intralipid particle flow contrasts at different tissue depths. In vivo experiments in adult mice demonstrated the capability of PS-DSCI to image global/regional CBF variations induced by 8% CO2 inhalation and transient carotid artery ligations.

Conclusions: Compared to conventional point scanning, the line scanning in PS-DSCI significantly increases spatiotemporal resolution. The high sampling rate of PS-DSCI is crucial for capturing rapid CBF changes while high spatial resolution is important for visualizing brain vasculature.

Keywords: cerebral blood flow; diffuse optics; digital micromirror device; line-shape scanning; speckle contrast imaging.


Figures

Fig. 1
Fig. 1
PS-DSCI system. (a) The distribution of diffraction orders and energy envelope reflected by the DMD, which are dependent on the angle of incidence (θi) and angle of reflection (θr). θr represents the center of energy envelope distribution. (b) Schematic of the PS-DSCI prototype. (c) A photo of PS-DSCI prototype.
Fig. 2
Fig. 2
Point scanning (scDCT) versus line scanning (PS-DSCI). In contrast to 2500 scanning points (S1 to S2500) by scDCT, PS-DSCI scans the same ROI with 100 scanning lines (L1 to L50, along vertical and horizontal directions, respectively).
Fig. 3
Fig. 3
Extraction of detector area/belt around line-shape source. (a) and (e) Raw intensity images of vertical and horizontal oval-shape sources, respectively. (b) and (f) Binary masks of vertical and horizontal oval-shape sources, respectively. (c) and (g) An example of vertical and horizontal oval-shaped source properties extracted using the `regionprops` function in MATLAB's Image Processing Toolbox. (d) and (h) The elliptical-shape detector belts with varied S-D separations of 1 to 3 mm and varied detector-belt thicknesses of 1 to 3 mm.
Fig. 4
Fig. 4
Depth-sensitive 2D mapping of Intralipid particle flow in head-simulating phantoms. (a) Top view of fabricated solid phantom with the infinity-shape channel, designed to be filled with the liquid phantom. (b) Bottom view of the fabricated phantom. (c) The selected ROI on the bottom of the phantom. (d) The SNR distribution with varied S-D separations (1 to 6 mm) and detector-belt thicknesses (1 to 6 mm) for the phantom with top layer thickness of 1 mm. (e) The SNR distribution with varied S-D separations (1 to 6 mm) and detector-belt thicknesses (1 to 6 mm) for the phantom with top layer thickness of 2 mm. (f) The 2D flow map of head-simulating phantom with the top layer of 1 mm thickness. The S-D separation and detector-belt thickness for flow map reconstruction were 4 mm and 2 mm, respectively. (g) The 2D flow map of head-simulating phantom with the top layer of 2 mm thickness. The S-D separation and detector-belt thickness for flow map reconstruction were 5 mm and 4 mm, respectively.
Fig. 5
Fig. 5
2D maps of BFI at different depths in a representative mouse (#7). (a) The selected ROI for BFI mapping on the exposed skull with its scalp retracted. (b) The speckle image with a vertical scanning line on the ROI. (c) The speckle image with a horizontal scanning line on the ROI. (d) 2D maps of BFI with varied S-D separations of 1 to 3 mm and detector-belt thicknesses of 1 to 3 mm.
Fig. 6
Fig. 6
Continuous mapping of rCBF variations during 8% CO2 inhalations and transient carotid artery ligations in mice with intact skulls. (a) BFI maps and time-course rCBF changes before, during, and after 8% CO2 inhalation in an illustrative mouse (mouse #8). The dash lines separate 10 mins of baseline, 5 mins of CO2 inhalation, and 10 mins of recovery, respectively. The ROI for data analysis of rCBF time-course changes is shown in the first BFI map. (b) Group average time-course rCBF changes during 8% CO2 inhalations in 8 mice (mouse #1 to mouse #8). The error bars represent standard errors. (c) BFI maps and time-course rCBF changes during transient carotid artery ligations in an illustrative mouse (mouse #8). The dash lines separate the 5 mins of baseline, 3 mins of right carotid artery ligation, 1 min of bilateral ligation, 3 mins of left carotid artery release, and 5 mins of right carotid artery release. The ROI of LH and RH for data analyses of rCBF time-course changes are shown in the first BFI map. (d) Group average time-course rCBF changes during transient carotid artery ligations in 7 mice (mouse #1 to mouse #4 and mouse #6 to mouse #8). The error bars represent standard errors.
Fig. 7
Fig. 7
Continuous mapping of rCBF variations during 100% CO2 inhalations in mouse #8 with an intact skull. BFI maps and time-course rCBF changes in mouse #8 before and during 100% CO2 inhalation until its death. More than 95% decrease in rCBF was observed at the end of the experiment when mouse #8 died. The dash line separates the baseline and 100% CO2 inhalation phases. The ROI for data analysis of rCBF time-course changes is shown in the first BFI map.
Fig. 8
Fig. 8
Continuous mapping of rCBF variations during 8% CO2 inhalations and transient carotid artery ligations in mouse #9 with an intact head. (a) BFI maps and time-course rCBF changes before, during, and after 8% CO2 inhalation in mouse with intact head. The dash lines separate 10 mins of baseline, 5 mins of CO2 inhalation, and 10 mins of recovery, respectively. The ROI for data analysis of rCBF time-course changes is shown in the first BFI map. (b) BFI maps and time-course rCBF changes during transient carotid artery ligations in a mouse with intact head. The dash lines separate the 5 mins of baseline, 3 mins of left carotid artery ligation, 1 min of bilateral ligation, 3 mins of right carotid artery release, and 5 mins of left carotid artery release. The ROI of LH and RH for data analysis of rCBF time-course changes are shown in the first BFI map.

References

    1. Zhu M., Ackerman J.J., and Yablonskiy D.A., Body and brain temperature coupling: the critical role of cerebral blood flow. Journal of Comparative Physiology B, 2009. 179: p. 701–710. - PMC - PubMed
    1. Willie C.K., et al. , Integrative regulation of human brain blood flow. The Journal of physiology, 2014. 592(5): p. 841–859. - PMC - PubMed
    1. Claassen J.A., et al. , Regulation of cerebral blood flow in humans: physiology and clinical implications of autoregulation. Physiological reviews, 2021. 101(4): p. 1487–1559. - PMC - PubMed
    1. Bandera E., et al. , Cerebral blood flow threshold of ischemic penumbra and infarct core in acute ischemic stroke: a systematic review. Stroke, 2006. 37(5): p. 1334–1339. - PubMed
    1. Yonas H., et al. , Increased stroke risk predicted by compromised cerebral blood flow reactivity. Journal of neurosurgery, 1993. 79(4): p. 483–489. - PubMed

Publication types

LinkOut - more resources