. 2024 Aug 19:38:100864.
doi: 10.1016/j.lana.2024.100864. eCollection 2024 Oct.

Coccidioidomycosis seasonality in California: a longitudinal surveillance study of the climate determinants and spatiotemporal variability of seasonal dynamics, 2000-2021

Affiliations

Coccidioidomycosis seasonality in California: a longitudinal surveillance study of the climate determinants and spatiotemporal variability of seasonal dynamics, 2000-2021

Alexandra K Heaney et al. Lancet Reg Health Am. .

Abstract

Background: Coccidioidomycosis, an emerging fungal disease in the western USA, exhibits seasonal patterns that are poorly understood, including periods of strong cyclicity, aseasonal intervals, and variation in seasonal timing that have been minimally characterized, and unexplained as to their causal factors. Coccidioidomycosis incidence has increased markedly in recent years, and our limited understanding of intra- and inter-annual seasonality has hindered the identification of important drivers of disease transmission, including climate conditions. In this study, we aim to characterize coccidioidomycosis seasonality in endemic regions of California and to estimate the relationship between drought conditions and coccidioidomycosis seasonal periodicity and timing.

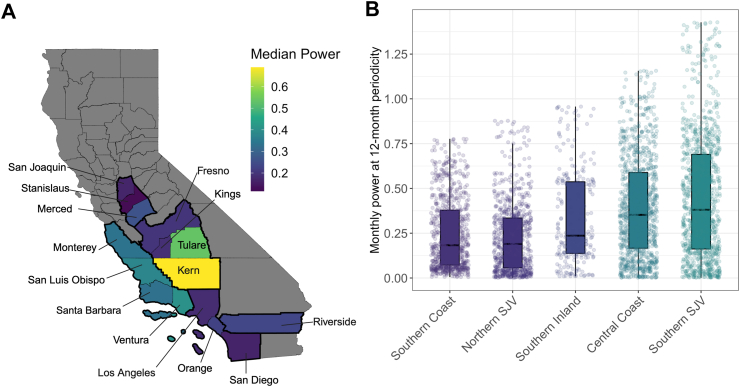
Methods: We analysed data on all reported incident cases of coccidioidomycosis in California from 2000 to 2021 to characterize seasonal patterns in incidence, and conducted wavelet analyses to assess the dominant periodicity, power, and timing of incidence for 17 counties with consistently high incidence rates. We assessed associations between seasonality parameters and measures of drought in California using a distributed lag nonlinear modelling framework.

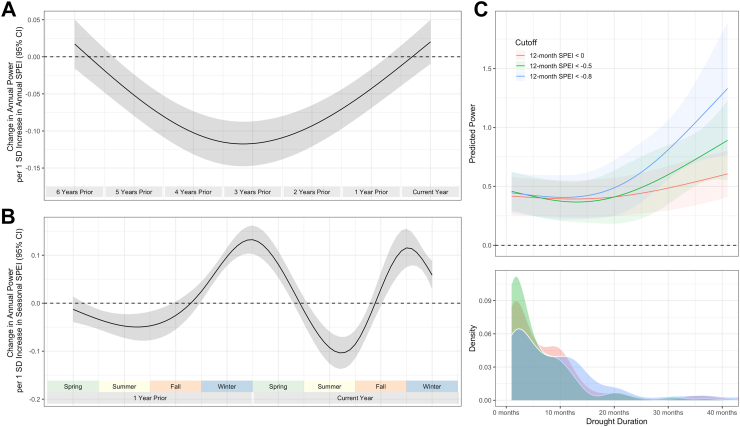
Findings: All counties exhibited annual cyclicity in incidence (i.e., a dominant wavelet periodicity of 12 months), but there was considerable heterogeneity in seasonal strength and timing across regions and years. On average, 12-month periodicity was most pronounced in the Southern San Joaquin Valley and Central Coast. Further, the annual seasonal cycles in the Southern San Joaquin Valley and the Southern Inland regions occurred earlier than those in coastal and northern counties, yet the timing of annual cycles became more aligned among counties by the end of the study period. Drought conditions were associated with a strong attenuation of the annual seasonal cycle, and seasonal peaks became more pronounced in the 1-2 years after a drought ended.

Interpretation: We conclude that drought conditions do not increase the risk of coccidioidomycosis onset uniformly across the year, but instead promote increased risk concentrated within a specific calendar period (September to December). The findings have important implications for public health preparedness, and for how future shifts in seasonal climate patterns and extreme events may impact spatial and temporal coccidioidomycosis risk.

Funding: National Institutes of Health.

Keywords: Coccidioides; Coccidioidomycosis; Drought; Emerging infectious disease; Fungal infections; Seasonality.


Conflict of interest statement

The authors declared no conflicts of interest.

Figures

Fig. 1
Fig. 1
(A) Mean annual incidence of coccidioidomycosis between the years 2000 and 2021. Counties included in the analyses are outlined and labeled in black. Regions are outlined and labeled in red. (B) Heat map of the proportion of coccidioidomycosis incidence in each month across all 17 included California counties from 2000 to 2021. Colors represent the proportion of annual cases—defined by transmission year (March–February)—that occurred in each month. Counties are grouped by the five California Department of Public Health-defined regions with consistently high incidence of Northern San Joaquin Valley, Central Coast, Southern San Joaquin Valley, Southern Coast, and Southern Inland, and counties within groups are ordered by decreasing latitude of centroids. (C) Heat map of the proportion of coccidioidomycosis incidence in each month across all included California counties from 2000 to 2021. Colors represent the monthly proportion of total incidence across all years, and counties are grouped by region and county centroids as in (b).
Fig. 2
Fig. 2
(A) The power spectrum from wavelet analyses for each county and periodicities 11–13 months (y-axis) from 2000 to 2021 (x-axis). The power color scale is a relative scale spanning the maximum and minimum power estimates for each county. Supplementary Figures S5–S21 show the numerical power estimates for each county. (B) Periods of statistically significant (p < 0.05) 12-month periodicity for each county from 2000 to 2021 shown as black lines. (C) Boxplot of county-level average power across transmission years (defined as March–February). Light grey shading shows periods of moderate to severe drought in California as defined by the U.S. Drought Monitor (2000–2002; 2007–2009; 2012–2015; 2020–2021).
Fig. 3
Fig. 3
(A) Map of median power at 12-month periodicity for each county in the study region from 2000 to 2021. CDPH-defined endemic regions are outlined with black lines. (B) Boxplot of monthly power at 12-month periodicity across all counties and years within each of the five CDPH-defined endemic regions (x-axis). SJV = San Joaquin Valley.
Fig. 4
Fig. 4
(A) Map of the median monthly phase difference of each county from all other counties from 2000 to 2021. Orange colors represent earlier seasonal coccidioidomycosis cycles and blue represents later seasonal cycles. (B) Boxplots of the difference in monthly phase at 12-month periodicity between each county and all other counties from 2000 to 2021. Regions are ordered by decreasing median phase difference.
Fig. 5
Fig. 5
Results of distributed lag nonlinear model estimating the association between annual wavelet power and (A) shorter-term seasonal (3-month) SPEI and (B) longer-term annual (12-month) SPEI. Estimates at each lag represent the increase in annual wavelet power per 1 standard deviation (SD) increase in seasonal SPEI, with the 95% confidence interval represented by the grey shading. The dashed line indicates the null hypothesis that there is no effect of SPEI on annual power. (C) Model predictions of annual wavelet power following droughts of various lengths were obtained from a generalized additive model, with the density of observations for drought durations shown beneath. The colored lines indicate different drought definitions (red = SPEI <0; green = SPEI < −0.5; blue = SPEI < −0.8).

References

    1. Obando-Pacheco P., Justicia-Grande A.J., Rivero-Calle I., et al. Respiratory syncytial virus seasonality: a global overview. J Infect Dis. 2018;217:1356–1364. - PubMed
    1. Tamerius J., Nelson M.I., Zhou S.Z., Viboud C., Miller M.A., Alonso W.J. Global influenza seasonality: reconciling patterns across temperate and tropical regions. Environ Health Perspect. 2011;119:439–445. - PMC - PubMed
    1. Marr L.C., Tang J.W., Van Mullekom J., Lakdawala S.S. Mechanistic insights into the effect of humidity on airborne influenza virus survival, transmission and incidence. J R Soc Interface. 2019;16 - PMC - PubMed
    1. Fisman D.N. Seasonality of infectious diseases. Annu Rev Public Health. 2007;28:127–143. - PubMed
    1. Van Dyke M.C.C., Thompson G.R., Galgiani J.N., Barker B.M. The rise of Coccidioides: forces against the dust devil unleashed. Front Immunol. 2019;10 doi: 10.3389/fimmu.2019.02188. - DOI - PMC - PubMed