. 2024 Sep 10;9(17):e171659.
doi: 10.1172/jci.insight.171659.

Emergence of dysfunctional neutrophils with a defect in arginase-1 release in severe COVID-19

Affiliations

Emergence of dysfunctional neutrophils with a defect in arginase-1 release in severe COVID-19

Amrita Dwivedi et al. JCI Insight. .

Abstract

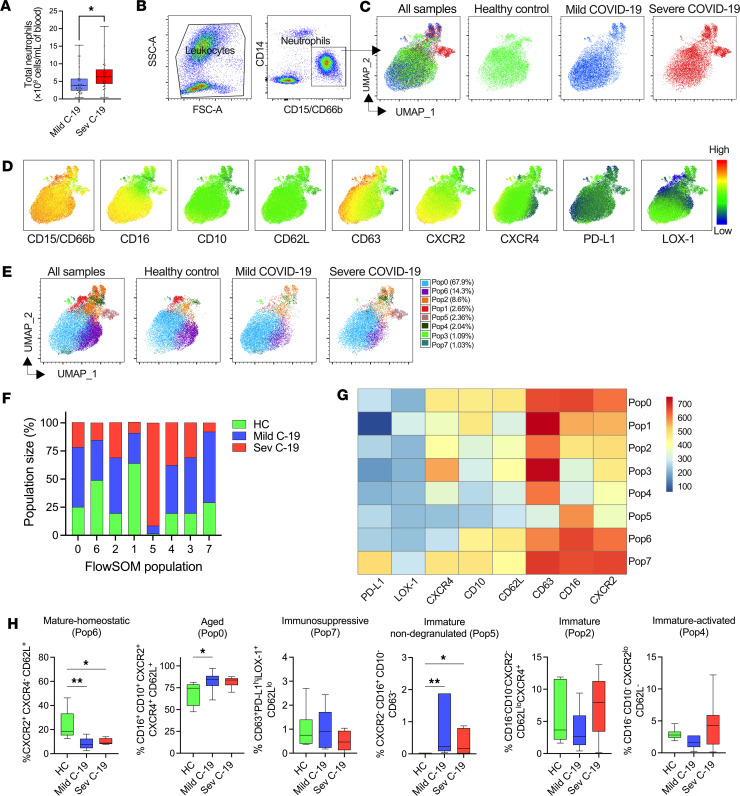
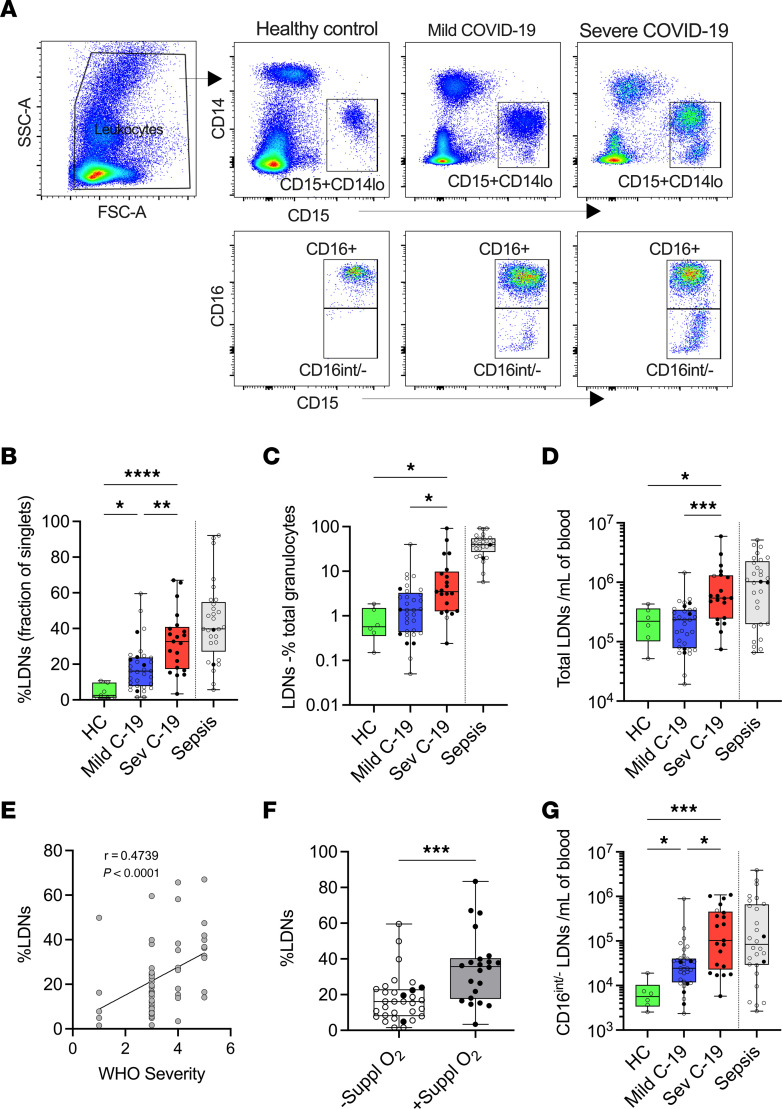
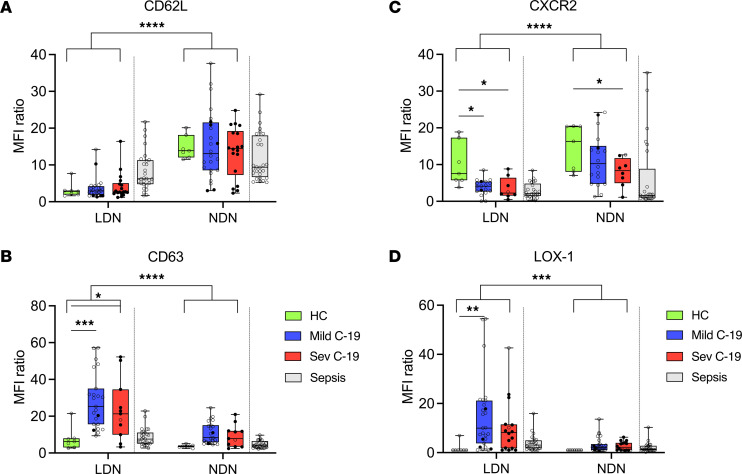
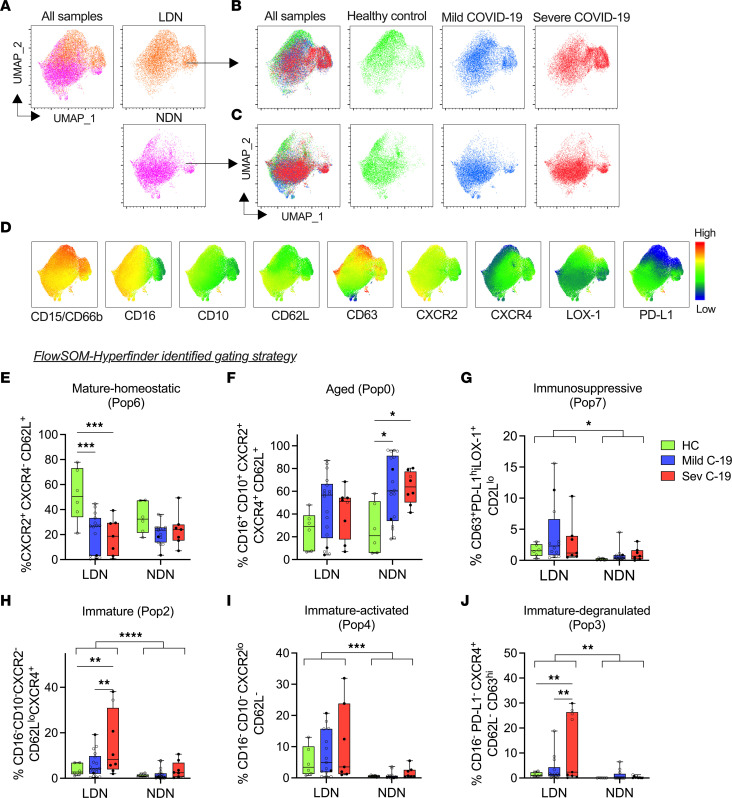
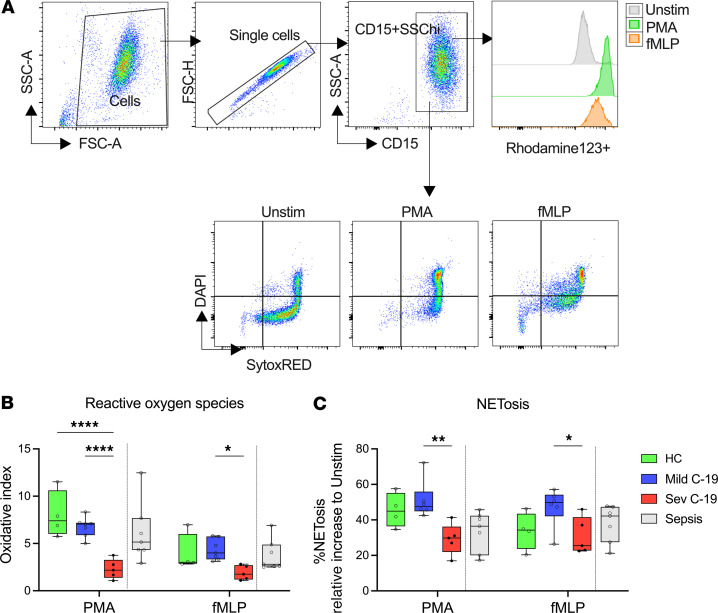
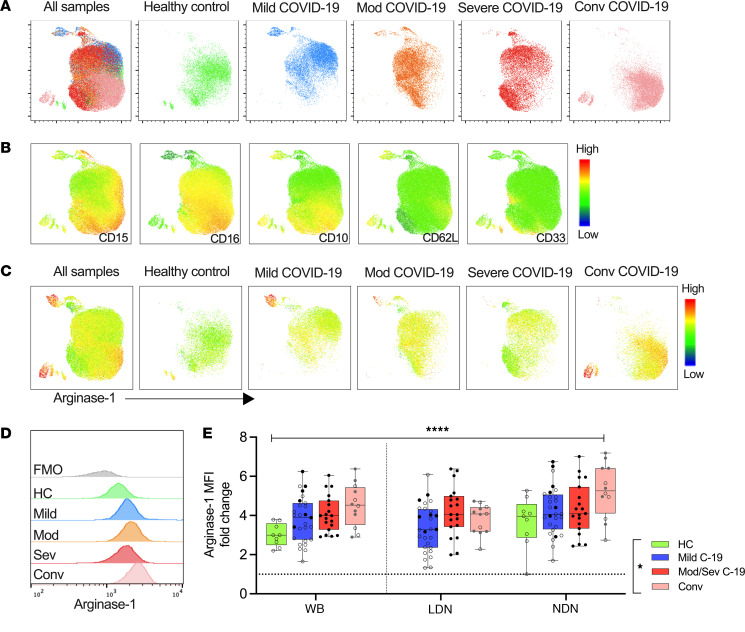
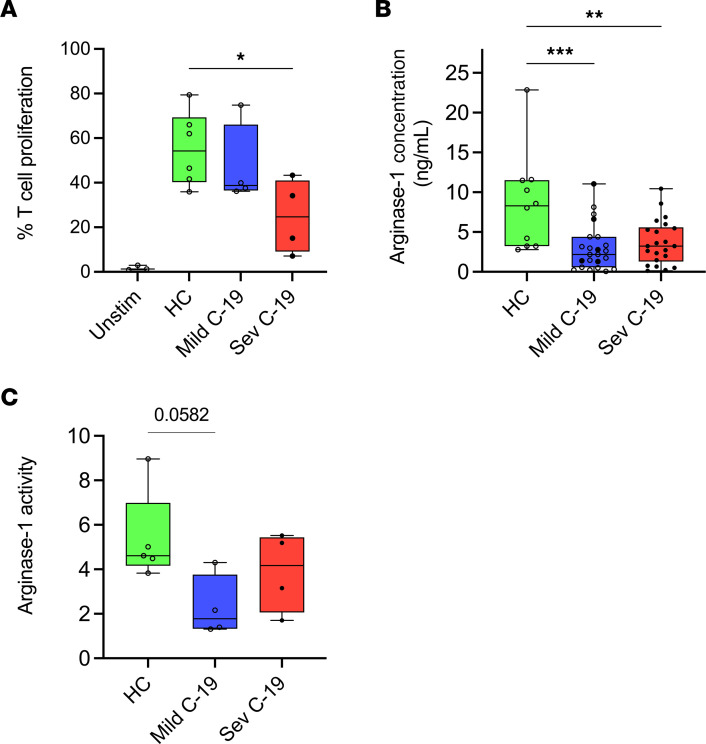
Neutrophilia occurs in patients infected with SARS-CoV-2 (COVID-19) and is predictive of poor outcomes. Here, we link heterogenous neutrophil populations to disease severity in COVID-19. We identified neutrophils with features of cellular aging and immunosuppressive capacity in mild COVID-19 and features of neutrophil immaturity and activation in severe disease. The low-density neutrophil (LDN) number in circulating blood correlated with COVID-19 severity. Many of the divergent neutrophil phenotypes in COVID-19 were overrepresented in the LDN fraction and were less detectable in normal-density neutrophils. Functionally, neutrophils from patients with severe COVID-19 displayed defects in neutrophil extracellular trap formation and reactive oxygen species production. Soluble factors secreted by neutrophils from these patients inhibited T cell proliferation. Neutrophils from patients with severe COVID-19 had increased expression of arginase-1 protein, a feature that was retained in convalescent patients. Despite this increase in intracellular expression, there was a reduction in arginase-1 release by neutrophils into serum and culture supernatants. Furthermore, neutrophil-mediated T cell suppression was independent of arginase-1. Our results indicate the presence of dysfunctional, activated, and immature neutrophils in severe COVID-19.

Keywords: COVID-19; Immunology; Neutrophils.


Figures

Figure 1
Figure 1. Phenotypic analysis of whole blood neutrophils reveals distinct neutrophil populations in mild and severe COVID-19.
Fresh whole blood from healthy controls and patients with COVID-19 was subjected to phenotypic analysis using a combination of markers identifying the activation, maturation, and immunomodulatory status of neutrophils. (A) Total neutrophil count from patients with mild (n = 41) and severe (n = 29) COVID-19. (B) Flow cytometric gating strategy for identification of neutrophils in whole blood. (C) A total of 63,000 cells concatenated from 6 healthy controls (HC) and 10 patients with mild COVID-19 and 5 patients with severe COVID-19 were visualized using uniform manifold approximation and projection (UMAP) for dimensionality reduction. The UMAPs of all samples and separate study groups are shown. (D) Median fluorescence intensity (MFI) heatmap of surface markers projected on UMAP. (E) Distribution of identified FlowSOM populations overlaid on the UMAPs. (F) Frequency of the FlowSOM populations within HC (n = 6) and patients with mild (n = 10) and severe (n = 5) COVID-19. (G) Heatmap of selected surface markers in the 8 FlowSOM populations (Pop). (H) The HyperFinder plugin in FlowJo was used to determine the shortest gating strategy for the identified FlowSOM populations. Fraction of mature-homeostatic (HC, n = 6; mild C-19, n = 10; sev C-19, n = 5), aged (HC, n = 6; mild C-19, n = 17; sev C-19, n = 6), immunosuppressive (HC, n = 6; mild C-19, n = 10; sev C-19, n = 8), immature non-degranulated (HC, n = 6; mild C-19, n = 10; sev C-19, n = 9), immature (HC, n = 6; mild C-19, n = 18; sev C-19, n = 8), immature-activated (HC, n = 6; mild C-19, n = 15; sev C-19, n = 7). Statistical analysis performed using 2-tailed Mann-Whitney test (A). Differences between HC and mild and severe groups were analyzed using ordinary 1-way ANOVA with Tukey’s multiple comparisons test. *P < 0.05; **P < 0.01. Median with IQR is shown.
Figure 2
Figure 2. Severe COVID-19 is associated with a higher frequency of LDNs.
(A) Gating strategy for identification of LDNs from PBMC fraction and discrimination of CD16+ and CD16int/– subsets from different study groups. (B) Fraction of LDNs in PBMCs and (C) in total granulocytes and (D) absolute cell count from healthy controls (HC, n = 6) and patients with mild (n = 33) and severe (n = 21) COVID-19. (E) Spearman’s correlation between frequency of LDNs and WHO severity score (patients with score 1, n = 5; 3, n = 27; 4, n = 10; 5, n = 10). (F) LDN frequency in patients without (n = 32) or with (n = 22) oxygen supplementation. Statistical analysis was performed using Welch’s t test. ***P < 0.001. (G) Absolute cell count of CD16int/– LDNs from HC (n = 6) and patients with mild (n = 33) and severe (n = 21) COVID-19. Solid black dots represent individuals with steroid exposure at the time of sampling. In panels BD and G, the respective values in a contemporaneous cohort of patients with bacterial sepsis are shown in gray; these are not included in the statistical analysis and are shown for comparison purposes only. Differences between HC and mild and severe COVID-19 groups were analyzed using ordinary 1-way ANOVA with Tukey’s multiple comparisons test. *P < 0.05; **P < 0.01; ***P < 0.001; ****P < 0.0001. Median with IQR is shown.
Figure 3
Figure 3. LDNs comprise phenotypically distinct subsets that are associated with severe COVID-19.
PBMCs were isolated from fresh whole blood of controls (HC) and patients and surface stained for various neutrophil markers. MFI ratio of (A) CD62L (HC, n = 7; mild C-19, n = 24; sev C-19, n = 18), (B) CD63 (HC, n = 7; mild C-19, n = 23; sev C-19, n = 11), (C) CXCR2 (HC, n = 7; mild C-19, n = 18; sev C-19, n = 8), and (D) LOX-1 (HC, n = 7; mild C-19, n = 27; sev C-19, n = 16) expression on LDNs and NDNs. Solid black dots represent individuals with steroid exposure at the time of sampling. In each panel, the respective values in a contemporaneous cohort of patients with bacterial sepsis are shown in gray; these are not included in the statistical analysis and are shown for comparison purposes only. Statistical analysis was performed using 2-way ANOVA with Tukey’s multiple comparisons test. *P < 0.05; **P < 0.01; ***P < 0.001; ****P < 0.0001. Median with IQR is shown.
Figure 4
Figure 4. Whole blood–defined neutrophil phenotypes associated with severe disease are enriched in the LDN fraction.
A total of 124,527 CD15+ neutrophils were concatenated from matched PBMCs and NDNs from healthy controls (HC, n = 6) and patients with mild (n = 10) and severe (n = 5) cases as in Figure 1. (A) UMAP of all samples and each fraction is shown. UMAP of healthy, mild, and severe groups within the (B) LDN and (C) NDN fractions. (D) MFI heatmap of selected surface markers projected on the UMAP shown in panel A (all samples). FlowSOM-HyperFinder–defined gating strategy was applied to matched LDN and NDN fractions from the same HC and patients with COVID-19. Fraction of (E) mature-homeostatic (HC, n = 6; mild C-19, n = 15; sev C-19, n = 7), (F) aged (HC, n = 6; mild C-19, n = 18; sev C-19, n = 8), (G) immunosuppressive (HC, n = 6; mild C-19, n = 12; sev C-19, n = 7), (H) immature (HC, n = 6; mild C-19, n = 18; sev C-19, n = 8), (I) immature-activated (HC, n = 6; mild C-19, n = 15; sev C-19, n = 7), and (J) immature-degranulated (HC, n = 6; mild C-14, n = 10; sev C-19, n = 9) neutrophil populations. Solid black dots represent individuals with steroid exposure at the time of sampling. Statistical analysis was performed using 2-way ANOVA with Tukey’s multiple comparisons test. *P < 0.05; **P < 0.01; ***P < 0.001; ****P < 0.0001. Median with IQR is shown.
Figure 5
Figure 5. Neutrophils from patients with severe COVID-19 display impaired ROS and NET production.
Fresh neutrophils were isolated from healthy controls and patients with COVID-19 and stimulated with PMA or fMLP to induce ROS and NET production. (A) Gating strategy to quantify NETs and ROS production in neutrophils. (B) Fold-increase in ROS production in stimulated NDNs over unstimulated NDNs isolated from healthy controls (HC, n = 4) and patients with mild (n = 7) and severe (n = 5) COVID-19. (C) Percentage NETosis in NDNs stimulated with PMA or fMLP from HC (n = 4) and patients with mild (n = 6) and severe (n = 5) COVID-19. Solid black dots represent individuals with steroid exposure at the time of sampling. In panels B and C, the respective values in a contemporaneous cohort of patients with bacterial sepsis are shown in gray; these are not included in the statistical analysis and are shown for comparison purposes only. Statistical analysis was performed using 2-way ANOVA with Tukey’s multiple comparisons test. *P < 0.05; **P < 0.01; ****P < 0.0001. Median with IQR is shown.
Figure 6
Figure 6. Neutrophil arginase-1 expression remains elevated throughout the COVID-19 disease course through to convalescence.
Fresh whole blood was obtained from healthy controls, mild, moderate, severe, and convalescent patients and stained for basal intracellular arginase-1 expression. An equal number of neutrophils from each study group was concatenated and visualized using UMAP. (A) UMAP of all samples and separate study groups (healthy controls [HC], n = 3; mild, n = 4; moderate, n = 4; severe, n = 4; and convalescent, n = 5) is shown. (B) MFI heatmaps showing individual surface marker expression projected onto the UMAP. (C) MFI heatmaps showing intracellular expression of arginase-1 projected onto the UMAP and stratified by disease severity. (D) Overlaid histogram plot of intracellular arginase-1 expression in different disease groups. FMO control is shown for reference. (E) Intracellular arginase-1 expression was quantified in whole blood neutrophils and LDN and NDN fractions from HC (n = 9) and mild (n = 28) and moderate/severe (n = 19) COVID-19 patients and convalescent (n = 12) individuals. The MFI fold-change relative to FMO is presented. Solid black dots and gray dots represent individuals with steroid exposure at the time of sampling and during active disease, respectively. Statistical analysis was performed using mixed effects analysis with Tukey’s multiple comparisons test. *P < 0.05; ****P < 0.001. Median with IQR is shown.
Figure 7
Figure 7. COVID-19 neutrophils suppress T cell proliferation independent of arginase-1 and display an inability to release arginase-1.
PBMCs were isolated from autologous healthy controls and cocultured with cell-free supernatants prepared from isolated neutrophils cultured for 20 hours. (A) Rate of T cell proliferation upon coculture with neutrophil supernatant harvested from healthy controls (HC, n = 6) and patients with mild (n = 4) and severe (n = 6) COVID-19. (B) Arginase-1 concentration (determined by immunoassay) in the serum of HC (n = 10) and patients with mild (n = 23) and severe (n = 22) cases. (C) Arginase-1 activity in culture supernatants of purified neutrophils obtained from HC (n = 4) and patients with mild (n = 4) and severe (n = 4) cases. Solid black dots represent individuals with steroid exposure at the time of sampling. Statistical analysis was performed using Kruskal-Wallis test with Dunn’s multiple comparisons and ordinary 1-way ANOVA with Tukey’s multiple comparisons test. *P < 0.05; **P < 0.01; ***P < 0.001. Median with IQR is shown.
Figure 8
Figure 8. Dexamethasone does not alter intracellular arginase-1 expression but dampens arginase-1 release from healthy neutrophils.
Fresh neutrophils were isolated from healthy controls and pretreated with varying concentrations of dexamethasone (0, 0.1 μM, 1 μM, 10 μM) for 4 hours. Cells were left unstimulated or stimulated with 5 μg/mL fMLP or 200 ng/mL IL-8. Geometric MFI (gMFI) ratio of (A) intracellular arginase-1 expression (n = 5) and (B) surface CXCR2 expression (n = 5) measured using traditional flow cytometry. (C) MPO release (n = 6; n = 2 with dexamethasone conc. 33 μM and 100 μM) and (D) arginase-1 activity (n = 6) measured in supernatants using ELISA and arginase-1 enzyme assay, respectively. Statistical analysis was performed using repeated measures 2-way ANOVA in A, B, and D. C was analyzed using mixed effects analysis. P values represent the effect of dexamethasone concentration, *P < 0.05. Median with IQR is shown.

References

    1. Dennison D, et al. Circulating activated neutrophils in COVID-19: an independent predictor for mechanical ventilation and death. Int J Infect Dis. 2021;106:155–159. doi: 10.1016/j.ijid.2021.03.066. - DOI - PMC - PubMed
    1. Liu J, et al. Neutrophil-to-lymphocyte ratio predicts critical illness patients with 2019 coronavirus disease in the early stage. J Transl Med. 2020;18(1):206. doi: 10.1186/s12967-020-02374-0. - DOI - PMC - PubMed
    1. Ouwendijk WJD, et al. High levels of neutrophil extracellular traps persist in the lower respiratory tract of critically ill patients with coronavirus disease 2019. J Infect Dis. 2021;223(9):1512–1521. doi: 10.1093/infdis/jiab050. - DOI - PMC - PubMed
    1. Middleton EA, et al. Neutrophil extracellular traps contribute to immunothrombosis in COVID-19 acute respiratory distress syndrome. Blood. 2020;136(10):1169–1179. doi: 10.1182/blood.2020007008. - DOI - PMC - PubMed
    1. Barnes BJ, et al. Targeting potential drivers of COVID-19: neutrophil extracellular traps. J Exp Med. 2020;217(6):e20200652. doi: 10.1084/jem.20200652. - DOI - PMC - PubMed