. 2024 Sep 10;9(17):e172336.
doi: 10.1172/jci.insight.172336.

Mitochondrial reprogramming by activating OXPHOS via glutamine metabolism in African American patients with bladder cancer

Affiliations

Mitochondrial reprogramming by activating OXPHOS via glutamine metabolism in African American patients with bladder cancer

Karthik Reddy Kami Reddy et al. JCI Insight. .

Abstract

Bladder cancer (BLCA) mortality is higher in African American (AA) patients compared with European American (EA) patients, but the molecular mechanism underlying race-specific differences are unknown. To address this gap, we conducted comprehensive RNA-Seq, proteomics, and metabolomics analysis of BLCA tumors from AA and EA. Our findings reveal a distinct metabolic phenotype in AA BLCA characterized by elevated mitochondrial oxidative phosphorylation (OXPHOS), particularly through the activation of complex I. The results provide insight into the complex I activation-driven higher OXPHOS activity resulting in glutamine-mediated metabolic rewiring and increased disease progression, which was also confirmed by [U]13C-glutamine tracing. Mechanistic studies further demonstrate that knockdown of NDUFB8, one of the components of complex I in AA BLCA cells, resulted in reduced basal respiration, ATP production, GLS1 expression, and proliferation. Moreover, preclinical studies demonstrate the therapeutic potential of targeting complex I, as evidenced by decreased tumor growth in NDUFB8-depleted AA BLCA tumors. Additionally, genetic and pharmacological inhibition of GLS1 attenuated mitochondrial respiration rates and tumor growth potential in AA BLCA. Taken together, these findings provide insight into BLCA disparity for targeting GLS1-Complex I for future therapy.

Keywords: Cancer; Metabolism; Mitochondria; Oncology; Urology.


Conflict of interest statement

Conflict of interest: AS is Scientific Advisor to Karkinos Health Care Pvt Ltd., India, and is an unpaid visiting faculty to Sri Sathya Sai Institute for Higher Learning, India.

Figures

Figure 1
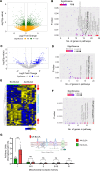
Figure 1. Identification of complex I–mediated OXPHOS activity in AA BLCA.
(A) Volcano plot represents differentially expressed genes between AA BLCA (n = 13) and EA BLCA (n = 15) using RNA-Seq data (2-way comparison; P < 0.05 denoted as green dots; nonsignificant denoted as yellow dots). (B) Graphical representation of hallmark pathways obtained from RNA-Seq data (same data used in A) from AA patients versus EA patients with BLCA. Number of genes from pathways in x axis and significance in y axis are represented. Circle size correlates with number of genes (refer to Methods). (C) Volcano plot represents differentially expressed proteins between AA BLCA (n = 10) and EA BLCA (n = 12) from proteomics (2-way comparison; P < 0.05 denoted as blue dots; nonsignificant denoted as gray dots). Note: 4 matched patients with BLCA from RNA-Seq (A) and Proteomics (C). (D) Same as B, but BLCA proteomics data from AA patients versus EA patients with BLCA. Number of protein encoded genes from hallmark pathways in x axis and their significant P values (P < 0.05; refer to color scale) in y axis are represented. (E) Heatmap represents differentially expressed metabolites across BLCA tissues from AA (n = 10) and EA (n = 10) patients (FDR <0.25). Note: 4 matched patients with BLCA from Proteomics (C) and metabolomics (E). Upregulated metabolites are indicated in yellow, and downregulated are indicated in blue. (F) Graphical representation of enriched hallmark pathways obtained from metabolomics data (E) from AA BLCA versus EA patients with BLCA. Differential metabolites were mapped to genes and used for pathway analysis. Number of genes from pathways in x axis and their significant P values (P < 0.05; refer to color scale; circle size correlate with genes) in y axis are represented. (G) ETC activity measured in EA (n = 6) and AA (n = 6) BLCA tissues using colorimetric assay. Significance was determined by unpaired 2-tailed Student’s t test; **P < 0.01. Image was created with BioRender.com.
Figure 2
Figure 2. Pharmacological perturbation of complex I inhibition in AA BLCA.
(A) Protein expression of OXPHOS cocktail — mitochondrial complex V (ATP5A), III (UQCRC2), II (SDHB), IV (MT-CO2), and I (NDUFB8) — in EA BLCA (UM-UC-3, T24) and AA BLCA (UM-UC-1, SCaBER) cell lines. (B) Mitochondrial complex activity in AA BLCA — UM-UC-1 (n = 3), SCaBER (n = 3) — cell lines compared with EA BLCA — UM-UC-3 (n = 3), UM-UC-5 (n = 3) — cell lines; optical density (OD) of complex I activity was measured using specific substrates and normalized with the citrate synthase activity measured by colorimetric assay (****P < 0.0001). (C) Box-and-whisker plot represents ATP production in AA BLCA — UM-UC-1 (n = 7), SCaBER (n = 7) — and EA BLCA — UM-UC-3 (n = 7), T24 (n = 7) — cell lines measured by Seahorse assay. Data were normalized using cell number measured by CellTiter-Glo (****P < 0.0001). (D and E) Scatter plot represents the tumor growth (orthotopic) of AA BLCA (UM-UC-1) and EA BLCA (UM-UC-3) upon IACS-010759 (5 mg/kg) treatment compared with vehicle control. Luciferase measurements were performed over a period of 21 days — UM-UC-1: days 7 and 14 for Control (n = 7), IACS-010759 treatment (n = 8); day 21 for Control (n = 6), IACS-010759 treatment (n = 8); and UM-UC-3: day 7 for Control (n = 8), IACS-010759 treatment ( n = 8); day 14 for Control (n = 8), IACS-010759 treatment (n = 7); day 21 for Control (n = 7), IACS-010759 treatment (n = 7) (unpaired t test for each time point; ***P < 0.001). (F) Plot represents the tumor growth (s.c.) from AA BLCA (SCaBER) cell line–derived xenografts treated with IACS-010759 (5 mg/kg; n = 5) compared with vehicle control (n = 5) (unpaired t test for each time point; **P < 0.01; *P < 0.05). (G) Protein expression of NDUFB8 (mitochondrial complex I protein) in EA (n = 4; E1 to E4) and AA BLCA (n = 4; A1 to A4) tissues measured by Western blot analysis. Significance was determined by unpaired 2-tailed student t test.
Figure 3
Figure 3. Complex I–mediated (NDUFB8-mediated) OXPHOS activity, and tumor growth in AA BLCA.
(A and B) Immunoblot analysis showed the confirmation of NDUFB8 KD and reexpression using the full-length NDUFB8 in the KD (shNDUFB8-3′UTR) background cells (rescue) in SCaBER and UM-UC-1 compared with their corresponding nontargeting control. (C and D) KD of NDUFB8 (n = 6) in SCaBER and UM-UC-1 significantly reduces basal respiration compared with shControl (n = 6) (oxygen consumption rate [OCR]) and rescued upon NDUFB8 reexpression (n = 6) measured by Seahorse assay (A, oligomycin; B, FCCP; C, Rotenone/Antimycin A; data are normalized with cell number by counting). (E and F) Same as in C and D, but for ATP production in SCaBER and UM-UC-1 cell lines, respectively (****P < 0.0001, ** P < 0.01). (G) CellTiter-Glo proliferation assay significantly reduced in SCaBER NDUFB8 KD (n = 8) compared with shControl (n = 8) and rescued upon NDUFB8 reexpression (n = 8) (***P < 0.001; ****P < 0.0001). (H) CellTiter-Glo proliferation assay significantly reduced in UM-UC-1 NDUFB8 KD (n = 8) compared with shControl (n = 8) and rescued upon NDUFB8 reexpression (n = 8) (***P < 0.001; ****P < 0.0001). (I) Weight of the orthotopic mice bladder harboring tumors (endpoint: day 35) from SCaBER shCtrl (n = 9) and SCaBER shNDUFB8-3′UTR (n = 9) (**P < 0.01). Significance was determined by unpaired 2-tailed Student’s t test.
Figure 4
Figure 4. Genetic perturbations of NDUFB8 affects GLS1 and glutamine-mediated mitochondrial metabolism in AA BLCA.
(A) Heatmap represent the levels of TCA intermediates in shCtrl (n = 4), NDUFB8 KD (n = 4), and NDUFB8 rescue (n = 4) AA (SCaBER) BLCA cell lines measured by LC-MS (FDR < 0.25). (B) Western blot analysis represents the expression of GLS1 in AA BLCA (SCaBER and UM-UC-1) and EA BLCA (UM-UC-3) cell lines with NDUFB8 KD and rescue. (C) Western blot analysis represents the expression of GLS1 in AA BLCA (SCaBER and UM-UC-1) and EA BLCA (UM-UC-3) cell lines treated with mitochondrial complex specific inhibitors — IACS-010759-10 μM, 3-Nitropropionic acid (3-NPA)-10 μM, oligomycin-10 μM, atovaquone-10 μM. (D) Relative levels of glutamine (normalized with internal standard) measured by LC-MS in AA BLCA orthotopic tumors (UM-UC-1) and EA BLCA orthotopic tumors (UM-UC-3) treated with IACS-010759 (5 mg/kg; n = 4) compared with vehicle (n = 4). Significance was determined using unpaired 2-tailed Student’s t test; **P < 0.01. (E) Heatmap representing [U]13C glutamine incorporation (6 hours) into TCA cycle of EA BLCA — #1=UM-UC-3 (n = 3), #2=J82 (n = 4) — and AA BLCA — #3=UM-UC-1 (n = 3), #4=SCaBER (n = 4) — cell lines. Peak areas are converted to log2 and followed by z score transformation. Significance was determined based on log-transformed data using Student’s t test between AA BLCA cell lines and EA BLCA cell lines. Yellow represents increased, and blue represent decreased levels from Z score values. (F) Weight of the orthotopic mice bladder harboring tumors (endpoint: day 37) from SCaBER shCtrl (n = 7) and GLS1 KD (n = 10) tumors. Significance was determined by unpaired 2-tailed Student’s t test; ****P < 0.0001. (G) Weight of the orthotopic mice bladder harboring tumors derived from SCaBER (endpoint: day 31) treated with vehicle (n = 8) and CB-839 (n = 9). Significance was determined by unpaired 2-tailed Student’s t test; **P < 0.01.

References

    1. Jemal A, et al. Cancer statistics, 2007. CA Cancer J Clin. 2007;57(1):43–66. doi: 10.3322/canjclin.57.1.43. - DOI - PubMed
    1. Botteman MF, et al. The health economics of bladder cancer: a comprehensive review of the published literature. Pharmacoeconomics. 2003;21(18):1315–1330. doi: 10.1007/BF03262330. - DOI - PubMed
    1. Burger M, et al. Epidemiology and risk factors of urothelial bladder cancer. Eur Urol. 2013;63(2):234–241. doi: 10.1016/j.eururo.2012.07.033. - DOI - PubMed
    1. Siegel RL, et al. Cancer statistics, 2024. CA Cancer J Clin. 2024;74(1):12–49. doi: 10.3322/caac.21820. - DOI - PubMed
    1. Bach PB, et al. Survival of blacks and whites after a cancer diagnosis. JAMA. 2002;287(16):2106–2113. doi: 10.1001/jama.287.16.2106. - DOI - PubMed

MeSH terms