

GFAP and NfL as fluid biomarkers for clinical disease severity and disease progression in multiple system atrophy (MSA)
- PMID: 39254698
- PMCID: PMC11447157
- DOI: 10.1007/s00415-024-12647-z
GFAP and NfL as fluid biomarkers for clinical disease severity and disease progression in multiple system atrophy (MSA)
Abstract
Background: Multiple system atrophy (MSA), an atypical parkinsonian syndrome, is a rapidly progressive neurodegenerative disease with currently no established fluid biomarkers available. MSA is characterized by an oligodendroglial α-synucleinopathy, progressive neuronal cell loss and concomitant astrocytosis. Here, we investigate glial fibrillary acidic protein (GFAP) and neurofilament light chain (NfL) as fluid biomarkers for differential diagnosis, assessment of clinical disease severity and prediction of disease progression in MSA.
Methods: GFAP and NfL levels were analyzed in plasma and CSF samples of 47 MSA patients as well as 24 Parkinson's disease (PD) and 25 healthy controls (HC) as reference cohorts. In MSA, biomarker levels were correlated to baseline and longitudinal clinical disease severity (UMSARS scores).
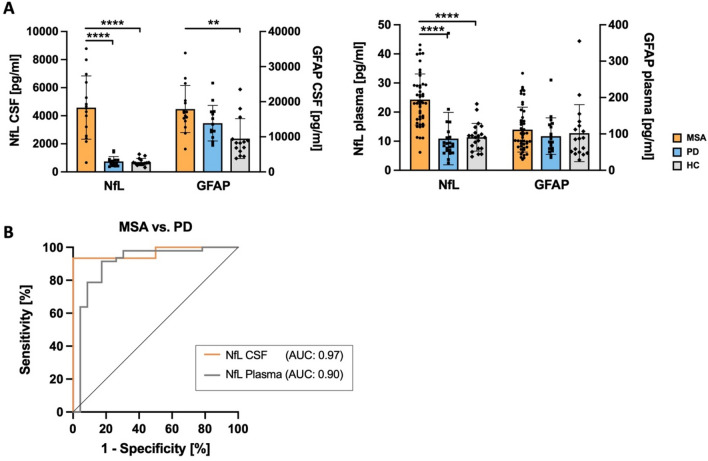
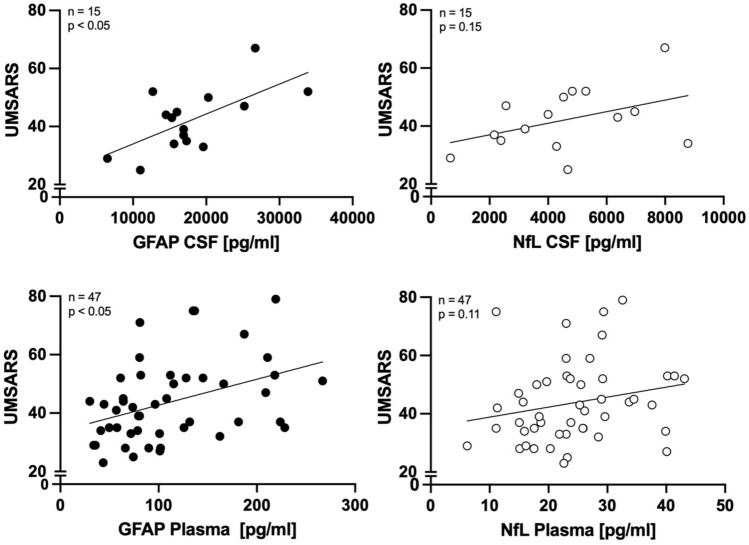
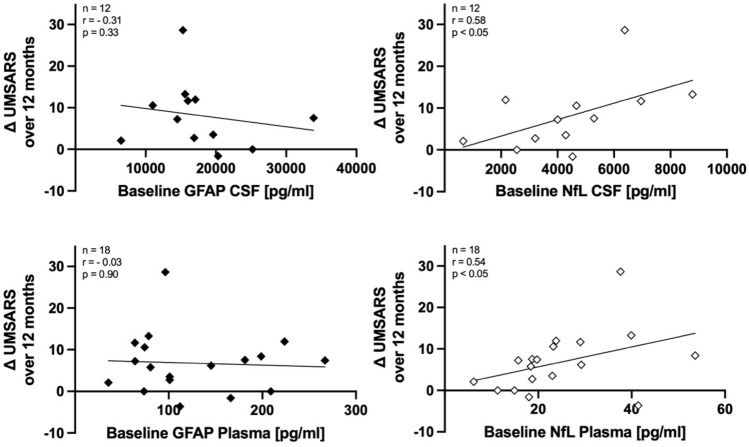
Results: In MSA, GFAP levels in CSF and plasma predicted baseline clinical disease severity as indicated by UMSARS scores, while NfL levels predicted clinical disease progression as indicated by longitudinal changes in UMSARS scores. Cross-sectionally, NfL levels in CSF and plasma were significantly elevated in MSA compared to both PD and HC. Receiver operating curves (ROC) indicated high diagnostic accuracy of NfL for distinguishing MSA from PD (CSF: AUC = 0.97, 95% CI 0.90-1.00; plasma: AUC = 0.90, 95% CI 0.81-1.00).
Discussion: In MSA, GFAP shows promise as novel biomarker for assessing current clinical disease severity, while NfL might serve as biomarker for prediction of disease progression and differential diagnosis of MSA against PD.
Keywords: Fluid biomarkers; Glial fibrillary acidic protein; Multiple system atrophy; Neurofilament light chain; Neuroinflammation.
© 2024. The Author(s).
Conflict of interest statement
The research in this study was funded by the Lüneburg heritage, the Ehrmann foundation and the Deutsche Forschungsgemeinschaft (DFG) under Germany’s Excellence Strategy within the framework of the Munich Cluster for Systems Neurology (EXC 2145 SyNergy—ID 390857198). The authors declare that there are no conflicts of interest relevant to this work.
Figures
References
-
- Dickson DW, Braak H, Duda JE, Duyckaerts C, Gasser T, Halliday GM, Hardy J, Leverenz JB, Tredici KD, Wszolek ZK, Litvan I (2009) Neuropathological assessment of Parkinson’s disease: refining the diagnostic criteria. Lancet Neurol 8(12):1150–1157 - PubMed
-
- Trojanowski JQ, Revesz T (2007) Proposed neuropathological criteria for the post mortem diagnosis of multiple system atrophy. Neuropath Appl Neuro 33(6):615–620 - PubMed
-
- Fanciulli A, Stankovic I, Krismer F, Seppi K, Levin J, Wenning GK (2019) Multiple system atrophy. Int Rev Neurobiol 149:137–192 - PubMed
MeSH terms
Substances
Grants and funding
LinkOut - more resources
Full Text Sources
Miscellaneous
