Multicenter Study
. 2024 Sep 10;81(1):393.
doi: 10.1007/s00018-024-05426-6.

Proteomics profiling and machine learning in nusinersen-treated patients with spinal muscular atrophy

Affiliations
Multicenter Study

Proteomics profiling and machine learning in nusinersen-treated patients with spinal muscular atrophy

Chiara Panicucci et al. Cell Mol Life Sci. .

Abstract

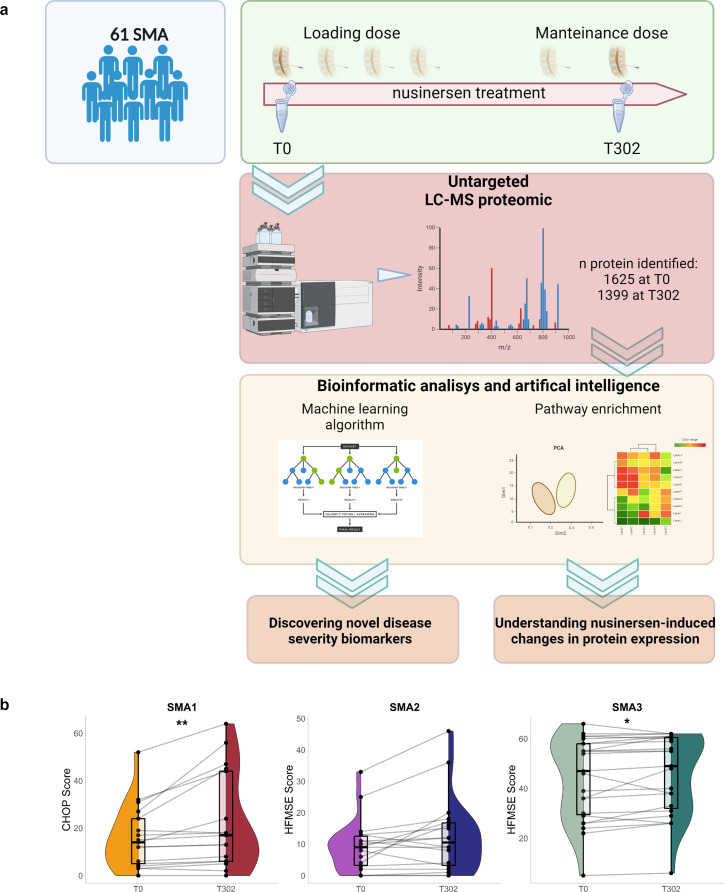
Aim: The availability of disease-modifying therapies and newborn screening programs for spinal muscular atrophy (SMA) has generated an urgent need for reliable prognostic biomarkers to classify patients according to disease severity. We aim to identify cerebrospinal fluid (CSF) prognostic protein biomarkers in CSF samples of SMA patients collected at baseline (T0), and to describe proteomic profile changes and biological pathways influenced by nusinersen before the sixth nusinersen infusion (T302).

Methods: In this multicenter retrospective longitudinal study, we employed an untargeted liquid chromatography mass spectrometry (LC-MS)-based proteomic approach on CSF samples collected from 61 SMA patients treated with nusinersen (SMA1 n=19, SMA2 n=19, SMA3 n=23) at T0 at T302. The Random Forest (RF) machine learning algorithm and pathway enrichment analysis were applied for analysis.

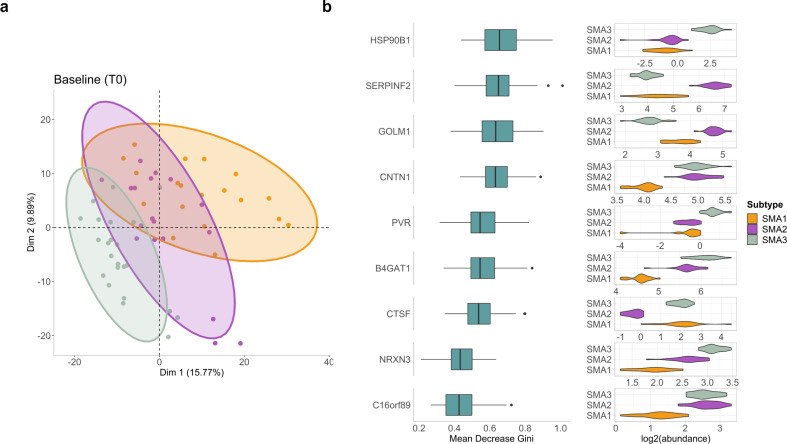
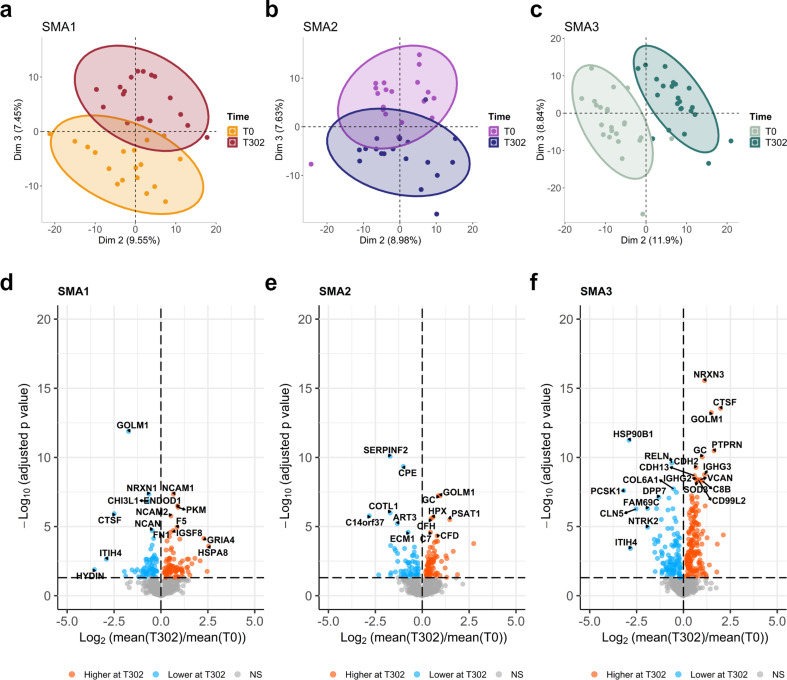
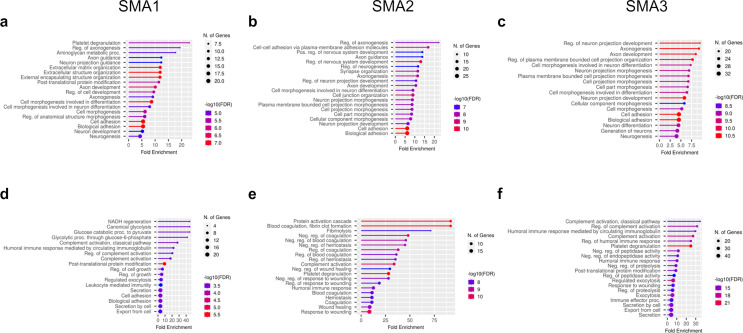
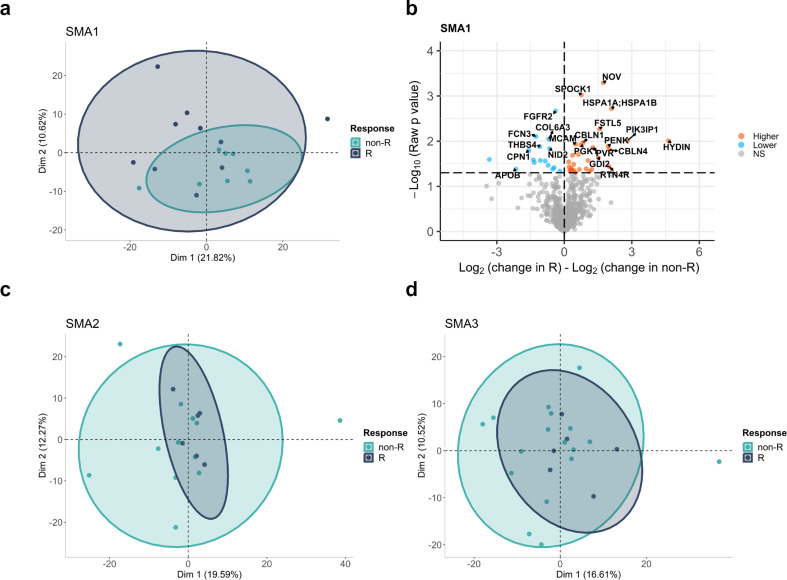
Results: The RF algorithm, applied to the protein expression profile of naïve patients, revealed several proteins that could classify the different types of SMA according to their differential abundance at T0. Analysis of changes in proteomic profiles identified a total of 147 differentially expressed proteins after nusinersen treatment in SMA1, 135 in SMA2, and 289 in SMA3. Overall, nusinersen-induced changes on proteomic profile were consistent with i) common effects observed in allSMA types (i.e. regulation of axonogenesis), and ii) disease severity-specific changes, namely regulation of glucose metabolism in SMA1, of coagulation processes in SMA2, and of complement cascade in SMA3.

Conclusions: This untargeted LC-MS proteomic profiling in the CSF of SMA patients revealed differences in protein expression in naïve patients and showed nusinersen-related modulation in several biological processes after 10 months of treatment. Further confirmatory studies are needed to validate these results in larger number of patients and over abroader timeframe.

Keywords: Artificial intelligence; Biomarkers; Cerebrospinal fluid; Machine learning; Proteomics; Spinal muscular atrophy.


Conflict of interest statement

The authors have no relevant financial or non-financial interests to disclose.

Figures

Fig. 1
Fig. 1
Study design and population. (a) A graphical description of the study is shown. (b) Changes in CHOP scores for SMA1 (n = 17), and HFMSE scores in SMA2 (n = 18) or SMA3 (n = 23) patients before (T0) and after (T302) nusinersen treatment. Plots show points for each sample score and paired sample data were connected by lines. Violin plot shows the distribution of the scores via density, and box plots showing interquartile range; box has sides belonging to lower and upper quartiles, and median depicted by horizontal line. Significance was tested via paired Wilcoxon rank-sum test. Significance test results were shown by “*“ for p-value < 0.05; “**“ for p-value < .01
Fig. 2
Fig. 2
Random Forest identified new putative biomarkers for SMA severity. (a) PCA plot showing the separate clustering patterns of SMA1 (orange), SMA2 (purple) and SMA3 (green) proteomic profiles at T0 based on dimensions 1 and 2. On PCA plots, each sample was shown by points, and ellipses correspond to 95% confidence intervals for each of the subtypes. (b) Nine proteins common among top 30 features obtained from 100 different Random Forest models for classification of SMA types at T0. On the left side of figure, the importance score (based on mean decrease in Gini index) distributions of each protein from 100 models were illustrated by box plots. Log2 abundance of each protein in each SMA type at T0 were shown by violin plots on the right side. Box plots showing interquartile range, and outliers were shown by black dots
Fig. 3
Fig. 3
Nusinersen modulates CSF proteome at T302. The change in clustering based on proteomics between T0 and T302 is shown for (a) SMA1, (b) SMA2, and (c) SMA3 patients, based on second- and third-dimension combinations. PCA plots showing distribution and clustering of samples, and ellipses correspond to 95% confidence intervals for each time point. Volcano plots are used to show the down- or up-regulated proteins after nusinersen treatment for (d) SMA1, (e) SMA2, and (f) SMA3 samples. Significantly changed proteins (p.adj < 0.05) were colored on volcano plots based on their higher (orange) or lower (blue) abundances at T302 compared to T0
Fig. 4
Fig. 4
Biological processes modulated by nusinersen at T302. Top 20 GO pathways for biological processes (BP) enriched by mainly down-regulated (a-c) and up regulated DEPs (d-f), obtained from two clusters from each heatmap, are shown by lollipop plots for each SMA type. Fold enrichment represents the ratio of the percentage of matched proteins in the query list with pathway-associated proteins to the percentage of query with the background. Bar colors are corresponding to the false discovery rate (FDR) corrected p values for each enriched pathway, and the size of dots are proportional to the number of proteins associated with the respective pathway
Fig. 5
Fig. 5
Responders vs. non-Responders analysis. The clustering patterns of the responders (green) and non-responders (dark grey) based on changes in protein levels after nusinersen treatment were shown by PCA plots based on first two dimensions for (a) SMA1, (c) SMA2, and (d) SMA3. Each dot represents one sample, and ellipses correspond to 95% confidence intervals for each of the subtypes. (b) Volcano plot for comparison of time-wise changes in protein levels in each responder and non-responder samples. Fold change differences were calculated by subtracting log2 fold change of proteins between T302 and T0 in non-responders from log2 fold change between T302 and T0 in responders, and higher and lower changes in responders compared to non-responders were shown by orange and blue colors, respectively

References

    1. Mercuri E, Sumner CJ, Muntoni F, Darras BT, Finkel RS (2022) Spinal muscular atrophy. Nat Rev Dis Primers 8:52. 10.1038/s41572-022-00380-8 10.1038/s41572-022-00380-8 - DOI - PubMed
    1. Feldkötter M, Schwarzer V, Wirth R, Wienker TF, Wirth B (2002) Quantitative analyses of SMN1 and SMN2 based on real-time lightCycler PCR: fast and highly reliable carrier testing and prediction of severity of spinal muscular atrophy. Am J Hum Genet 70:358–368. 10.1086/338627 10.1086/338627 - DOI - PMC - PubMed
    1. Calucho M, Bernal S, Alías L, March F, Venceslá A, Rodríguez-Álvarez FJ, Aller E, Fernández RM, Borrego S, Millán JM, Hernández-Chico C, Cuscó I, Fuentes-Prior P, Tizzano EF (2018) Correlation between SMA type and SMN2 copy number revisited: an analysis of 625 unrelated Spanish patients and a compilation of 2834 reported cases. Neuromuscul Disord 28:208–215. 10.1016/j.nmd.2018.01.003 10.1016/j.nmd.2018.01.003 - DOI - PubMed
    1. Monani UR, Lorson CL, Parsons DW, Prior TW, Androphy EJ, Burghes AH, McPherson JD (1999) A single nucleotide difference that alters splicing patterns distinguishes the SMA gene SMN1 from the copy gene SMN2. Hum Mol Genet 8:1177–1183. 10.1093/hmg/8.7.1177 10.1093/hmg/8.7.1177 - DOI - PubMed
    1. Finkel RS, Chiriboga CA, Vajsar J, Day JW, Montes J, De Vivo DC, Yamashita M, Rigo F, Hung G, Schneider E, Norris DA, Xia S, Bennett CF, Bishop KM (2016) Treatment of infantile-onset spinal muscular atrophy with nusinersen: a phase 2, open-label, dose-escalation study. Lancet 388:3017–3026. 10.1016/S0140-6736(16)31408-8 10.1016/S0140-6736(16)31408-8 - DOI - PubMed

Publication types

LinkOut - more resources