. 2024 Sep 17;121(38):e2405474121.
doi: 10.1073/pnas.2405474121. Epub 2024 Sep 10.

Single-cell analysis identifies distinct macrophage phenotypes associated with prodisease and proresolving functions in the endometriotic niche

Affiliations

Single-cell analysis identifies distinct macrophage phenotypes associated with prodisease and proresolving functions in the endometriotic niche

Yasmin Henlon et al. Proc Natl Acad Sci U S A. .

Abstract

Endometriosis negatively impacts the health-related quality of life of 190 million women worldwide. Novel advances in nonhormonal treatments for this debilitating condition are desperately needed. Macrophages play a vital role in the pathophysiology of endometriosis and represent a promising therapeutic target. In the current study, we revealed the full transcriptomic complexity of endometriosis-associated macrophage subpopulations using single-cell analyses in a preclinical mouse model of experimental endometriosis. We have identified two key lesion-resident populations that resemble i) tumor-associated macrophages (characterized by expression of Folr2, Mrc1, Gas6, and Ccl8+) that promoted expression of Col1a1 and Tgfb1 in human endometrial stromal cells and increased angiogenic meshes in human umbilical vein endothelial cells, and ii) scar-associated macrophages (Mmp12, Cd9, Spp1, Trem2+) that exhibited a phenotype associated with fibrosis and matrix remodeling. We also described a population of proresolving large peritoneal macrophages that align with a lipid-associated macrophage phenotype (Apoe, Saa3, Pid1) concomitant with altered lipid metabolism and cholesterol efflux. Gain of function experiments using an Apoe mimetic resulted in decreased lesion size and fibrosis, and modification of peritoneal macrophage populations in the preclinical model. Using cross-species analysis of mouse and human single-cell datasets, we determined the concordance of peritoneal and lesion-resident macrophage subpopulations, identifying key similarities and differences in transcriptomic phenotypes. Ultimately, we envisage that these findings will inform the design and use of specific macrophage-targeted therapies and open broad avenues for the treatment of endometriosis.

Keywords: endometriosis; heterogeneity; lesion; macrophage; phenotype.


Conflict of interest statement

Competing interests statement:The authors declare no competing interest.

Figures
Fig. 1.
Fig. 1.
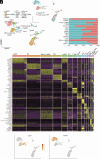
Endometriosis-associated macrophages exhibit significant transcriptomic heterogeneity. (A) Schematic of workflow and tissues, fluid evaluated. (B) UMAP projection of CD45+ cells isolated from menses-like endometrium (donor mice; n = 5), peritoneal lavage (PF) from sham mice (n = 5), PF (n = 5), and lesions (n = 10 mice) isolated from mice with endometriosis. The Inset is UMAP projection based on library ID. AP; antigen-presenting cells, EM; endometrial macrophages; LpM; large peritoneal macrophages, LRM; lesion resident macrophages, SpM; small peritoneal macrophages, LMonos; lesion resident monocytes, NK; natural killer cells. (C) Bar chart depicting cluster membership of each sample type. (D) Heatmap of top five differentially expressed genes (DEGs) for each cluster. (E) Feature plot of marker genes exhibiting restricted expression in SAM-like and TAM-like lesion-resident macrophages.
Fig. 2.
Fig. 2.
SAM-like and TAM-like cells appear to arise from monocyte precursors and not infiltrating peritoneal macrophages. (A) Schematic representation of fate-map experiments that enable FACs isolation of macrophages from different locations. To isolate endometrial-derived macrophages from lesions (n = 6 mice), menses-like endometrium from MacGreen donor mice was transferred into the peritoneal cavity of wild-type recipients and lesions allowed to develop for 14 d. Lesions were recovered and GFP+ endometrial-derived macrophages were isolated. The GFP− macrophage fraction was constituted from monocytes that extravasate from lesion blood vessels and differentiate into macrophages and infiltrating peritoneal macrophages (n = 6). To isolate peritoneal macrophages from lesions we performed adoptive transfer of LpM (F4/80+) isolated from the peritoneal lavage of MacGreen mice and injected into the peritoneal cavity of wild-type recipient mice at the same time as endometrium from wild-type mice. Lesions formed over 14 d, followed by FACs isolation of GFP+ (peritoneal) lesion-resident macrophages (n = 6). The GFP− fraction was also collected and was constituted by endometrial-derived macrophages and extravasated monocyte-derived macrophages (n = 6, collectively n = 12 for the GFP− fraction). (B) Relative mRNA concentrations of TAM-like (Folr2, Gas6, and Mrc1) and SAM-like (Spp1 and Mmp12) macrophage markers assessed by QPCR. Data presented are mean ± SEM. (C) Immunolocalization of Gas6 and Spp1 (green) and colocalization with F4/80 (red) in mouse lesions (G; gland, S; stroma, P; peritoneum). (D and E) Immunolocalization of Gas6 and Spp1 (green) and colocalization with CD68 (red; arrow heads denote cells exhibiting colocalization) in lesions recovered from women with endometriosis (D: peritoneal lesions, E: endometrioma). (Scale bar, 100 μM.) (F) Quantification of colocalization in human peritoneal lesions (n = 5) as well as mouse lesions (n = 6). Data presented are mean ± SEM. Statistical analysis was performed using a Kruskal–Wallis and a Dunn’s multiple comparison test. *P < 0.05, **P < 0.01.
Fig. 3.
Fig. 3.
A unique population of monocyte-derived LpM is evident in mice with experimental endometriosis. (A) UMAP projection of CD45+ cells isolated from the peritoneal lavage from naïve mice (Naïve PF; n = 5) and mice with endometriosis (ovaries intact; Endo-Intact PF; n = 5). The Inset shows UMAP based on library ID. (B) Bar chart showing cluster membership of different samples. (C) Heatmap showing top five DEGs per cluster. (D) Feature plots of Ccr2 and Timd4 expression.
Fig. 4.
Fig. 4.
Apoe regulates peritoneal macrophage populations and limits growth of lesions in experimental endometriosis. (A) Feature plots of monocyte-derived LpM subpopulation marker genes, Pid1, Saa3, Apoe, and Lrp1. (B) QPCR for marker genes on FACs-sorted Tim4− (monocyte-derived) LpM isolated from naïve mice (n = 4) and mice with experimental endometriosis (n = 6). Data presented are mean ± SEM. (C) Quantification of Apoe+, Tim4− LpM in mice with endometriosis (Endo; n = 9) and those without (Naïve; n = 3) analyzed via flow cytometry. (D) Mean fluorescence intensity of Apoe on different macrophage populations in mice with (Endo) and without (naïve) endometriosis. Data presented are mean ± SD. Mice with induced endometriosis were injected i.p. with and the Apoe mimetic peptide COG 133 (Generon A1131; 300 μM in 200 μL dH2O, n = 6) or vehicle (n = 6) daily for 14 d from day of endometriosis induction. Bioluminescent imaging of lesions was performed twice weekly, and the images shown are from day 13 of the experiment (E). (F) Quantification of bioluminescent signal on day 13 and quantification of lesion area following histological processing, image capture, and measurement using Fiji. (G) Representative flow plots of peritoneal lavage showing LpMs (F4/80hi, MHCIIlo) and SpM (F4/80lo, MHCIIhi; Left side) and Tim4+ LpMs (Right side) in naïve and endometriosis mice injected with vehicle or Apoe mimetic. (H) Quantification of peritoneal macrophages and monocytes (flow data). Data presented are mean ± SEM. (I) Masson Trichrome stain was performed on lesions collected from endometriosis injected with either vehicle or Apoe mimetic and areas of collagen deposition (blue stain) quantified. Data (n = 6) are presented as a box plot with the min and max. (J) Representative Masson Trichrome images of lesions. G; glands, S; stroma, asterisks; areas of ECM accumulation. Statistical significance was ascertained using a Student’s t test or Kruskal–Wallis with Dunn’s multiple comparison test. *P < 0.05, **P < 0.01.
Fig. 5.
Fig. 5.
Cross-species mapping of mouse and human peritoneal macrophages. (A) UMAP projection of CD45+ cell derived from mouse peritoneal fluid (Ovx-Endo; Seurat v.5), (B) UMAP projection of CD45+ cells derived from human peritoneal fluid (patient with endo only; Zou et al. publicly available dataset). (C) Bar chart showing the proportions of each cell type present in the two datasets. The “other” population includes other cells excluding macrophages, DC, T, and NK (e.g., B cells, mast cells). (D) The macrophage subset was extracted from each dataset (lilac and pink for mouse and human, respectively) and evaluated for shared up- and down-regulated genes; see Venn diagrams. (E) Cross-species integration of single-cell RNA-sequencing data was performed to map mouse and human macrophage subpopulations. (F) Bar chart showing cluster member proportions for each species.
Fig. 6.
Fig. 6.
Cross-species mapping of mouse and human lesion-resident macrophages. (A) UMAP projection of CD45+ cells derived from lesions recovered from a mouse model of experimental endometriosis (Ovx-Endo; Seurat v.5), (B) UMAP projection of CD45+ cells derived from human endometriosis lesions (peritoneal only; Tan et al., publicly available dataset). (C) Bar chart showing the proportions of each cell type present in the two datasets. The other population includes other cells excluding macrophages, DC, T, and NK (e.g., eosinophils, basophils, B cells). (D) The macrophage subset was extracted from each dataset (lilac and pink for mouse and human, respectively) and evaluated for shared up- and down-regulated genes; see Venn diagrams. (E) Cross-species integration of single-cell RNA-sequencing data was performed to map mouse and human macrophage subpopulations. (F) Bar chart showing cluster member proportions for each species.

References

    1. Blériot C., Chakarov S., Ginhoux F., Determinants of resident tissue macrophage identity and function. Immunity 52, 957–970 (2020). - PubMed
    1. Ginhoux F., Jung S., Monocytes and macrophages: Developmental pathways and tissue homeostasis. Nat. Rev. Immunol. 14, 392–404 (2014). - PubMed
    1. Ginhoux F., Schultze J. L., Murray P. J., Ochando J., Biswas S. K., New insights into the multidimensional concept of macrophage ontogeny, activation and function. Nat. Immunol. 17, 34–40 (2016). - PubMed
    1. Schulz C., et al. , A lineage of myeloid cells independent of Myb and hematopoietic stem cells. Science 336, 86–90 (2012). - PubMed
    1. Bain C. C., et al. , Long-lived self-renewing bone marrow-derived macrophages displace embryo-derived cells to inhabit adult serous cavities. Nat. Commun. 7, ncomms11852 (2016). - PMC - PubMed