. 2024 Sep 10;134(21):e180986.
doi: 10.1172/JCI180986.

Antibiotic use during influenza infection augments lung eosinophils that impair immunity against secondary bacterial pneumonia

Affiliations

Antibiotic use during influenza infection augments lung eosinophils that impair immunity against secondary bacterial pneumonia

Marilia Sanches Santos Rizzo Zuttion et al. J Clin Invest. .

Abstract

A leading cause of mortality after influenza infection is the development of a secondary bacterial pneumonia. In the absence of a bacterial superinfection, prescribing antibacterial therapies is not indicated but has become a common clinical practice for those presenting with a respiratory viral illness. In a murine model, we found that antibiotic use during influenza infection impaired the lung innate immunologic defenses toward a secondary challenge with methicillin-resistant Staphylococcus aureus (MRSA). Antibiotics augment lung eosinophils, which have inhibitory effects on macrophage function through the release of major basic protein. Moreover, we demonstrated that antibiotic treatment during influenza infection caused a fungal dysbiosis that drove lung eosinophilia and impaired MRSA clearance. Finally, we evaluated 3 cohorts of hospitalized patients and found that eosinophils positively correlated with antibiotic use, systemic inflammation, and worsened outcomes. Altogether, our work demonstrates a detrimental effect of antibiotic treatment during influenza infection that has harmful immunologic consequences via recruitment of eosinophils to the lungs, thereby increasing the risk of developing a secondary bacterial infection.

Keywords: Bacterial infections; Infectious disease; Influenza; Innate immunity; Pulmonology.


Figures

Figure 1
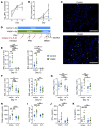
Figure 1. Antibiotic treatment of mice during influenza infection impairs bacterial clearance and augments lung inflammation after a subsequent challenge with MRSA.
(A) Mice were infected with influenza (PR8, 500 PFU) at day 0 followed by MRSA at day 10. Control or antibiotics (VNAM) were started 7 days before PR8 infection to allow mice to equilibrate to the treatment and discontinued at day 7 to allow it to wash out before MRSA challenge. (B) Weight relative to that at day 10 showed a slower recovery after MRSA challenge in the VNAM-treated group (n = 18) compared with control (n = 31) at days 11 and 12 (1 and 2 days after MRSA infection, respectively). (C) Representative images from 3 different H&E-stained lungs at day 11 of the 2-hit model. Scale bars: 2 mm (left), 500 μm (right). (DI) Mice were sacrificed on day 12 after the 2-hit infection; the lungs were evaluated for CFU of bacteria (n = 26 and 21 for control and VNAM groups, respectively) (D), and BAL was evaluated for IFN-γ levels (n = 13 and 12 for control and VNAM groups, respectively) (E), total cell count (n = 26 and 21 for control and VNAM groups, respectively) (F), PMN count (n = 13 and 12 for control and VNAM groups, respectively) (G), macrophages (n = 9 and 8 for control and VNAM groups, respectively) (H), and eosinophils (n = 12 and 13 for control and VNAM groups, respectively) (I). *P < 0.05, **P < 0.01, ***P < 0.005, ****P < 0.0001 by 2-tailed Student’s t test.
Figure 2
Figure 2. Depletion of eosinophils improves bacterial clearance and lung inflammation in the antibiotic-treated group injured with influenza followed by MRSA.
(A and B) BAL eosinophil numbers (A) and percentages (B) in control and VNAM-treated mice infected with influenza (PR8, 250 PFU) (n = 3–4). (C) EoCre × ROSAmTmG transgenic mice were treated with control or VNAM and then injured with influenza (PR8, 250 PFU). Mice were sacrificed on day 10 after influenza infection, and lung slices were immunostained for GFP (eosinophils; green) and DAPI (blue). Image is representative of 3 different samples. Scale bars: 100 μm. (D) Mice were infected with influenza (PR8, 250 PFU) at day 0 followed by MRSA at day 10. Control or antibiotics (VNAM) were started 7 days before PR8 infection to allow mice to equilibrate to the treatment and discontinued at day 7 to allow it to wash out before MRSA challenge. Mice were given intraperitoneal injections of either an isotype antibody (n = 7–10) or an anti–IL-5 antibody (n = 7–10) every 3–4 days. (E) BAL eosinophils were effectively depleted after IL-5 antibody treatment. (F and G) Total cell count (F) and PMNs (G) in the BAL were evaluated 1 and 2 days after MRSA infection (days 11 and 12, respectively). (HK) Mice were sacrificed on day 12 and evaluated for total protein in the BAL (H), CFU of bacteria in the lungs (I), BAL IFN-γ levels (J), and BAL IL-1β levels (K). *P < 0.05, **P < 0.01, ***P < 0.001 by 2-way ANOVA.
Figure 3
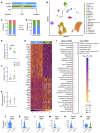
Figure 3. Antibiotic treatment of mice during influenza infection attenuates interstitial macrophage numbers and causes transcriptomic changes in alveolar macrophages consistent with an immunosuppressive phenotype.
(A) Mice were infected with influenza (PR8, 250 PFU) at day 0. Control or antibiotics (VNAM) were started 7 days before PR8 infection to allow mice to equilibrate to the treatment and discontinued at day 7. (BO) Lungs from mice sacrificed at day 10 were processed for scRNA-Seq (B, C, and HO) and flow cytometry (DG). (B) UMAP visualization of the major cell populations identified in the transcriptomic data set. (C and D) Relative numbers of alveolar macrophages (AM), interstitial macrophages (IM), and monocyte-derived macrophages (MoM) between control and VNAM groups in the scRNA-Seq data (C) and by flow cytometry analysis (D). (EG) Flow cytometry analysis (n = 5) for total number of interstitial macrophages (*P < 0.05 by 2-tailed Student’s t test) (E), alveolar macrophages (F), and monocyte-derived macrophages (G). (H) Heatmap of the top 20 (by lowest FDR) differentially expressed genes (DEGs) in alveolar macrophages between control and VNAM-treated mice. The entire DEG list is provided in Supplemental Table 1. (I) DEGs in tissue-resident alveolar macrophages between control and VNAM groups were evaluated with Ingenuity Pathway Analysis (IPA). Disease and Function analysis was performed, and only nonredundant, downstream functional pathways (|z score| > 2) were visualized. The complete Disease and Function analysis is provided in Supplemental Table 2. (JO) Tissue-resident alveolar macrophage expression of the phagocytosis receptors in control (n = 319) and VNAM (n = 316) conditions: Cd14 (J), Marco (K), Clec4d (L), Fcgr1 (M), Fcgr2b (N), and Fcgr3 (O). The complete list of DEGs between control and VNAM in alveolar macrophages is given in Supplemental Table 1. Adjusted P value: *P < 0.05, **P < 0.01, ***P < 0.001, ****P < 0.0001. mϕ, macrophage.
Figure 4
Figure 4. Eosinophils suppress macrophage phagocytosis through secretion of MBP-1.
(A and B) Macrophages (RAW 264.7 cells) were processed for RNA-Seq. DEGs (see Supplemental Table 3 for entire DEG list) were analyzed with IPA. (A) Macrophages were cultured in conditioned medium from either eosinophils or epithelial cells as a control. Disease and Function Analysis was performed, and nonredundant pathways (|z score| > 2) were visualized. See Supplemental Table 4 for the complete list of pathways. (B) Macrophages were cultured in eosinophil conditioned medium with addition of an isotype or anti–MBP-1 antibody. Disease and Function Analysis was performed, and nonredundant pathways (|z score| > 2) were visualized. See Supplemental Table 4 for the complete list. (C) MRSA was cultured alone, with macrophages, or with macrophages and primary eosinophils for 4 hours and MRSA CFU was calculated. (D) Quantification of MRSA CFU (n = 6). **P < 0.01 by repeated-measures 1-way ANOVA and post hoc analysis. (E) CFU of MRSA cultured for 4 hours alone, with macrophages, or with macrophages and conditioned medium from primary eosinophils (n = 11). **P < 0.01 by repeated-measures 1-way ANOVA and post hoc analysis. (F) CFU of MRSA cultured for 2 hours with macrophages plus addition of control (BSA) or recombinant MBP-1 (n = 4). *P < 0.05 by 2-tailed Student’s t test. (G) Fluorescence intensity over time reflects phagocytosis of pHrodo-labeled S. aureus bioparticles (n = 4). *P < 0.05, **P < 0.01 by repeated-measures 2-way ANOVA. (H and I) Effect of MBP-1 on phagocytosis of S. aureus bioparticles by murine alveolar macrophages in vivo (control, n = 13; MBP-1, n = 15) (H) and in an ex vivo PCLS culture (control, n = 5; MBP-1, n = 4) (I). *P < 0.05 by 2-tailed Student’s t test.
Figure 5
Figure 5. Antibiotics cause fungal dysbiosis during the influenza-MRSA 2-hit challenge.
(A) Stool was collected at days 0 and 7 from VNAM (n = 5 and 4, respectively) and control (n = 4) groups for ITS PCR. *P < 0.001 by 2-tailed Student’s t test. (BI) ITS sequencing of the stool collected at the designated time points from control and VNAM-treated mice infected with influenza (day 0) followed by MRSA (day 10). (B) Chao index showed no difference in α-diversity (n = 3–4). (C) Principal coordinates analysis demonstrated changes in β-diversity at day 12 (n = 3–4). (D and E) Relative abundance for individual samples at day 10 of the 2-hit model in control (n = 4) and VNAM (n = 5) groups at the family (D) and genus (E) levels. The top 10 families or genera are shown, and all others are cumulatively reported in the “Other” group. (FI) The relative abundance at the genus level was significantly higher in the VNAM (n = 5) compared with the control (n = 4) group for Saccharomyces (F), Malassezia (G), Filobasidium (H), and Bullera (I). *P < 0.05 by 2-tailed Student’s t test.
Figure 6
Figure 6. Cotreatment with fluconazole improves bacterial clearance and reverses the worsened lung injury in antibiotic-treated mice.
(A) Mice were infected with influenza (PR8, 250 PFU) at day 0 followed by MRSA at day 10. Control, antibiotics alone (VNAM), or VNAM and cotreatment with fluconazole (VNAM+Fluco) were started 7 days before PR8 infection to allow mice to equilibrate to the treatment and discontinued at day 7 to allow it to wash out before MRSA challenge. (B) Weight relative to that on day 10 showed slower recovery after MRSA challenge in the VNAM-treated group (n = 22) compared with control (n = 21) and VNAM+Fluco (n = 13) groups at days 11 and 12 (1 and 2 days after MRSA infection, respectively) by 2-way ANOVA. ****P < 0.0001 in post hoc analysis at day 12. (CL) Mice in control (C), VNAM (V), and VNAM+Fluco (VF) groups were injured in the 2-hit model and sacrificed for evaluation of (C) day 11 BAL total cell count (C: n = 9; V: n = 10; VF: n = 10); (D) day 12 BAL cell count (C: n = 22; V: n = 15; VF: n = 10); (E) day 10 BAL eosinophil count (C: n = 5; V: n = 4; VF: n = 3); (F) day 11 BAL eosinophil count (C: n = 26; V: n = 24; VF: n = 8); (G) day 12 BAL eosinophil count (C: n = 13; V: n = 12; VF: n = 9); (H) day 10 lung MBP-1 levels (C: n = 4; V: n = 4; VF: n = 5); (I) day 12 BAL IFN-γ levels (C: n = 4; V: n = 4; VF: n = 5); (J) day 12 BAL IL-1β levels (C: n = 4; V: n = 4; VF: n = 5); (K) day 11 lung MRSA CFU (C: n = 9; V: n = 10; VF: n = 9); and (L) day 12 lung MRSA CFU (C: n = 27; V: n = 21; VF: n = 8). (CL) One-way ANOVA with post hoc analysis was used to determine P values within the respective panels. ANOVA P values are listed in each panel. Post hoc comparisons are represented as follows: *P < 0.05, **P < 0.01, ***P < 0.001, ****P < 0.0001.
Figure 7
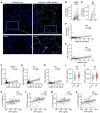
Figure 7. Eosinophils correlate with antibiotic use and worsen clinical outcomes in hospitalized patients.
(A) Lungs from an uninfected patient and one who died from influenza followed by MRSA infection were immunostained for MBP-1 to identify eosinophils (green fluorescence) and counterstained with DAPI (blue). See Supplemental Figure 12 for a representative image of the lungs from a patient who died from influenza with S. pneumoniae superinfection. Scale bars: 100 μm. (B) Initial and final eosinophil levels in peripheral blood of patients hospitalized for influenza infection on antibiotics for more than 4 days (n = 131). (C) Initial and final eosinophil levels in peripheral blood of ICU patients requiring mechanical ventilation and on antibiotics for more than 4 days (n = 121). (D and E) Mean eosinophils in peripheral blood (n = 175) (D) and BAL (E) correlated with days of antibiotic use in the ICU (n = 186). (F) Mean eosinophils in peripheral blood correlated with hospital length of stay for influenza patients (n = 229). (G and H) Mean eosinophils in peripheral blood (n = 175) (G) and BAL (n = 186) (H) correlated with length of stay in the ICU. (IN) Eosinophil peroxidase (EPX) was measured in plasma of ICU patients. (I and J) Violin plot of EPX levels in ICU patients with ARDS (n = 51) compared with those at risk (n = 67) (I) and with pneumonia (PNA; n = 96) compared with those without pneumonia (No PNA; n = 23) (J). (KN) EPX levels were correlated with plasma levels (n = 119) of IL-6 (K), CX3CL1 (L), ANG-2 (M), and soluble TNFR1 (N). Data presented from Cedars-Sinai Medical Center (CSMC) (B and F), Northwestern University (NU) (CE, G, and H), and University of Pittsburgh (Pitt) (IN). The data presented include all the patients within respective cohorts. Patient demographics for each cohort are described in Supplemental Table 7. **P < 0.01, ***P < 0.001, ****P < 0.0001 by 2-tailed Student’s t test (B, C, I, and J). Spearman’s correlation was used to determine association between various parameters (DH and KN).

References

    1. Iuliano AD, et al. Estimates of global seasonal influenza-associated respiratory mortality: a modelling study. Lancet. 2018;391(10127):1285–1300. doi: 10.1016/S0140-6736(17)33293-2. - DOI - PMC - PubMed
    1. Krammer F, et al. Influenza. Nat Rev Dis Primers. 2018;4(1):3. doi: 10.1038/s41572-018-0002-y. - DOI - PMC - PubMed
    1. Morens DM, Fauci AS. The 1918 influenza pandemic: insights for the 21st century. J Infect Dis. 2007;195(7):1018–1028. doi: 10.1086/511989. - DOI - PubMed
    1. Morens DM, et al. Predominant role of bacterial pneumonia as a cause of death in pandemic influenza: implications for pandemic influenza preparedness. J Infect Dis. 2008;198(7):962–970. doi: 10.1086/591708. - DOI - PMC - PubMed
    1. Gill JR, et al. Pulmonary pathologic findings of fatal 2009 pandemic influenza A/H1N1 viral infections. Arch Pathol Lab Med. 2010;134(2):235–243. doi: 10.5858/134.2.235. - DOI - PMC - PubMed

MeSH terms

Substances