. 2024 Sep 10;22(9):e3002790.
doi: 10.1371/journal.pbio.3002790. eCollection 2024 Sep.

Multisensory perceptual and causal inference is largely preserved in medicated post-acute individuals with schizophrenia

Affiliations

Multisensory perceptual and causal inference is largely preserved in medicated post-acute individuals with schizophrenia

Tim Rohe et al. PLoS Biol. .

Abstract

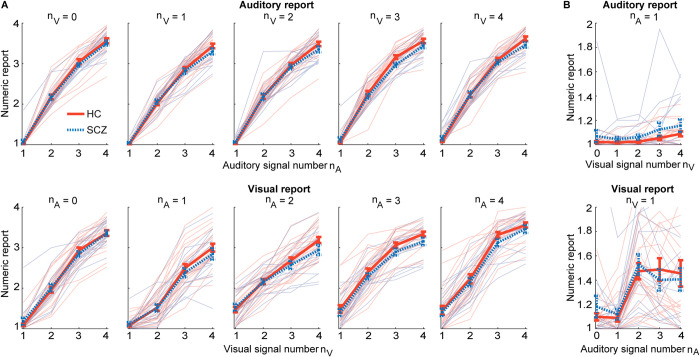
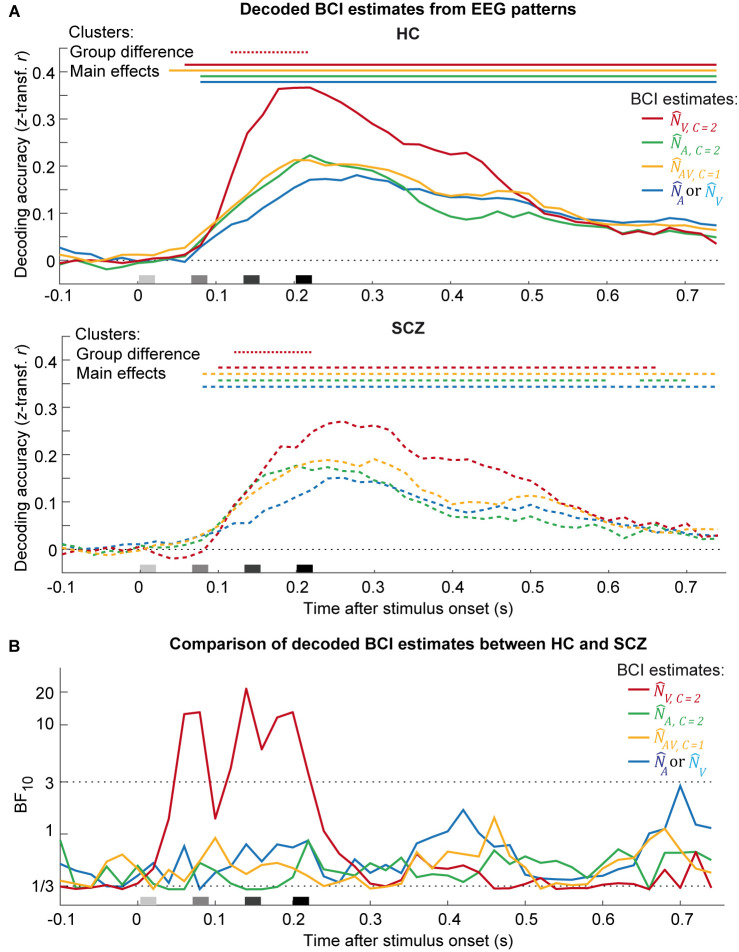
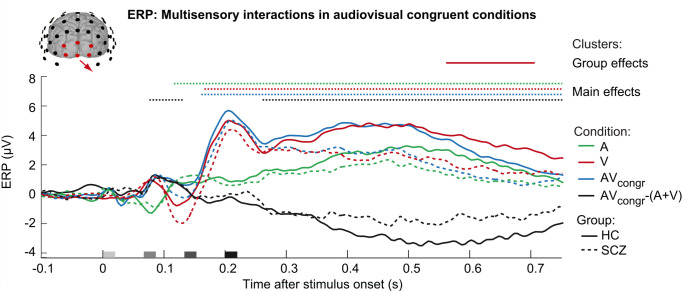
Hallucinations and perceptual abnormalities in psychosis are thought to arise from imbalanced integration of prior information and sensory inputs. We combined psychophysics, Bayesian modeling, and electroencephalography (EEG) to investigate potential changes in perceptual and causal inference in response to audiovisual flash-beep sequences in medicated individuals with schizophrenia who exhibited limited psychotic symptoms. Seventeen participants with schizophrenia and 23 healthy controls reported either the number of flashes or the number of beeps of audiovisual sequences that varied in their audiovisual numeric disparity across trials. Both groups balanced sensory integration and segregation in line with Bayesian causal inference rather than resorting to simpler heuristics. Both also showed comparable weighting of prior information regarding the signals' causal structure, although the schizophrenia group slightly overweighted prior information about the number of flashes or beeps. At the neural level, both groups computed Bayesian causal inference through dynamic encoding of independent estimates of the flash and beep counts, followed by estimates that flexibly combine audiovisual inputs. Our results demonstrate that the core neurocomputational mechanisms for audiovisual perceptual and causal inference in number estimation tasks are largely preserved in our limited sample of medicated post-acute individuals with schizophrenia. Future research should explore whether these findings generalize to unmedicated patients with acute psychotic symptoms.


Conflict of interest statement

UN is an Editorial Board Member of PLOS Biology.

Figures

Fig 1
Fig 1. Example trial, experimental design, and behavioral data.
(A) Example trial of the flash-beep paradigm (e.g., 2 flashes and 4 beeps are shown) in which participants either report the number of flashes or beeps. (B) The experimental design factorially manipulated the number of beeps (i.e., 1 to 4), number of flashes (i.e., 1 to 4) and the task relevance of the sensory modality (report number of visual flashes vs. auditory beeps). We reorganized these conditions into a 2 (task relevance: auditory vs. visual report) × 2 (numeric disparity: high vs. low) factorial design for the GLM analyses of the audiovisual crossmodal bias. (C) Response accuracy (across-participants mean ± SEM; n = 40) was computed as correlation between experimentally defined task-relevant and reported signal number. Response accuracy is shown as a function of modality (audiovisual congruent conditions vs. unisensory visual and auditory conditions), task relevance (auditory vs. visual report), and group (HC vs. SCZ). (D) The audiovisual CMB (across-participants mean ± SEM; n = 40) is shown as a function of numeric disparity (1, 2, or 3), task relevance (auditory vs. visual report) and group (HC vs. SCZ). CMB was computed from participants’ behavior (upper panel) and from the prediction of the individually fitted BCI model (lower panel; i.e., model averaging with increasing sensory variances). CMB = 1 for purely visual and CMB = 0 for purely auditory influence. Source data is provided in S1 Data. BCI, Bayesian causal inference; CMB, crossmodal bias; GLM, general linear model; HC, healthy control; SCZ, schizophrenia.
Fig 2
Fig 2. Distributions of numeric reports (across-participants mean ± SEM, n = 40) for HC and SCZ patients.
(A) Upper panel: The auditory numeric reports plotted as a function of auditory signal number nA, separately for different visual signal numbers nV. Lower panel: The visual numeric reports plotted as a function of visual signal number nV, separately for different auditory signal numbers nA. (B) Auditory reports for a single beep as a function of visual signal number (upper panel) and visual reports for a single flash as a function of auditory signal number (lower panel). Source data is provided in S2 Data. HC, healthy control; SCZ, schizophrenia.
Fig 3
Fig 3. The BCI model and factorial model comparisons in HC and SCZ.
(A) The BCI model assumes that audiovisual stimuli are generated depending on a causal prior (pCommon): In case of a common cause (C = 1), the “true” number of audiovisual stimuli (NAV) is drawn from a common numeric prior distribution (with mean μP) leading to noisy auditory (xA) and visual (xV) inputs. In case of independent causes (C = 2), the “true” auditory (NA) and visual (NV) numbers of stimuli are drawn independently from the numeric prior distribution. To estimate the number of auditory and visual stimuli given the causal uncertainty, the BCI model estimates the auditory or visual stimulus number (N^A or N^V, depending on the sensory modality that needs to be reported). In the model-averaging decision strategy, the BCI model combines the forced-fusion estimate of the auditory and visual stimuli (N^AV,C=1) with the task-relevant unisensory visual (N^V,C=2) or auditory estimates (N^A,C=2), each weighted by the posterior probability of a common (C = 1) or independent (C = 2) causes, respectively (i.e., p(C=1|xA,xV) or p(C=2|xA,xV)). (B) The factorial Bayesian model comparison (n = 40) of models with different decision strategies (model averaging, MA; model selection, MS; probability matching, PM; fixed criterion, FC; stochastic fusion, SF) with constant or increasing sensory auditory and visual variances, separately for HC and SCZ. The images show the relative model evidence for each model (i.e., participant-specific Bayesian information criterion of a model relative to the worst model summed over all participants). A larger model evidence indicates that a model provides a better explanation of our data. The bar plots show the protected exceedance probability (i.e., the probability that a given model is more likely than any other model, beyond differences due to chance) for each model factor. The BOR estimates the probability that factor frequencies purely arose from chance. Source data is provided in S3 Data. BCI, Bayesian causal inference; BOR, Bayesian omnibus risk; HC, healthy control; SCZ, schizophrenia.
Fig 4
Fig 4. The parameters of the BCI model (across participants mean ± SEM; n = 40) separately plotted for HC and SCZ patients.
The BCI model’s decision strategy applies model averaging with increasing sensory variance. Significant different are indicated by * = p < 0.05. Source data is provided in S4 Data. BCI, Bayesian causal inference; HC, healthy control; SCZ, schizophrenia.
Fig 5
Fig 5. Adjustment of the BCI model’s causal and numeric priors (mean ± between-participants’ SEM; n = 40) in the current trial to the previous trial’s numeric disparity or task-relevant stimulus number in HC and SCZ.
(A) The current causal prior (pCommon) as a function of previous audiovisual numeric disparity (i.e., |nA-nV|). (B) The current numeric prior’s mean (μP) as a function of the previous task-relevant stimulus number (i.e., nA for auditory and nV for visual report). (C) The current numeric prior’s STD (σP) as a function of the previous task-relevant stimulus number. Source data is provided in S5 Data. BCI, Bayesian causal inference; HC, healthy control; SCZ, schizophrenia.
Fig 6
Fig 6. Decoding the BCI model’s numeric estimates from EEG patterns using SVR in HC versus SCZ (n = 40).
(A) Decoding accuracy (Fisher’s z-transformed correlation; across-participants mean) of the SVR decoders as a function of time and group (HC vs. SCZ). Decoding accuracy was computed as correlation coefficient between the given BCI model’s internal estimates and BCI estimates that were decoded from EEG activity patterns using SVR models trained separately for each numeric estimate. The BCI model’s internal numeric estimates comprise of: (i) the unisensory visual (N^V,C=2), (ii) the unisensory auditory (N^A,C=2) estimates under the assumption of independent causes (C = 2), (iii) the forced-fusion estimate (N^AV,C=1) under the assumption of a common cause (C = 1), and (iv) the final BCI estimate (N^A or N^V depending on the sensory modality that is task-relevant) that averages the task-relevant unisensory and the precision-weighted estimate by the posterior probability estimate of each causal structure. Color-coded horizontal solid lines (HC) or dashed lines (SCZ) indicate clusters of significant decoding accuracy (p < 0.05; one-sided one-sample cluster-based corrected randomization t test). Color-coded horizontal dotted lines indicate clusters of significant differences of decoding accuracy between both groups (p < 0.05; two-sided two-sample cluster-based corrected randomization t test). Stimulus onsets are shown along the x-axis. (B) Bayes factors for the comparison between the decoding accuracies of HC and SCZ for each of the BCI estimate (i.e., BF10 > 3 substantial evidence for or BF10 < 1/3 against group differences). Source data is provided in S6 Data. BCI, Bayesian causal inference; EEG, electroencephalography; HC, healthy control; SCZ, schizophrenia; SVR, support-vector regression.
Fig 7
Fig 7. Occipital ERPs in response to unisensory and audiovisual stimuli in HC and SCZ.
ERPs (across-participants mean grand averages; n = 40) of HC and SCZ participants elicited by unisensory auditory stimuli (A), unisensory visual stimuli (V), audiovisual congruent conditions (AVcongr) and the difference of these ERPs (i.e., AVcongr−(A+V)) indicating multisensory interactions. The ERPs are averaged across occipital electrodes. Color-coded horizontal dotted lines indicate significant clusters (p < 0.05) of ERPs against baseline (i.e., across HC and SCZ, main effect of condition) in one-sample two-sided cluster-based corrected randomization t tests. The horizontal solid line indicates a significant cluster of ERP differences between HC and SCZ in two-sample two-sided cluster-based corrected randomization t tests. The x-axis shows the stimulus onsets. Source data is provided in S7 Data. ERP, event-related potential; HC, healthy control; SCZ, schizophrenia.

Update of

References

    1. Huys QJ, Daw ND, Dayan P. Depression: a decision-theoretic analysis. Annu Rev Neurosci. 2015;38:1–23. Epub 20150211. doi: 10.1146/annurev-neuro-071714-033928 . - DOI - PubMed
    1. Knill DC, Pouget A. The Bayesian brain: the role of uncertainty in neural coding and computation. Trends Neurosci. 2004;27(12):712–9. Epub 2004/11/16. doi: 10.1016/j.tins.2004.10.007 . - DOI - PubMed
    1. Ma WJ. Bayesian Decision Models: A Primer. Neuron. 2019;104(1):164–175. doi: 10.1016/j.neuron.2019.09.037 . - DOI - PubMed
    1. Noppeney U. Perceptual Inference, Learning, and Attention in a Multisensory World. Annu Rev Neurosci. 2021;44. - PubMed
    1. Parr T, Rees G, Friston KJ. Computational Neuropsychology and Bayesian Inference. Front Hum Neurosci. 2018;12:61. Epub 20180223. doi: 10.3389/fnhum.2018.00061 ; PubMed Central PMCID: PMC5829460. - DOI - PMC - PubMed