. 2025 Aug 1;82(2):438-453.
doi: 10.1097/HEP.0000000000001070. Epub 2024 Sep 10.

HAF prevents hepatocyte apoptosis and progression to MASH and HCC through transcriptional regulation of the NF-κB pathway

Affiliations

HAF prevents hepatocyte apoptosis and progression to MASH and HCC through transcriptional regulation of the NF-κB pathway

Karen Acuña-Pilarte et al. Hepatology. .

Abstract

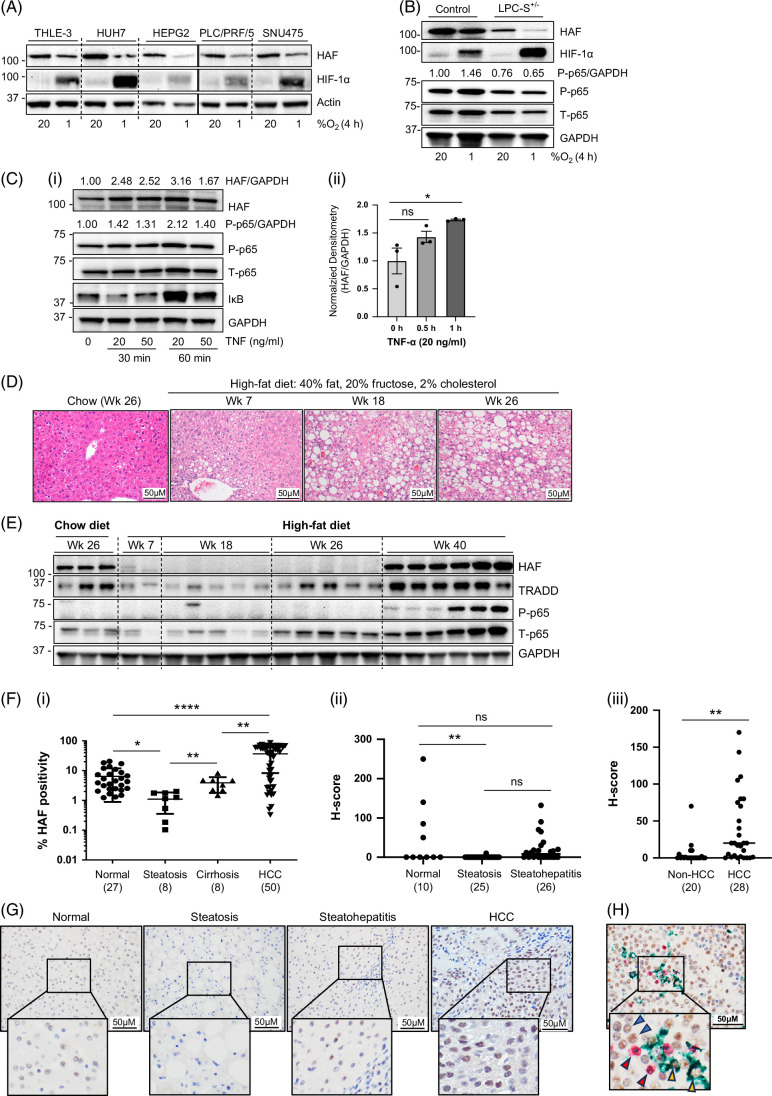
Background and aims: HCC incidence is increasing worldwide due to the obesity epidemic, which drives metabolic dysfunction-associated steatohepatitis (MASH) that can lead to HCC. However, the molecular pathways driving MASH-HCC are poorly understood. We have previously reported that male mice with haploinsufficiency of hypoxia-associated factor (HAF) ( SART1+/ - ) spontaneously develop MASH-HCC. However, the cell type(s) responsible for HCC associated with HAF loss are unclear.

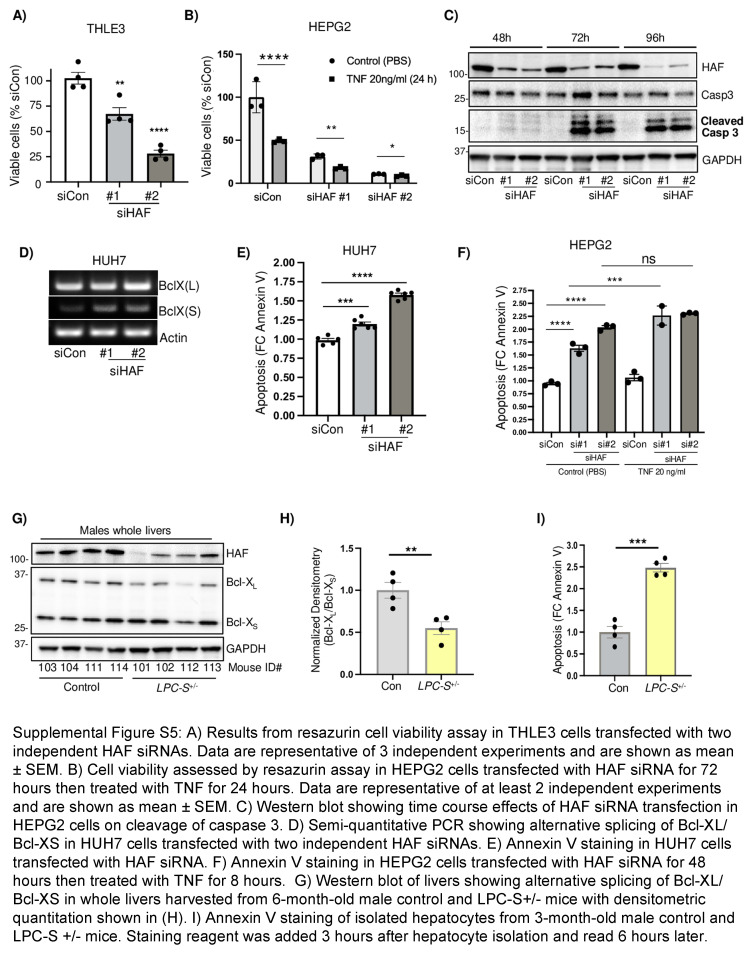
Approach and results: We generated SART1 -floxed mice, which were crossed with mice expressing Cre recombinase within hepatocytes (Alb-Cre; hepS -/- ) or myeloid cells (LysM-Cre, macS -/- ). HepS - / - mice (both male and female) developed HCC associated with profound inflammatory and lipid dysregulation, suggesting that HAF protects against HCC primarily within hepatocytes. HAF-deficient hepatocytes showed decreased P-p65 and P-p50 in many components of the NF-κB pathway, which was recapitulated using HAF small interfering RNA in vitro. HAF depletion also triggered apoptosis, suggesting that HAF protects against HCC by suppressing hepatocyte apoptosis. We show that HAF regulates NF-κB activity by regulating the transcription of TRADD and RIPK1 . Mice fed a high-fat diet showed marked suppression of HAF, P-p65, and TRADD within their livers after 26 weeks but showed profound upregulation of these proteins after 40 weeks, implicating deregulation of the HAF-NF-κB axis in the progression to MASH. In humans, HAF was significantly decreased in livers with simple steatosis but significantly increased in HCC compared with normal liver.

Conclusions: HAF is a novel transcriptional regulator of the NF-κB pathway and is a key determinant of cell fate during progression to MASH and MASH-HCC.

Keywords: HAF; HCC; MASH; NF-κB; apoptosis; hepatocyte.


Conflict of interest statement

Scott. A. Summers owns stock in Centaurus. Mei Yee Koh received grants, is employed by, owns stock, and holds intellectual property rights with Kuda. The remaining authors have no conflicts to report.

Figures

None
Graphical abstract
FIGURE 1
FIGURE 1
Conditional knockout of HAF in hepatocytes promotes MASH and HCC in mice. (A) Easi-CRISPR method to generate floxed SART1 allele at exons 4 and 5. (B) (i) Genotyping strategy of hepS −/ and macS −/ mice with primer binding sites indicated. (ii) Representative results showing floxed and recombined SART1 alleles using isolated DNA from whole livers and isolated peritoneal macrophages from hepS −/ and macS −/ mice, respectively. (C, D) NAS of male and female control, hepS −/, macS −/ at age 12 months and control and LPC-S +/− mice at age 6 months (C), and of male control, macS −/, hepS −/ or hepS −/ + macS −/ at 18 months (D); data shown are the mean ± SEM. Each shape represents NAS from an individual mouse with mouse numbers indicated in brackets below their genotypes. Red-filled shapes indicate tumors histologically verified as HCC, HCA, FCA >0.5 cm or having 2 or more FCAs. (E) Quantification of tumor incidence in male control mice versus male hepS −/ and macS −/ mice at age 18 months. (F) Gross appearance of livers from hepS −/ and hepS −/ + macS −/ mice aged 18 months. Scale bar: 1 cm. (G) Representative H&E-stained livers from male 18-month-old control or hepS −/ mice showing no significant pathologic abnormality (control mice) and steatohepatitis and HCC in hepS −/ mice. *p < 0.05; **p < 0.01; ***p < 0.001; ****p < 0.0001. ns, not significant. Abbreviations: FCA, foci of cytologic alteration; HAF, hypoxia-associated factor; HCA, hepatocellular adenoma; H&E, hematoxylin and eosin; LPC, liver parenchymal cell; MASH, metabolic dysfunction–associated steatohepatitis; NAS, NAFLD activity score.
FIGURE 2
FIGURE 2
HCC in the hepS −/ mice is associated with metabolic dysfunction and inflammation. (A–C) Box plots showing changes in indicated lipid species in livers of male hepS −/ versus control mice at ages 6, 12, and 18 months (5 mice/group) or liver tumors of 18-month-old male hepS −/ mice (3 mice) shown as the mean ± SEM. (D, E) Levels of total acylcarnitines (ACars, D) and most abundant ACars species (E) in nontumor-bearing livers (L) or liver tumors (T) from 18-month-old male control livers (L only) or hepS −/ (L and T) mice. Data are the mean ± SEM. *p < 0.05; **p < 0.01; ***p < 0.001 using 2-way ANOVA followed by the Tukey multiple comparisons tests (only significant changes are indicated). (F) NES obtained through GSEA of differentially expressed proteins from liver tumors of male 18-month-old hepS −/ mice (4 mice) compared with age-matched control littermates (5 mice). (G) Volcano plot showing significantly upregulated and downregulated proteins in hepS −/ tumors compared with age-matched control littermates (2 sample t tests with BH correction, FDR = 0.05, n = 4, 5). Yellow circles: proteins involved in antioxidant response. Red circles: Proteins involved in proliferation/inflammation. Blue circles: Downregulated metabolic proteins. Abbreviations: BH, Benjamini-Hochberg correction; FDR, false discovery rate; GSEA, gene set enrichment analysis; NES, normalized enrichment scores.
FIGURE 3
FIGURE 3
HAF depletion in vivo and in vitro is associated with decreased NF-κB activity. (A, B) Effect of HAF depletion on phosphorylation of NF-κB p65 (P-p65) and NF-κB p50 (P-p50) through western blotting in whole-liver lysates from 6-month-old male LPC-S +/− (A) or female hepS −/ mice (B); and in pooled isolated hepatocytes from two 3-month-old male LPC-S +/− or control mice after ex vivo treatment with indicated durations of TNF (C), with quantitation shown above plots. (D, E) Effect of transient transfection with 2 independent HAF siRNA versus nontargeting control siRNA on (D), protein levels of P-p65/GAPDH and P-p50/T-p50, or (E), NF-κB response element luciferase (NF-κB-RE Luc) reporter activity in HepG2 cells (data shown as mean ± SEM is representative of 3 independent experiments). (F) Western blot showing the effect of FLAG-HAF overexpression on indicated NF-κB pathway components after treatment with indicated durations of 20 ng/mL TNF in HepG2 cells. (G) Effect of FLAG-HAF overexpression on NF-κB-RE Luc in the absence or presence of TNF. Data are representative of 3 independent experiments and are shown as mean ± SEM. *p < 0.05; **p < 0.01; ***p < 0.001; ****p < 0.0001. ns, not significant. Abbreviations: GAPDH, glyceraldehyde-3-phosphate dehydrogenase; HAF, hypoxia-associated factor; LPC, liver parenchymal cell; siRNA, small interfering RNA.
FIGURE 4
FIGURE 4
HAF regulates the transcription of TRADD and RIPK1. (A) Western blot showing the effect of HAF siRNA on major components of the canonical NF-κB pathway in HepG2 cells. (B) Impact of 20 µM MG132 (6 h) on major NF-κB pathway components impacted by HAF siRNA. (C) Quantitation of relative levels of TRADD, RIPK1, TAK1, and NEMO protein normalized to GAPDH after treatment with 25 µg/mL of CHX added 24 hours after HAF siRNA transfection in HepG2 cells and lysed 30, 48, or 72 hours later, based on average values from western blots in Supplemental Figure S4B, http://links.lww.com/HEP/I648. Data are the mean of 3 independent experiments ± SEM. (D, E) Quantitative qRT-PCR analysis of SART1, RIPK1, and TRADD mRNA levels after transfection with HAF siRNA (D), or stable HAF overexpression (E), in HepG2 cells. Data are representative of 3 independent experiments and shown as the mean ± SEM. (F) (i) Construction of luciferase reporters containing 3 tandem repeats of the HAF HBS and flanking regions (SART1 site) or those bearing only the flanking regions without the HBS (SART1 del). F(ii), (iii) Relative luciferase activity of TRADD site 2 (ii), and RIPK1 site (iii), in EV and FLAG-HAF overexpressing ACHN cells. Data are representative of 3 independent experiments (mean ± SEM). (G, H) Western blot showing the impact of TRADD and RIPK1 siRNA (72 h, G), or TRADD/RIPK1 overexpression in cells transfected with HAF siRNA (H), on components of the NF-κB pathway in HepG2 cells. Data are representative of 2 independent experiments. Abbreviations: CHX, cycloheximide; EV, empty vector; GAPDH, glyceraldehyde-3-phosphate dehydrogenase; HAF, hypoxia-associated factor; HBS, HAF binding site; qRT-PCR, quantitative reverse transcription polymerase chain reaction; siRNA, small interfering RNA.
FIGURE 5
FIGURE 5
HAF depletion triggers spontaneous cell death through apoptosis. (A) Impact of HAF siRNA on cell viability (resazurin assay) in indicated cell lines. Data are representative of 3 independent experiments and are shown as mean ± SEM. (B) Western blot showing the impact of HAF siRNA transfection on cell death markers (B) and splicing of Bcl-XL and Bcl-Xs (C) in indicated cell lines. Densitometric ratios of Bcl-XL and Bcl-Xs are shown within blots. (D) Effect of HAF overexpression on Bcl-XL/Bcl-Xs after treatment with TNF. (E) Effect of HAF siRNA ± the pan-caspase inhibitor ZVAD-FMK (20 µM), the necroptosis/RIPK1 inhibitor, necrostatin-1 (50 µM), or both combined, on annexin V staining in HepG2 cells. Inhibitors were added 48 hours after siRNA transfection. Data are representative of 3 independent experiments and are shown as mean ± SEM. (F, G) Western blots showing effects of HAF siRNA ± ZVAD-FMK (20 µM) for 72 hours (F), or overexpression of a HAF siRNA-resistant construct (FLAG-HAF-r) in the context of HAF siRNA in HEPG2 cells (G). (H) Impact of FLAG-HAF-(r) overexpression in the context of HAF siRNA on annexin V staining in HEPG2 cells. (I, J) Quantitation of immunohistochemical staining for cleaved caspase 3 in livers of 6-month-old male and female hepS −/ (I) and LPC-S +/− mice (J) with representative images shown inset. Each data point represents an individual mouse. Data are the mean ± SEM with significance determined using Student t tests between control and experimental mice. Abbreviations: HAF, hypoxia-associated factor; LPC, liver parenchymal cell; siRNA, small interfering RNA.
FIGURE 6
FIGURE 6
HAF is decreased during progression to MASH/HCC in mice and humans. (A, B) Western blots showing the impact of hypoxia (1% O2, 4 h) on indicated cell lines (A), and pooled primary hepatocytes isolated from male 3-month-old control and LPC-S +/− mice (B). (C) Western blots showing the effect of TNF on HAF and NF-κB pathway components (i), with quantitation of 3 independent experiments in (ii). (D, E) H&E (D), and western blots (E), of livers of C57BL/6 mice fed a high-fat diet and sugar water for 7, 18, or 26 weeks compared with mice fed with a chow diet for 26 weeks. F(i) Percentage of HAF nuclear positivity in human TMAs quantitated using Aperio digital quantitation. F(ii), (iii) Pathologist quantitated H-score for HAF staining within hepatocytes (or tumor cells where relevant) in indicated human tissue within additional TMAs (ii), or within HCC and adjacent non-HCC tissue in large tissue sections (iii). (G) Representative images of HAF staining in normal and indicated liver pathology. (H) Representative image for triple staining of HAF (brown) with anti-CD3 (red) and anti-CD68 (green). HAF expression within tumor cells, CD3+ T cells, and CD68+ macrophages are indicated by blue, red, and yellow arrowheads respectively. Abbreviations: HAF, hypoxia-associated factor; H&E, hematoxylin and eosin; LPC, liver parenchymal cell; MASH, metabolic dysfunction–associated steatohepatitis; TMA, tissue microarray.
None
None
None
None
None
None
None

Update of

References

    1. Bray F, Laversanne M, Sung H, Ferlay J, Siegel RL, Soerjomataram I, et al. Global cancer statistics 2022: GLOBOCAN estimates of incidence and mortality worldwide for 36 cancers in 185 countries. CA Cancer J Clin. 2024;74:229–263. - PubMed
    1. Llovet JM, Villanueva A, Marrero JA, Schwartz M, Meyer T, Galle PR, et al. Trial design and endpoints in hepatocellular carcinoma: AASLD Consensus Conference. Hepatology. 2021;73 Suppl 1(Suppl 1):158–191. - PubMed
    1. Younossi Z, Anstee QM, Marietti M, Hardy T, Henry L, Eslam M, et al. Global burden of NAFLD and NASH: Trends, predictions, risk factors and prevention. Nat Rev Gastroenterol Hepatol. 2018;15:11–20. - PubMed
    1. Godoy-Matos AF, Silva Júnior WS, Valerio CM. NAFLD as a continuum: From obesity to metabolic syndrome and diabetes. Diabetol Metab Syndr. 2020;12:60. - PMC - PubMed
    1. Wang X, Zhang L, Dong B. Molecular mechanisms in MASLD/MASH-related HCC. Hepatology. 2024. doi: 10.1097/HEP.0000000000000786 - DOI - PMC - PubMed

MeSH terms

Substances