. 2024 Sep 9;42(9):1549-1569.e16.
doi: 10.1016/j.ccell.2024.08.008.

Glioblastoma induces the recruitment and differentiation of dendritic-like "hybrid" neutrophils from skull bone marrow

Affiliations

Glioblastoma induces the recruitment and differentiation of dendritic-like "hybrid" neutrophils from skull bone marrow

Meeki Lad et al. Cancer Cell. .

Abstract

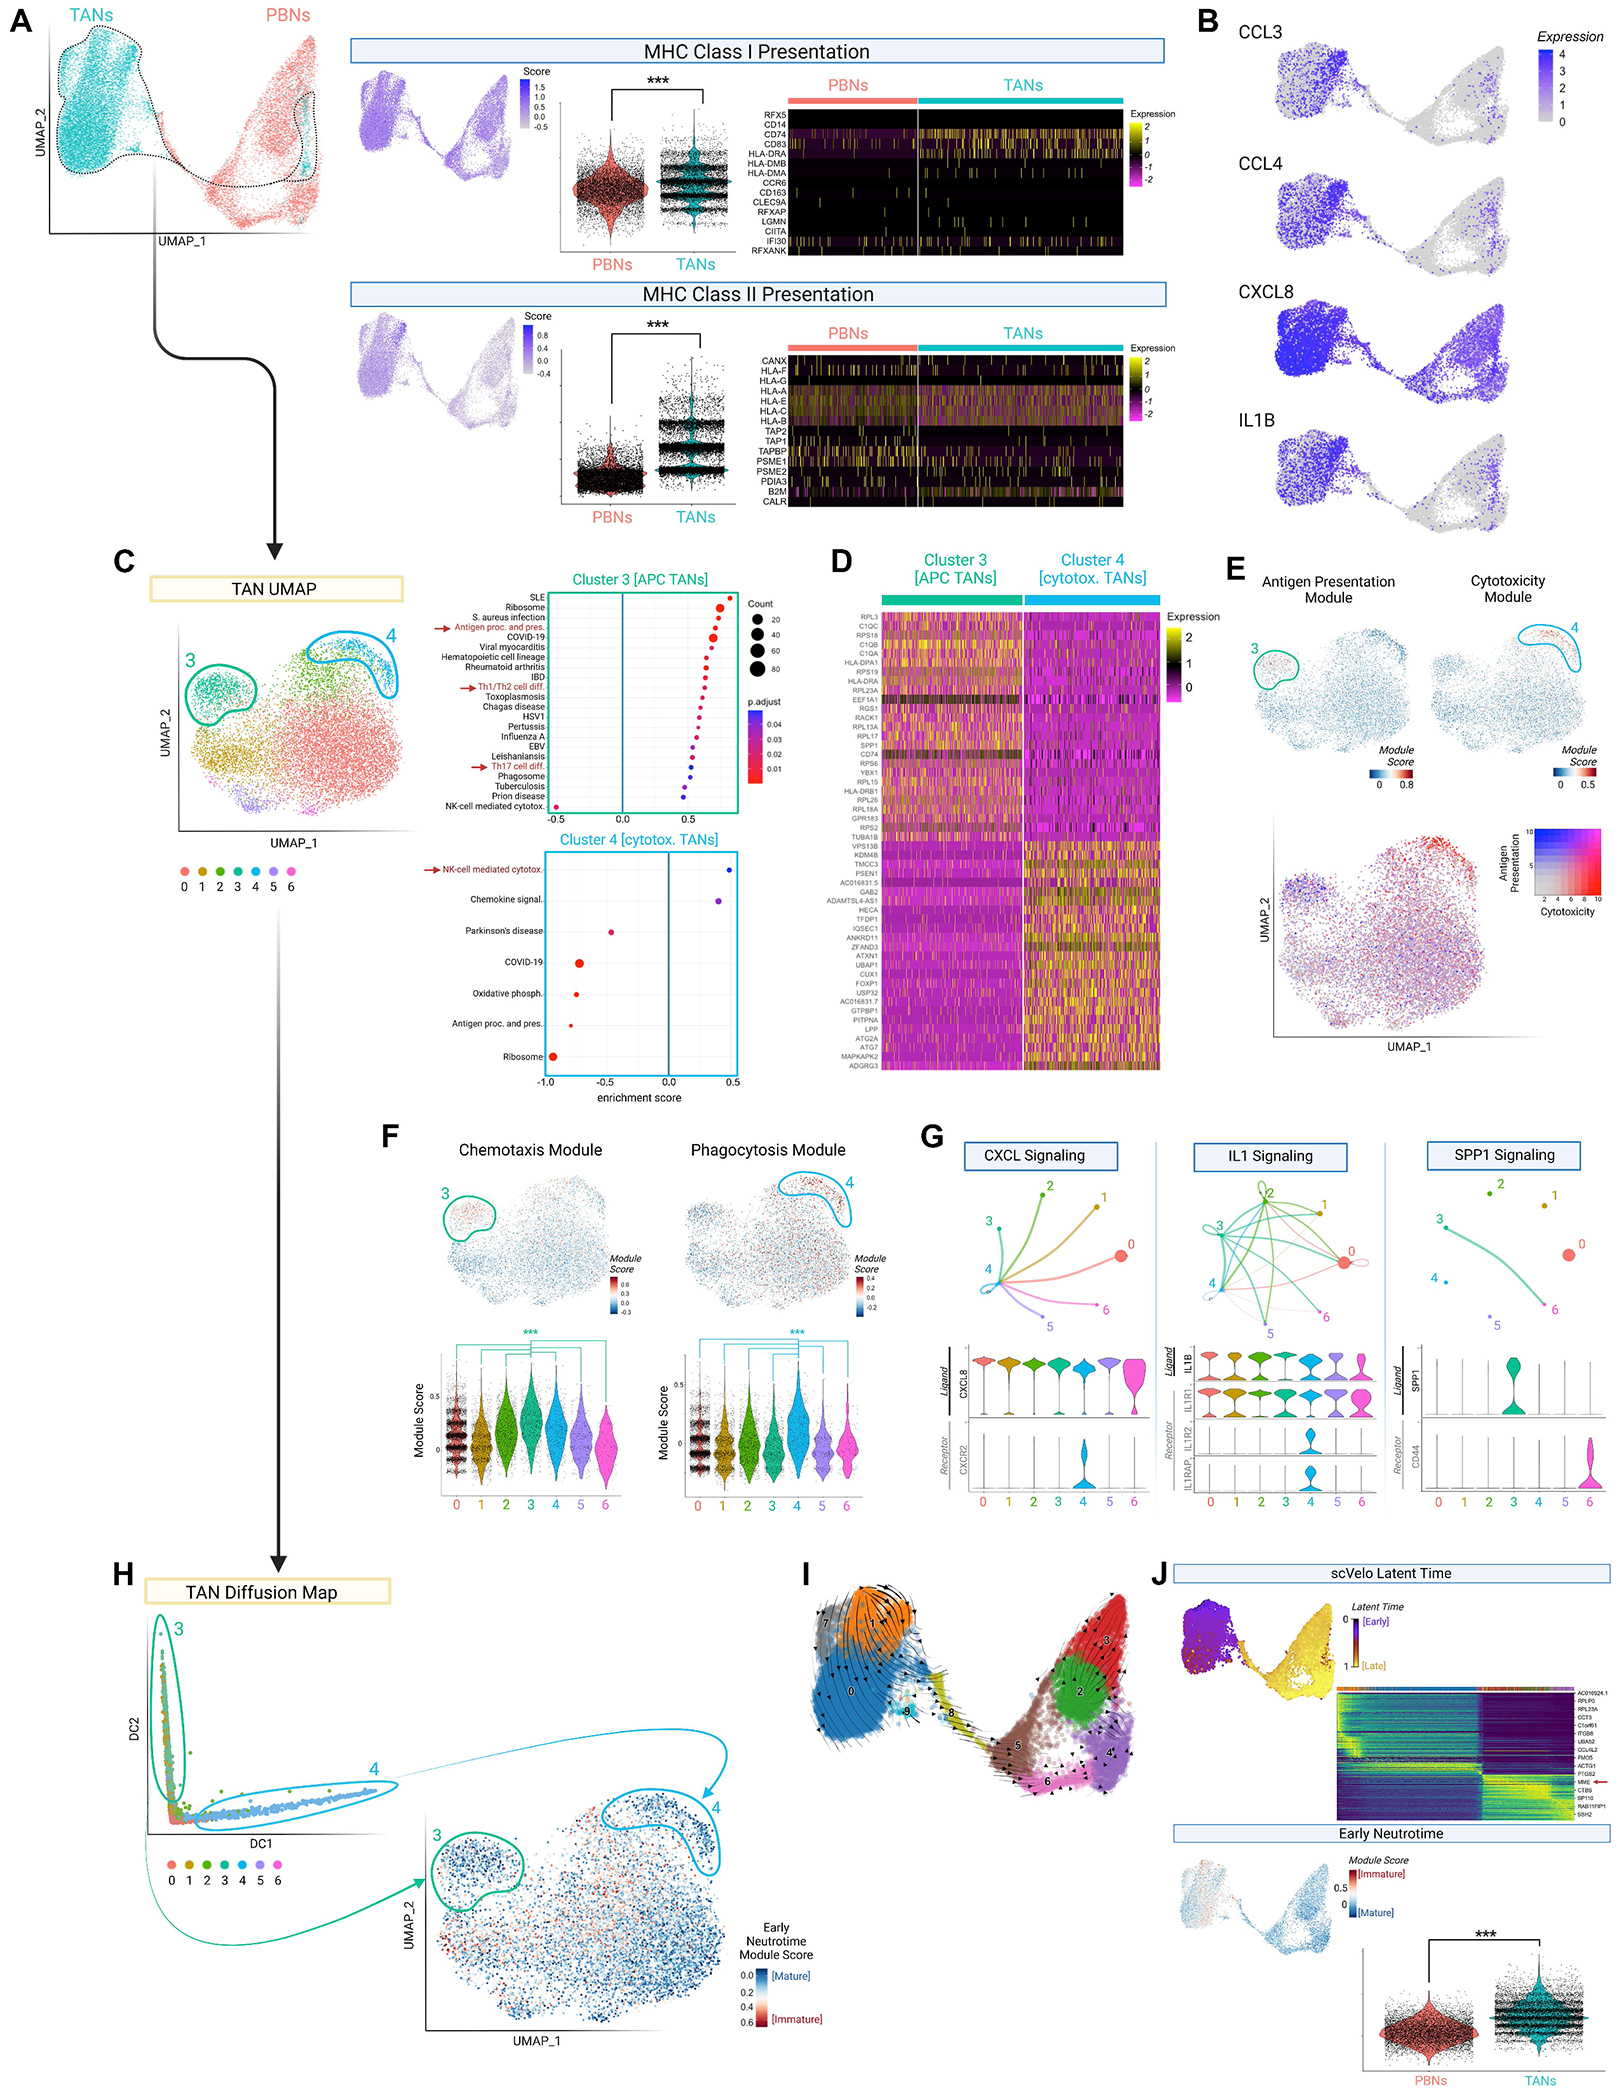
Tumor-associated neutrophil (TAN) effects on glioblastoma (GBM) biology remain under-characterized. We show here that neutrophils with dendritic features-including morphological complexity, expression of antigen presentation genes, and the ability to process exogenous peptide and stimulate major histocompatibility complex (MHC)II-dependent T cell activation-accumulate intratumorally and suppress tumor growth in vivo. Trajectory analysis of patient TAN scRNA-seq identifies this "hybrid" dendritic-neutrophil phenotype as a polarization state that is distinct from canonical cytotoxic TANs, and which differentiates from local precursors. These hybrid-inducible immature neutrophils-which we identified in patient and murine glioblastomas-arise not from circulation, but from local skull marrow. Through labeled skull flap transplantation and targeted ablation, we characterize calvarial marrow as a contributor of antitumoral myeloid antigen-presenting cells (APCs), including TANs, which elicit T cell cytotoxicity and memory. As such, agents augmenting neutrophil egress from skull marrow-such as intracalvarial AMD3100, whose survival-prolonging effect in GBM we report-present therapeutic potential.

Keywords: MHC class II; T cells; antigen-presenting cells; dendritic cells; glioblastoma; myeloid; skull marrow; tumor-associated neutrophil.


Conflict of interest statement

Declaration of interests The authors declare no competing interests.

Figures

Figure 1.
Figure 1.. TANs are robust, morphologically distinct residents of the perivascular niche in GBM.
(A) Schematic depicting patient neutrophil isolation, with TAN infiltration quantified (n=6). (B) Immunohistochemical comparison of endothelial (CD31+) proximity to perivascular GSCs (Nestin+) versus neutrophils (MPO+) in human GBM (n=37-38 cells, 3 GBMs). Scale bar represents 20 μm. (C) Effect of U251cm on neutrophil survival compared to control media (P15h=0.03, P30-90h<0.001), and its neutralization by GM-CSF blockade (n=6/group). (D) Nuclear segmentation of Wright-Giemsa stained cytospins of patient neutrophils, with distribution quantified in histograms below. Mean segmentation compared between PBNs (n=2133) and TANs (n=1824) via unpaired two-tailed Student’s t-test. (E) Above: Membrane circularity (form factor) of DAPI-stained TANs vs PBNs (Pcellular=0.001, Pnuclear<0.001; n=4-8/group). Below: NETosis induction by LPS in cultured TANs vs PBNs (P=0.125; n=4/group). (F) Effect of U251cm on PBN form factor, compared to control (RPMI) or non-GBM-conditioned media (HEK239cm). n=150-743 cells/group. Significance calculated by one-way ANOVA with post-hoc Tukey contrasts. (G-H) Nanostring multiplex assay of myeloid gene expression in patient-matched TANs/PBNs (n=3). G: Volcano plots depicting differentially expressed genes (P<0.05) related to antigen presentation and T cell activation. H: Geometric mean of normalized DC-related gene expression per sample. Data represented as means ± SD. *P<0.05, **P<0.01, ***P<0.001. Unless otherwise specified, significance was calculated by unpaired two-tailed Student’s t-test, with Bonferroni correction applied for multiple comparisons. See also Fig S1 and Tables S1–S3.
Figure 2.
Figure 2.. TANs activate T cells in an MHCII-dependent manner.
(A) Flow cytometric characterization of surface MHCII expression in GBM patient TANs/PBNs (n=8), with representative histograms. Quantification shown on right, with significance calculated by paired two-tailed Student’s t-test. (B) Side scatter (SSC) of patient-matched MHCII+ and MHCII TANs (n=8, P=0.004), with significance calculated by paired two-tailed Student’s t-test. (C) Representative histograms comparing DQ-OVA peptide uptake and processing by GBM patient neutrophils, with aggregate results below (n=3 technical replicates/group). (D) Early (CD69+%) and late (CD25+%) activation of healthy CD3+ T cells cultured with patient neutrophils for 72h and 10 μL/mL CD3/CD28 activator. PCD69+% of CD4+=0.011, CD8+=0.002; PCD25+% of CD4+=0.026, CD8+=0.003 (n=3/group). To determine the role of antigen presentation, TANs were treated with 10 μg/μL αMHCII (PCD69% of CD8+ = 0.033). (E) Late activation (CD25 MFI) of patient CD3+ T cells cultured with autologous neutrophils for 72h, ±10 μL/mL CD3/CD28 activator. PCD3/28− for TAN cocultures<0.001 CD4+/CD8+; PCD3/28+=0.001 CD4+, 0.004 CD8+. Antibody-mediated quenching of surface MHCII on neutrophils before coculture abrogated TAN effects (PCD3/28+=0.010 for CD8+, P<0.001 all others). n=3/group. (F-G) 72h coculture of OT-II CD4+ T cells with OVA 323-339 peptide-pulsed healthy splenocytes or FACS-isolated TANs (from GL261-bearing C57BL/6J mice). Unbracketed asterisks indicate differences compared to T cells alone. n=4/group. F: Representative histogram of T cell proliferation (CFSE dilution; left), quantified as indices or % cells divided (right). G: Early (CD25+) and late (CD69+/44+) activation among cultured T cells. Data represented as means ± SD. *P<0.05, **P<0.01, ***P<0.001. For panels C-G, significance was calculated using one-way ANOVA with post-hoc Tukey contrasts. See also Fig S2.
Figure 3.
Figure 3.. Neutrophil depletion exerts T cell dependent effects on GBM in vivo.
(A-D, F-H, J) BGL1-bearing Balb/CJ mice were treated with regularly dosed αLy6G to deplete neutrophils or isotype. Tumor size proxied by BLI. A: Tumor growth (PPOD24=0.026), with representative BLI images from 1 mouse per cohort. Kaplan-Meier survival (P<0.001) shown below, with significance calculated via log-rank (Mantel-Cox) test. n=9 αLy6G, 8 isotype. B: Flow cytometric characterization of tumor-infiltrating T cells (above; PCD8+=0.015; PDNT=0.008), and Pearson correlation of CD8+ proportion with tumor growth (fold-change from POD6), with significance calculated via least-squares linear regression. n=5/group. C: Cell type scores in POD21 tumors, calculated using a Nanostring tumor signaling gene expression panel (n=5/group). PT =0.025, PCytotoxic=0.003, PNK=0.022. D: Pearson correlation of normalized gene expression (NGE) of cytotoxicity effector function genes with Cd8a, with significance calculated via least-squares linear regression. n=5/group. F-G: Nanostring transcriptomic comparison of the 3 most- and least-neutrophil enriched POD21 tumors, proxied by Fcgr4 expression. (F) Left: top differentially expressed gene (DEG) sets. Right: Volcano plots of DEGs (P<0.05) related to antigen presentation and T cell co-stimulation. (G) Heatmap of select signaling transduction cascade genes. H: Comparison of cytokine abundance in representative áLy6G-treated vs isotype-treated mice, measured as mean pixel density (MPD) on a Proteome Profiler multiplex array of tumor supernatants. Black dots indicate non-differentially abundant proteins (ΔMPD<1). J: Flow cytometric comparison of tumor stroma between αLy6G− (n=5) and isotype-treated (n=4) mice at POD21, analyzed via dimensional reduction (720-2352 cells/sample; representative UMAPs above). Heatmap depicts normalized MFI of markers per cluster. Cluster quantification below, showing reduced mature (P=0.029) and side population (P=0.016) endothelium in neutrophil-depleted mice. (E) Effect of neutrophil depletion (αLy6G) on tumor growth and Kaplan-Meier survival in T cell-deficient (αCD4/CD8/Thy1.2-treated) BGL1-bearing Balb/CJ mice (n=8/group); treatment yields larger tumors (PPOD18=0.010) and impaired survival (P<0.001). (I) MHCM+% of TANs across murine GBM models (n=3-4/group), stratified by the model mean CD8+% of tumoral T cells. Pvs(Balb/CJ)=0.046 for C57BL/6J, <0.001 for T cell-depleted Balb/CJ. Pvs(C57BL/6J)=0.012 for T cell-depleted Balb/CJ. Significance was calculated by one-way ANOVA with post-hoc Tukey contrasts. Data represented as means ± SD, except for BLI (mean ± SEM). POD=post-operative day. *P<0.05, **P<0.01, ***P<0.001. Unless otherwise specified, significance was calculated by unpaired two-tailed Student’s t-test, with Bonferroni correction applied for multiple comparisons. See also Fig S3 and Table S4.
Figure 4.
Figure 4.. scRNA-seq suggests TAN polarization into canonical and hybrid subsets from precursors not seen in circulation.
(A) Left: scRNA-seq of patient-matched PBNs/TANs, in UMAP space. Right: Module scores for MHCI and MHCII-related gene expression, visualized per cell (feature plot) and compared between neutrophil sources (violin plot). Heat maps depict constituent genes. (B) Feature plot depicting expression of cytokine genes. (C) UMAP visualization of TANs, with KEGG pathway enrichment analysis of clusters 3 (green, n=866) and 4 (blue, n=488). Only up- or down-regulated pathways shown; select pathways highlighted in red. (D) Heatmap depicting top 50 differentially expressed genes between cluster 3 (APC) and 4 (cytotoxic) TANs. (E) Feature plots depicting module scores for “Antigen processing and presentation” and “NK-cell mediated cytotoxicity” KEGG pathways (upper plots). Combined representation below. (F) Feature and violin plots depicting module scores for chemotaxis- and phagocytosis-related genes. Comparisons with clusters 3 and 4 are shown in the violin plots below, with significance calculated by Kruskal-Wallis test with post-hoc pairwise Wilcox contrasts. (G) Network graphs from CellChat ligand-receptor analysis of TANs; dot size represents cluster size, and arrows match the ligand-expressing cluster color. Violin plots shown below. (H) Diffusion map of TANs, illustrating clusters 3 and 4 (circled) at opposite ends of the resulting continuous distribution. Corresponding feature plot depicts ‘Early Neutrotime’ scores on the original TAN UMAP, computed based on neutrophil immaturity genes; lower scores indicate greater maturity. (I) RNA velocity vectors (scVelo) showing developmental relationships between TAN and PBN clusters in the combined dataset. (J) Quantification of neutrophil maturity by scVelo latent time (above) and Early Neutrotime (below, inversely proportional to maturity), with scores depicted as feature plots. For latent time, heatmap of top transitionally expressed genes shown. For Early Neutrotime, violin plot comparing PBNs and TANs shown. Data represented as violin plots. *P<0.05, **P<0.01, ***P<0.001. Unless otherwise specified, significance was calculated by unpaired two-tailed Student’s t-test, with Bonferroni correction applied for multiple comparisons. See also Fig S4 and Tables S5–S7.
Figure 5.
Figure 5.. MHCII+ TANs with hybrid features arise from immature BMNs rather than PBNs.
(A) Surface MHCII expression in healthy (above) and patient (below) PBNs exposed to U251cm or U251 cells (“U251cc”) for 16h, and for longer in the healthy volunteer arm (n=6/group). Patient PBNs were also cultured with autologous tumor, ± CD45+ immune cells present. (B) Representative contour plots (left) of MHCII and CD11c expression by FACS-purified mature (CXCR2+Ly6Ghi) and immature (CXCR2Ly6Glo/hi) LinCD11b+Gr1+ BMNs cultured in control or GL261cm for 48h. Wright-Giemsa stained cytospins of immature BMNs (right) depict dendritic processes and irregular nuclei in GL261cm-exposed cells. Images of induced hybrids are stitched together. (C) APC feature induction in immature and mature BMNs exposed to GL261cm, including hybrid marker expression (Pmature=0.010, Pimmature<0.001) and DQ-OVA uptake/processing (Pmature=0.008, Pimmature<0.001). Induction was greater among immature BMNs (Fhybrid=30.84, P<0.001; FDQ-OVA=32.51 , P<0.001), as determined by two-way ANOVA. n=5/group. (D) Size (forward scatter, FSC) and internal complexity (side scatter, SSC) of induced hybrid BMNs, compared to CD11cMHCII canonical BMNs. n=5. (E) Rate of hybrid transformation (# per 1000 starting cells) among C57BL/6J BMNs cultured for 48h in GL261cm. Media was treated with isotype or antibodies targeting IFNγ signaling cytokines. For CXCL9/10/11, the receptor (CXCR3) was instead inhibited. n=3-5/sample. (F) Myeloblastic cells observed in Wright-Giemsa stained cytospins of patient TANs, with non-segmented nuclei, azurophilic hue, and enlarged profile. (G) Above: Dot plots of immaturity (CD49d expression) in 3 paired PBN-TAN samples, as assessed by flow cytometry. Below: Representative histogram of MHCII expression in CD49dhi vs CD49dlo TANs, with quantification below. Significance was calculated by paired two-tailed Student’s t-test. (H) Comparison of maturity (CXCR2 expression) in paired PBNs/TANs collected from GL261-bearing C57BL/6J mice (n=3, P=0.036), as assessed by flow cytometry. Significance was calculated by paired two-tailed Student’s t-test. (I) Flow cytometric characterization of TAN maturity (left) and hybrid polarization (MHCII+%; right) in BGL1-bearing Balb/CJ mice over 25 days, illustrating progressively fewer immature TANs (P10d vs 20d<0.001, P10d vs 25d<0.001, P20d vs 25d= 0.020) and greater MHCII+ TANs (P10d vs 20d<0.001, P10d vs 25d<0.001). n=5-10/group. (J-K) BGL1-bearing Balb/CJ mice were depleted of neutrophils (αLy6G) either early (POD-1 to POD5, n=11) or late (POD11-POD17, n=8) during tumor growth; controls received isotype (n=8). J: Flow cytometric characterization of TANs at 21d, showing reduced immature (Pcontrol<0.001, Plate depl.=0.002) and hybrid (Pcontrol=0.001, Plate depl.=0.002) TAN infiltration with early depletion. K: Kaplan-Meier survival and BLI demonstrates that early depletion attenuates survival (Pcontrol=0.024, Plate depl.=0.003) and yields larger tumors at 21d (Pcontrol=0.030, Plate depl.=0.049). Significance for survival was calculated by log-rank (Mantel-Cox) test. Data represented as means ± SD, except for BLI (mean ± SEM). POD=post-operative day. *P<0.05, **P<0.01, ***P<0.001. For panels A, E, I-K: significance was calculated by one-way ANOVA with post-hoc Tukey contrasts. Unless otherwise specified, significance for other panels was calculated by unpaired two-tailed Student’s t-test, with Bonferroni correction applied for multiple comparisons. See also Fig S5.
Figure 6.
Figure 6.. GBM recruits immature neutrophils from skull marrow in vivo and subsequently induces MHCII expression.
(A) 16h transwell migration of mixed C57BL/6J BM isolates towards control or GL261cm (n=3/group), with unmigrated (above filter, “source”) and migrated (below filter) cells quantified by flow cytometry for GMPs (Psource=0.232, Pmigrated=0.027) and immature neutrophils (Psource<0.001, Pmigrated=0.008). Experimental schematic and gating for HSCs and immature neutrophils shown. (B) Above: Schematic of murine calvarial BM niches and ex vivo assay. Below: Quantification of immature neutrophil migration from calvaria cultured in control or syngeneic tumor-CM for 48h (n=3/group). PC57BL/6J=0.045, PBalb/CJ=0.043. (C-E) BGL1-bearing Balb/CJ mice (n=3) were transplanted with CMFDA-stained skull flaps, and tumors were analyzed at 72h by flow cytometry. C: Above: Experimental schematic. Below: Contour plots of TANs from each mouse, with CMFDA+ skull-derived cells gated based on FMO. Values indicate % of TANs. D-E: Immature (D) and MHCII+ (E) proportion of skull-derived TANs, compared to BMNs in the skull itself (“source”). n=3/group, Pimmature=0.003, PMHCII=0.024. Representative contour plots shown in E. (F) Zebra plot of MHCII expression by definitively skull-derived (GFP+) and other (GFP) TANs in 3 GL261-bearing C57BL/6J mice, which were transplanted with UBC-GFP skull flaps prior to tumor inoculation. Quantification on right, P=0.002. (G) Above: SkullGFP C57BL/6J mice were generated through cranial irradiation and UBC-GFP BM transplantation. Below: Flow cytometric quantification of skull-derived (GFP+) canonical and hybrid TANs from GL261-bearing SkullGFP mice at 20d; histograms shown per mouse, with quantification on right. Significance was calculated by paired two-tailed Student’s t-test. Data represented as means ± SD. *P<0.05, **P<0.01, ***P<0.001. Unless otherwise specified, significance was calculated by unpaired two-tailed Student’s t-test. See also Fig S6.
Figure 7.
Figure 7.. Altering the release of skull marrow precursors impacts the tumor immune profile and survival of GBM-bearing mice.
GL261-bearing C57BL/6J mice received either 13 Gy skull irradiation (n=11) pre-implantation, 10 μg of intracalvarial AMD3100 at POD9 (n=4; dashed line), or no treatment (controls, n=9) (A) Kaplan-Meier survival (Pirrad<0.001, PAMD3100=0.006) and tumor growth (BLI) (Pirrad<0.001 at POD15-18, PAMD3100=0.002), with comparisons relative to controls. Significance for BLI comparisons was calculated by unpaired two-tailed Student’s t-test with Bonferroni correction for multiple comparisons. (B) Flow cytometric quantification of immune populations as a proportion of endpoint tumor cellularity. Total immune cells (Pcontrol<0.001, PAMD3100<0.001), T cells (Pcontrol=0.025, PAMD3100=0.096), cDCs (Pcontrol=0.038, PAMD3100<0.001), and macrophages (Pcontrol<0.001, PAMD3100=0.003) were decreased in skull-irradiated mice. cDCs were enriched in AMD3100-treated mice (Pcontrol<0.001). (C) MHCII expression among tumor-infiltrating myeloid cells, enriched in control (P=0.013) and AMD3100-treated mice (P=0.034), compared to skull-irradiated. (D) Left: Hybrid TAN polarization, greater in controls (P<0.001) than skull-irradiated, and further in AMD3100 (Pvs irrad<0.001, Pvs control<0.001). Data combined over two experiments (n1=3-11 mice/group; n2=6-8 mice/group). Right: Pearson correlation of overall survival and hybrid TAN polarization. (E) Contribution of neutrophil subsets to endpoint tumors, with hybrid contribution reduced in skull-irradiated mice (Pcontrol=0.019; PAMD3100=0.022) and canonical contribution enriched (Pcontrol=0.005, PAMD3100=0.011). (F) Pearson correlation of endpoint tumor necrosis and canonical TAN infiltration. (G) Quantification and representative contour plots of myeloid precursor (CD11blo/hicKithi) infiltration in endpoint tumors. Precursor infiltration is greater in AMD3100-treated mice compared to skull-irradiated (P<0.001) and controls (P<0.001). (H) Memory T cell subsets in endpoint tumors; Tn=naïve, Tem=effector mem., Tcm=central mem. Asterisks indicate differences vs. controls. Data combined over two experiments (n1=3-11 mice/group; n2=6-8 mice/group). αLy6G administration at time of AMD3100 treatment abrogates its effect on Tn diminution (P=0.007) and Tem expansion (P=0.027). (I-K) CD8+ T cell-related phenotypes in endpoint tumors with AMD3100 treatment, compared to controls. Effects are abrogated by αLy6G administration at time of treatment. I: CD8+ T cell activation, proxied by a reduction in CD8 MFI, is enhanced with treatment (left; Pcontrol=0.001, Pirrad<0.001). CD8 MFI correlates with CD4+ memory polarization (right). J: Th1 (CXCR3+IFNγ+) proportion of tumor-infiltrating CD4+ T cells, enriched with treatment (P<0.001). K: T cell distribution, with fewer CD4+ (P<0.001) and greater CD8+ (P=0.046) in treated tumors. Data represented as means ± SD, except for BLI (mean ± SEM). POD=post-operative day. *P<0.05, **P<0.01, ***P<0.001. For Pearson correlations (panels D, F, I), dots are colored by experimental group and significance was calculated by least squares linear regression. Significance for survival comparisons was calculated by log-rank (Mantel-Cox) test. Significance for group mean comparisons was calculated by one-way ANOVA with post-hoc Tukey contrasts. See also Fig S7.

Update of

References

    1. Luo JW, Wang X, Yang Y, and Mao Q (2015). Role of micro-RNA (miRNA) in pathogenesis of glioblastoma. European review for medical and pharmacological sciences 19, 1630–1639. - PubMed
    1. Elliott LA, Doherty GA, Sheahan K, and Ryan EJ (2017). Human Tumor-Infiltrating Myeloid Cells: Phenotypic and Functional Diversity. Front Immunol 8, 86. 10.3389/fimmu.2017.00086. - DOI - PMC - PubMed
    1. Liang J, Piao Y, Holmes L, Fuller GN, Henry V, Tiao N, and de Groot JF (2014). Neutrophils promote the malignant glioma phenotype through S100A4. Clin Cancer Res 20, 187–198. 10.1158/1078-0432.CCR-13-1279. - DOI - PMC - PubMed
    1. Raychaudhuri B, Rayman P, Huang P, Grabowski M, Hambardzumyan D, Finke JH, and Vogelbaum MA (2015). Myeloid derived suppressor cell infiltration of murine and human gliomas is associated with reduction of tumor infiltrating lymphocytes. J Neurooncol 122, 293–301. 10.1007/s11060-015-1720-6. - DOI - PubMed
    1. Singhal S, Bhojnagarwala PS, O’Brien S, Moon EK, Garfall AL, Rao AS, Quatromoni JG, Stephen TL, Litzky L, Deshpande C, et al. (2016). Origin and Role of a Subset of Tumor-Associated Neutrophils with Antigen-Presenting Cell Features in Early-Stage Human Lung Cancer. Cancer Cell 30, 120–135. 10.1016/j.ccell.2016.06.001. - DOI - PMC - PubMed

MeSH terms