. 2024 Sep 16;4(9):100858.
doi: 10.1016/j.crmeth.2024.100858. Epub 2024 Sep 9.

Fully defined NGN2 neuron protocol reveals diverse signatures of neuronal maturation

Affiliations

Fully defined NGN2 neuron protocol reveals diverse signatures of neuronal maturation

Xiwei Shan et al. Cell Rep Methods. .

Abstract

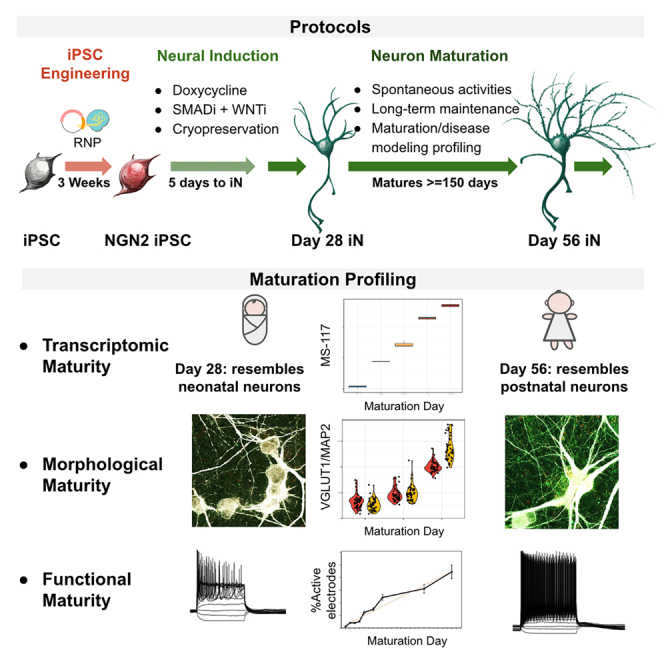
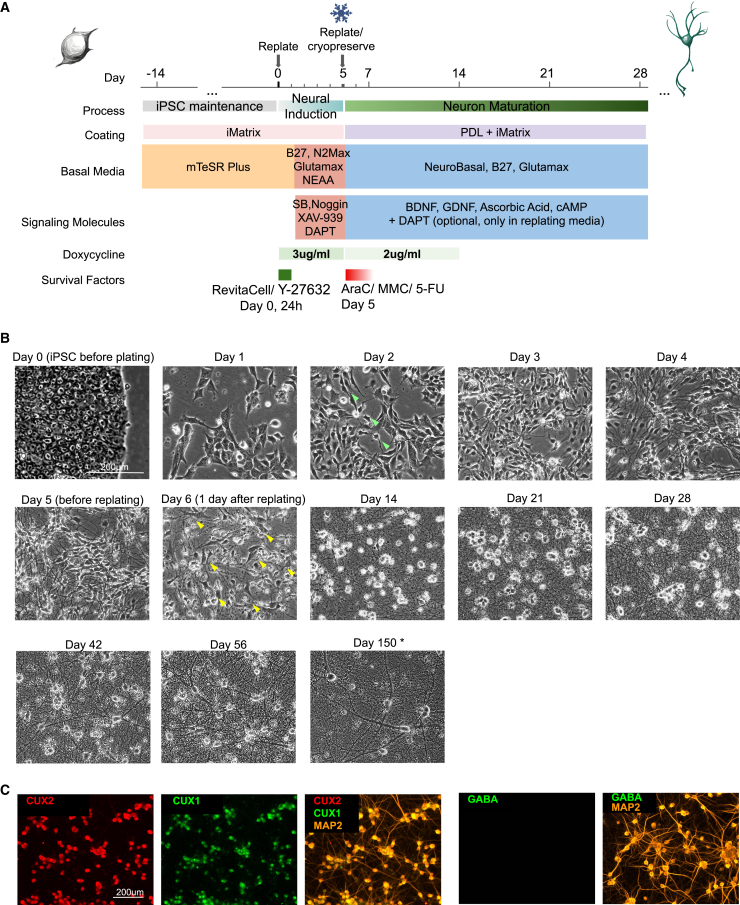
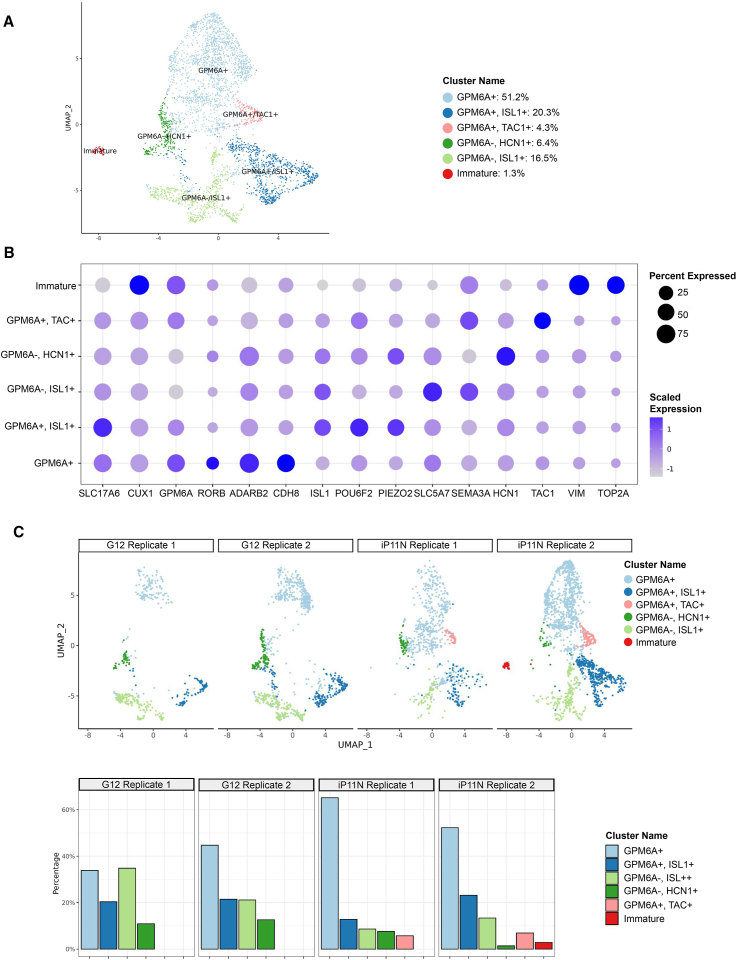
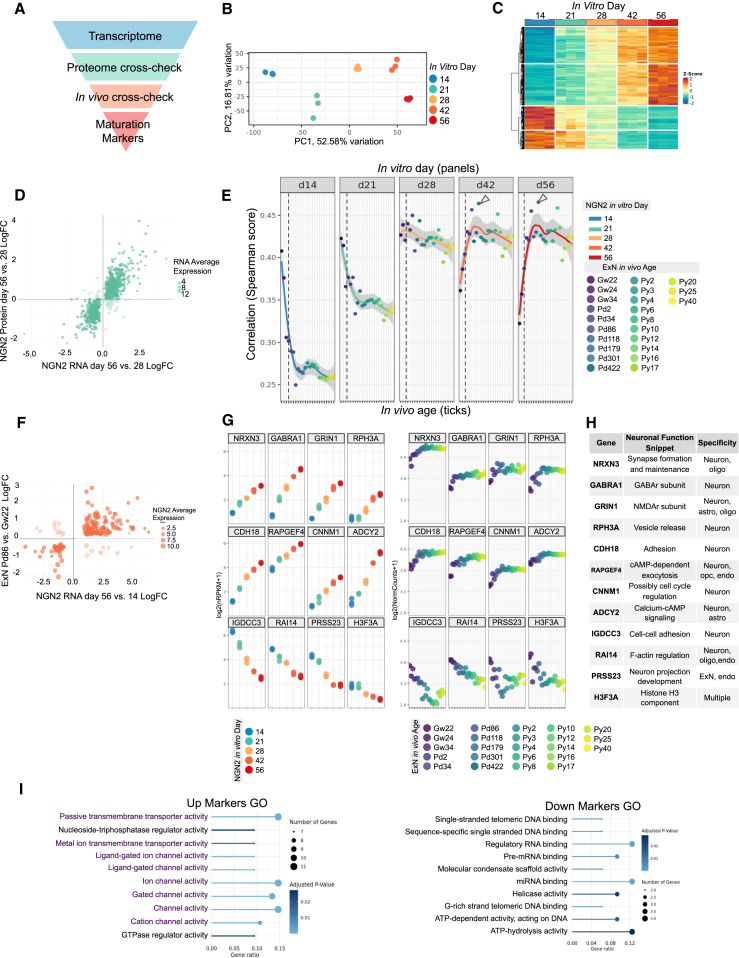
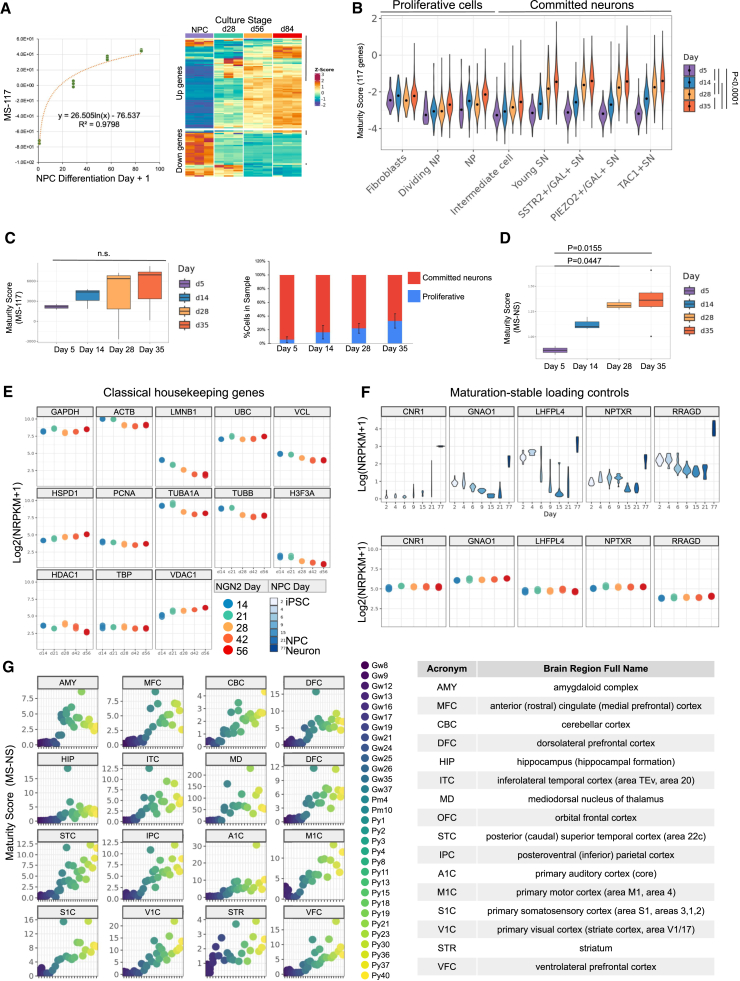
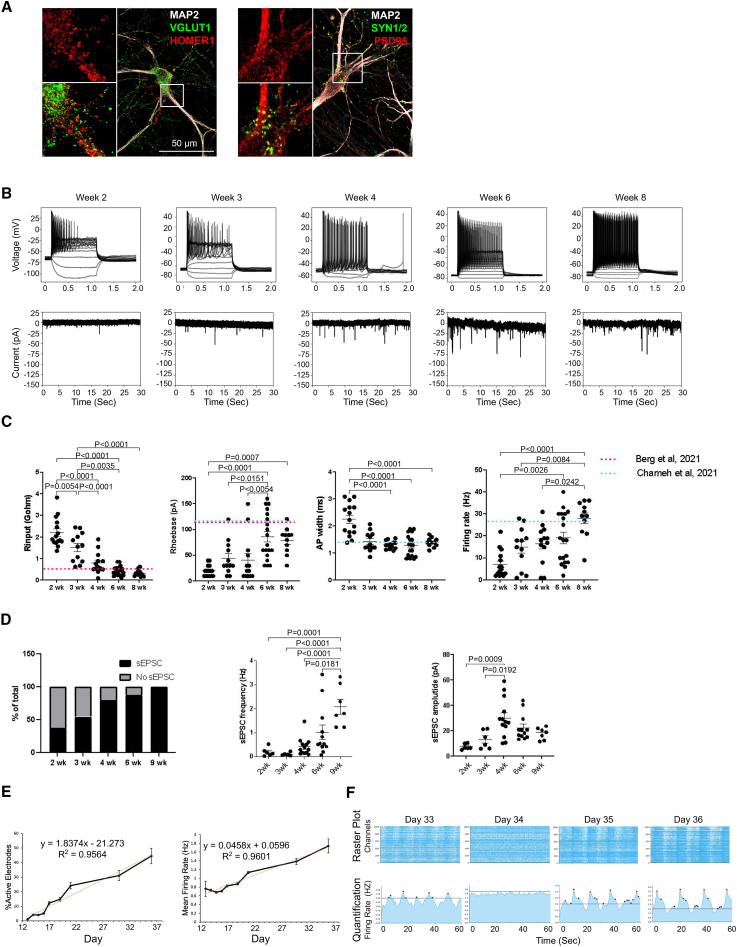
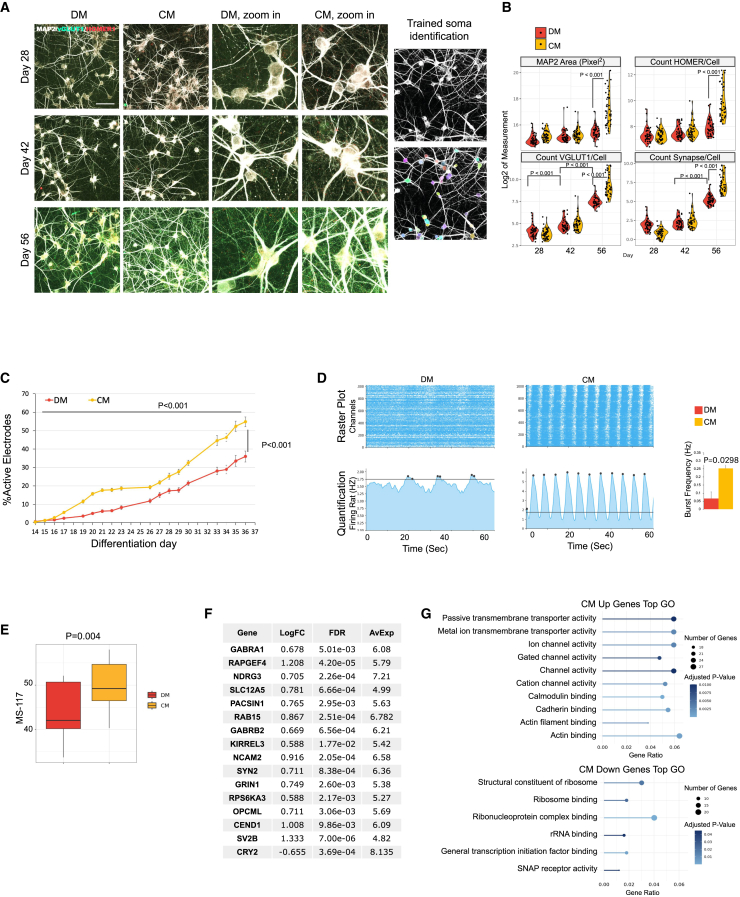
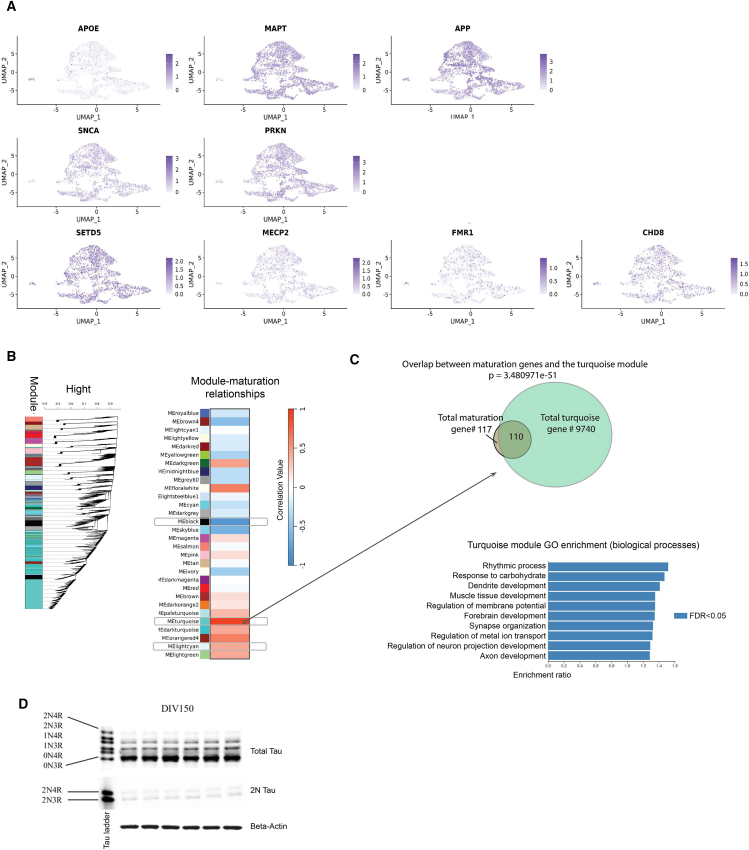
NGN2-driven induced pluripotent stem cell (iPSC)-to-neuron conversion is a popular method for human neurological disease modeling. In this study, we present a standardized approach for generating neurons utilizing clonal, targeted-engineered iPSC lines with defined reagents. We demonstrate consistent production of excitatory neurons at scale and long-term maintenance for at least 150 days. Temporal omics, electrophysiological, and morphological profiling indicate continued maturation to postnatal-like neurons. Quantitative characterizations through transcriptomic, imaging, and functional assays reveal coordinated actions of multiple pathways that drive neuronal maturation. We also show the expression of disease-related genes in these neurons to demonstrate the relevance of our protocol for modeling neurological disorders. Finally, we demonstrate efficient generation of NGN2-integrated iPSC lines. These workflows, profiling data, and functional characterizations enable the development of reproducible human in vitro models of neurological disorders.

Keywords: CP: Neuroscience; CP: Stem cell; NGN2; disease modeling; iPSC; multi-omics profiling; neuron maturation; neuronal differentiation.


Conflict of interest statement

Declaration of interests All authors are employees of Genentech, Inc., a member of the Roche group.

Figures

None
Graphical abstract
Figure 1
Figure 1
NGN2 neuron protocol overview (A) Schematics for NGN2 iN protocol. Coating conditions, basal media, and various factors are illustrated. iPSCs were maintained in mTeSR Plus and iMatrix-511 for 2 weeks post thaw before being replated as single cells for neural induction. At day 5, young neurons were replated. Neurons were maintained in a defined medium (DM) for up to 150 days. (B) Representative images of cell morphologies at key stages. Neuronal morphology emerges on day 2 (green arrows). Day 6, yellow arrows: remaining progenitors. Neurite density and thickness increased from day 14 onwards. ∗Day 150 neurons were plated at 50,000/cm2 instead of 150,000/cm2 for other cultures, to accommodate the specific experimental requirement. Scale bar, 200 μm. N (independent inductions) > 10. (C) Immunofluorescent images identifying NGN2 iNs generated in this protocol as CUX1, CUX2-positive, GABA-negative neurons. See also Figure S1E. Scale bar, 200 μm. N (independent cultures) = 3.
Figure 2
Figure 2
NGN2 iNs cell identities, heterogeneity, and protocol reproducibility (A) Uniform manifold approximation and projection (UMAP) presentation of cell clusters identified by single-nuclei RNA-seq (snRNA-seq) in day-28 NGN2 iNs. Six clusters were identified. N = 4 with two cell lines and two technical replicates each. (B) Quantification of the percentage and average expression of each marker in each identified cluster shown in (A). Shade: scaled expression. Size: percentage of cells expressing the gene. (C) Sample-cluster relationships separated by replicates and cell lines. Top, UMAP distribution of cells generated in each replicate. Bottom: percentage of cells in each cluster, separated by sample.
Figure 3
Figure 3
Transcriptional maturation signature of NGN2 iNs (A) Schematics of the strategy to identify neuronal maturation markers in NGN2 iNs. (B) Principal-component analysis (PCA) of bulk RNA-seq from maturing NGN2 iN. Time points are separated along the PC1 axis. Each dot represents an independently prepared culture sample. (C) Clustered genes with RNA levels correlated with in vitro maturation days (absolute values of Spearman correlation score >0.9). Among highly expressed genes (minimum log(NRPKM) >2), 1,036 genes are positively correlated to in vitro days (top two blocks) and 557 negatively correlated (bottom two blocks). (D) Cross-check of differential expression (day 56 vs. day 28) in RNA-seq and proteomics dataset. Genes that fall in quadrants 2 and 4 were eliminated as their RNA and protein potentially follow different maturation trends. (E) Spearman correlation scores between NGN2 transcription profile and in vivo excitatory neurons (pseudo-bulk). Genes that passed the proteomics cross-check in (D) were used. In vivo ages range from gestation week 22 (Gw22) to postnatal year 40 (Py40). Dashed lines indicate the time of birth. Colored lines indicate fitted curves and shades indicate standard errors. Arrowheads indicate postnatal day 86 (Pd86) where curves peak at differentiation days 42 and 56. (F) Directions of RNA-level fold changes in NGN2 iNs (day 56 vs. 14, x axis) and in vivo excitatory cortical neurons (Pd86 vs. Gw22, y axis). Genes that fall in quadrants 2 and 4 were eliminated. (G) RNA levels of representative maturation marker genes selected from (F). NGN2 iN RNA expressions (left panel) follow similar developmental patterns as the in vivo excitatory neurons (right panel). (H) Functional snippets and cell-type specificities of the representative genes shown in (H). Cell-type specificities were concluded from adult cortical tissue snRNA-seq data that does not contain neuron progenitor clusters (human MTG 10× SEA-AD dataset. MTG, middle temporal gyrus; SEA-AD: Seattle Alzheimer's Disease Brain Cell Atlas). The full list of neuronal markers can be found in Table S2. (I) Top GO terms for up markers (F, quadrant 1) and down markers (F, quadrant 3). Purple texts are under the same parental GO term “transmembrane transporter activity.”
Figure 4
Figure 4
Transcriptome-based maturation scores assess neuronal maturation in iN cultures and in vivo samples (A) Left: NPC-derived neuron differentiation stages versus their maturation score MS-117s. N = 3 (individual culture) for each time point. The relationship between NPC differentiation day (plus one to avoid calculating log0) and MS-117 was fitted with a logarithmic regression model. Right: Z score of each MS-117 gene showing trends in each gene in the maturing NPC-derived neurons. Up genes follow a general upward trend (upper panel) and down genes (lower panel) downward trend. Exceptions are highlighted with gray vertical lines to the right of the heatmap. (B) MS-117 for each identified cluster in a published NGN2 iN single-cell dataset. Adjusted p values generated by one-way ANOVA show significant differences between any two days (p < 0.0001). Each data point was calculated from one cell. (C) Left panel: MS-117 calculated for the pseudo-bulk data generated from the same dataset as (B). No significant differences in pairwise comparisons (p > 0.05). Right panel: percentages of proliferating cells in later datasets trend higher (fibroblasts, dividing NP, NP). N (individual pseudo-bulked sample) = 2, 3, 3, and 6 for days 5, 14, 28, and 35, respectively. Error bars: standard error. (D) Maturation scores calculated with neuron-specific maturation markers and corrected by loading control gene CNR to reduce noise brought by proliferating cells (MS-NS). Adjusted p values as labeled on the graph (p < 0.05). Pairwise comparisons: Tukey honestly significant difference (HSD) test. (E) RNA levels by log2(nRPKM + 1) of classical housekeeping genes in NGN2 iNs. Related to Figure S4. (F) RNA levels of maturation-stable neuron-specific loading controls in iNs. Top row: RNA levels (log(nRPKM + 1)) of maturation-stable, neuron-specific loading controls in progenitor cells and neurons generated by DD. Days 2–21: progenitor cells. Day 77: neurons on day 56 of differentiation. Bottom row: log2(nRPKM + 1) of maturation-stable loading controls and classical loading control genes in developing NGN2 iNs generated in this study. Color code shared with (E). (G) Left: MS-NS calculated from the BrainSpan bulk RNA-seq dataset. Panels separate brain regions. Colors indicate donor age. Right: lookup table for brain region acronym versus full name.
Figure 5
Figure 5
Functional signature of NGN2 iN maturation (A) Representative IF images showing NGN2 iNs generate overlapping pre- and post-synaptic puncta (green, pre-synaptic markers VGLUT1 and SYNAPSIN1/2; red, post-synaptic markers HOMER1 and PSD95; white, cell bodies and dendrites labeled with MAP2. Day 56 differentiation. N > 3. Scale bar, 50 μm). (B) Representative patch-clamp recordings in NGN2 iNs (2–8 weeks). Top panels show resting potentials and APs generated in iNs in response to current injections. The bottom panels show spontaneous excitatory post-synaptic currents recorded in iNs. Neurons show more frequent action potential (AP) events, lower resting membrane potential, and stronger inward currents as they mature. (C) Membrane and AP properties measured with current clamping in NGN2 iNs (2–8 weeks). Older neurons have lower input resistance, higher rheobase, smaller AP widths, and higher maximum firing rate (left to right). Adjusted p values as labeled in graphs (p < 0.05). Tukey HSD test. Two independent recordings were performed. Each dot (N) represents one cell. N = 15, 12, 13, 19, and 11 for 2-, 3-, 4-, 6-, and 8-week time points, respectively. Dotted, colored lines denote previously reported neuronal activity levels from human brain slide recordings., (D) Spontaneous excitatory post-synaptic currents (sEPSCs) in NGN2 iNs (2–9 weeks). Left: percentages of cell population with sEPSC observed to steadily increase from week 2 to 9. Right: sEPSC frequency significantly increases post week 6 (middle) and amplitude slightly increases at 4 weeks. Adjusted p values when p < 0.05 are labeled in graphs. Two independent recordings were performed, each dot (N) represents one cell. N = 16, 11, 15, 16, and 7 cells for 2-, 3-, 4-, 6-, and 9-week time points, respectively; sEPSC-positive iNs are 6, 6, 12, 14, and 7 cells for 2-, 3-, 4-, 6-, and 9-week time points, respectively. (E) Multiple electrode array (MEA) measurements of neuronal activity in NGN2 iNs (days 14–36). Percentages of active electrodes and mean firing rate show positive linear correlations with in vitro days. R2 values as labeld in graphs (> 0.95). See also Figure S5. N (independent culture wells) = 3. (F) Representative MEA recordings of synchronized neuronal activities in NGN2 iNs around day 35. Upper panel, raster plots; lower panel, quantifications of firing rate. Note that bursts (indicated with dots in the lower panel) were detected during the day 33 recording, disappeared on day 34, and were detected again on days 35 and 36. Horizontal lines indicate the burst detection threshold (1.5 Hz). N (independent culture wells) = 3.
Figure 6
Figure 6
Benchmarking maturation assays with astrocyte-CM (A) Image analysis pipeline quantifying synaptogenesis-related neuronal maturation. Left: examples of images captured with a high-content confocal imager for image analysis. Right: examples of MAP2+ cell bodies recognized with Cellpose (highlighted in color). Scale bars, 50 μm. (B) Image analysis results: MAP2 area (squared pixels, upper left), VGLUT1 count (lower left), HOMER1 count (upper right), and overlapping VGLUT1 with HOMER1 (synapse count, lower right). y axes represent log2 values of quantifications. Significant (p < 0.05) pair-wise comparisons are labeled in graphs. Tukey HSD test. N = 27 for each condition, with three independent culture samples and nine images per sample. (C) MEA measurements of NGN2 neuron activities. Percentages of active electrodes were consistently higher in CM-cultured NGN2 iNs than in DM-cultured neurons. p < 0.001. Two-way ANOVA. N (independent culture wells) = 6 for CM and DM respectively. Data are represented as mean ± SEM. (D) More robust synchronized activities were observed in CM-cultured neurons compared with DM. Black dots label detected bursts. Horizontal lines indicate the burst detection threshold (1.75 Hz). Burst frequency in CM is significantly higher than in DM (p = 0.0298). Paired t test. N (independent culture wells) = 6 for CM and DM respectively. Data are represented as mean ± SEM. (E) MS-117 is higher in CM-cultured NGN2 iNs compared with DM counterparts (p = 0.004). Paired t test. N (independent culture wells) = 5 for CM and DM. (F) Log fold change (logFC), false discovery rate (FDR), and average expression (AVExp) in top differentially expressed maturation markers. (G) GO analysis of top differentially expressed genes in CM compared with DM (logFC > 1.5 or <−1.5).
Figure 7
Figure 7
NGN2 neurons can be suitable for disease modeling (A) UMAPs of day 28 snRNA-seq data of NGN2 iNs showing expression and distribution of representative AD (APOE, MAPT, APP), PD (SNCA, PRKN), and ASD (CHD8, SETD5, MECP2, FMR1) genes. Expressed genes appear to be evenly distributed throughout clusters. (B) Left: gene dendrogram and module colors for gene modules found with WGCNA analysis. Right: relationships between gene modules and NGN2 iN maturation days. Colors indicate correlation value. Gray boxes: modules significantly enriched with ASD GWAS genes. FDR = 1.14e−18 (black); 1.59e−20 (turquoise); 9.36e−4 (light cyan). (C) Top: overlap between the maturation genes selected for MS-117 and the turquoise module. Bottom: turquoise module GO enrichment (biological processes). (D) Western blot showing TAU isoforms in NGN2 iNs at differentiation day 150. Cell lysates were treated with λ phosphatase. First lane: TAU ladder. Top panel: all tau isoforms can be detected. 0N3R is the dominant band. Middle panel: 2N3R and 2N4R Tau detected with 2N Tau antibody. Bottom panel: β-actin as loading control. N (individual cultures) = 6.

Similar articles

Cited by

References

    1. Burke E.E., Chenoweth J.G., Shin J.H., Collado-Torres L., Kim S.-K., Micali N., Wang Y., Colantuoni C., Straub R.E., Hoeppner D.J., et al. Dissecting transcriptomic signatures of neuronal differentiation and maturation using iPSCs. Nat. Commun. 2020;11:462. doi: 10.1038/s41467-019-14266-z. - DOI - PMC - PubMed
    1. van de Leemput J., Boles N.C., Kiehl T.R., Corneo B., Lederman P., Menon V., Lee C., Martinez R.A., Levi B.P., Thompson C.L., et al. CORTECON: a temporal transcriptome analysis of in vitro human cerebral cortex development from human embryonic stem cells. Neuron. 2014;83:51–68. doi: 10.1016/j.neuron.2014.05.013. - DOI - PubMed
    1. Strano A., Tuck E., Stubbs V.E., Livesey F.J. Variable Outcomes in Neural Differentiation of Human PSCs Arise from Intrinsic Differences in Developmental Signaling Pathways. Cell Rep. 2020;31 doi: 10.1016/j.celrep.2020.107732. - DOI - PMC - PubMed
    1. Volpato V., Webber C. Addressing variability in iPSC-derived models of human disease: guidelines to promote reproducibility. Dis. Model. Mech. 2020;13 doi: 10.1242/dmm.042317. - DOI - PMC - PubMed
    1. Hulme A.J., Maksour S., St-Clair Glover M., Miellet S., Dottori M. Making neurons, made easy: The use of Neurogenin-2 in neuronal differentiation. Stem Cell Rep. 2022;17:14–34. doi: 10.1016/j.stemcr.2021.11.015. - DOI - PMC - PubMed

MeSH terms

Substances