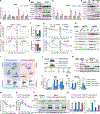
. 2024 Oct 1;36(10):2207-2227.e9.
doi: 10.1016/j.cmet.2024.08.006. Epub 2024 Sep 9.

m6A mRNA methylation in brown fat regulates systemic insulin sensitivity via an inter-organ prostaglandin signaling axis independent of UCP1

Affiliations

m6A mRNA methylation in brown fat regulates systemic insulin sensitivity via an inter-organ prostaglandin signaling axis independent of UCP1

Ling Xiao et al. Cell Metab. .

Abstract

Brown adipose tissue (BAT) regulates systemic metabolism by releasing signaling lipids. N6-methyladenosine (m6A) is the most prevalent and abundant post-transcriptional mRNA modification and has been reported to regulate BAT adipogenesis and energy expenditure. Here, we demonstrate that the absence of m6A methyltransferase-like 14 (METTL14) modifies the BAT secretome to improve systemic insulin sensitivity independent of UCP1. Using lipidomics, we identify prostaglandin E2 (PGE2) and prostaglandin F2a (PGF2a) as BAT-secreted insulin sensitizers. PGE2 and PGF2a inversely correlate with insulin sensitivity in humans and protect mice from high-fat-diet-induced insulin resistance by suppressing specific AKT phosphatases. Mechanistically, METTL14-mediated m6A promotes the decay of PTGES2 and CBR1, the genes encoding PGE2 and PGF2a biosynthesis enzymes, in brown adipocytes via YTHDF2/3. Consistently, BAT-specific knockdown of Ptges2 or Cbr1 reverses the insulin-sensitizing effects in M14KO mice. Overall, these findings reveal a novel biological mechanism through which m6A-dependent regulation of the BAT secretome regulates systemic insulin sensitivity.

Keywords: METTL14; brown fat; human; insulin sensitivity; inter-organ communication; m(6)A; prostaglandins.


Conflict of interest statement

Declaration of interests R.N.K. is on the scientific advisory boards of Novo Nordisk, Biomea, Inversago, and REDD. C.H. is a scientific founder and a member of the scientific advisory board of Accent Therapeutics. M.B. received honoraria as a consultant and speaker from Amgen, AstraZeneca, Bayer, Boehringer Ingelheim, Lilly, Novo Nordisk, Novartis, Pfizer, and Sanofi.

Figures
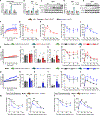
Figure 1.
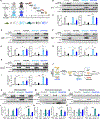
Figure 1.. Ablation of Mettl14 in BAT improves systemic insulin sensitivity and glucose tolerance in mice
(A) RT-qPCR of m6A writer genes METTL3, METTL14, and WTAP in human brown adipose tissues (n = 8 for non-obese; n = 5 for obese). (B) RT-qPCR of Mettl3, Mettl14, and Wtap in interscapular brown adipose tissues of control (db+) and db/db mice (n = 6/group). (C) Western blots of METTL3, METTL14, WTAP, and GAPDH in interscapular brown adipose tissues of control (db+) and db/db mice (n = 6/group). (D) RT-qPCR of Mettl3, Mettl14, and Wtap in interscapular brown adipose tissues of control and LIRKO mice (n = 3/group). (E) Western blots of METTL14 and GAPDH in interscapular brown adipose tissues of control and LIRKO mice (n = 3/group). (F) Body weight trajectories of CD-fed mice (females, n = 12 for control and n = 9 for M14KO groups; males, n = 10 for each control and M14KO group). (G and H) Intraperitoneal insulin tolerance tests (G) and intraperitoneal glucose tolerance tests (H) of CD-fed females (ITT, n = 12 for control and n = 9 for M14KO groups; GTT, n = 10 for control and n = 9 for M14KO groups). (I and J) Intraperitoneal insulin tolerance tests (I) and intraperitoneal glucose tolerance tests (J) of CD-fed males (ITT, n = 9 for control and n = 6 for M14KO groups; GTT, n = 8 for control and n = 7 for M14KO groups). (K and Q) Body weight trajectories of LFD- or HFD-fed control and M14KO females (K) and males (Q) (females, n = 8 for control and n = 5 for M14KO groups on LFD, n = 8 for control and n = 6 for M14KO groups on HFD; males, n = 8 each for control and M14KO groups on LFD or HFD). (L and R) Fasting glucose levels of control and M14KO females (L) and males (R) (females, n = 8 for control and M14KO groups on LFD, n = 8 for control and n = 9 for M14KO groups on HFD; males, n = 8 for each group). (M and S) Fasting insulin levels in the serum of control and M14KO females (M) and males (S) (females, n = 8 for each group; males, n = 7 for control and n = 8 for M14KO on LFD; n = 8 for each group on HFD). (N and T) HOMA-IR of LFD- or HFD-fed control and M14KO females (N) and males (T) (females, n = 8 for each group; males, n = 7 for control and n = 8 for M14KO on LFD, n = 8 for each group on HFD). (O and U) Intraperitoneal insulin tolerance tests of LFD- or HFD-fed control and M14KO females (O) and males (U) (females, n = 8 for control and n = 9 for M14KO on HFD, n = 8 for each group on LFD; males, n = 7 for each group on HFD, n = 8 for control, and n = 7 for M14KO on LFD). (P and V) Intraperitoneal glucose tolerance tests of LFD- or HFD-fed control and M14KO females (P) and males (V) (females, n = 8 for control, n = 9 for M14KO on HFD, and n = 8 for each group on LFD; males, n = 8 for each group). (W and X) Intraperitoneal insulin tolerance tests (W) and intraperitoneal glucose tolerance tests (X) of CD-fed control and M14KO males treated with 7-day cold exposure (n = 5 for the control group and n = 6 for M14KO group). (Y and Z) Intraperitoneal insulin tolerance tests (Y) and intraperitoneal glucose tolerance tests (Z) of CD-fed control and M14KO males treated with 7-day thermoneutrality exposure (ITT, n = 7 for control and n = 9 for M14KO group; GTT, n = 5 for control and n = 6 for M14KO group). All samples in each panel are biologically independent. Data are expressed as means ± SEM. *p < 0.05, **p < 0.01, and ***p < 0.001 by two-way ANOVA (F–K, O–Q, and U–Z) and two-tailed unpaired t test (A, B, D, L–N, and R–T). See also Figure S1.
Figure 2.
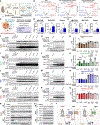
Figure 2.. Ablation of Mettl14 in BAT enhances insulin sensitivity of mouse peripheral metabolic tissues and human metabolic cells by secretory factors
(A) Schematic of metabolic tissue collection at indicated time points after vena cava saline/insulin injection in LFD- or HFD-fed control and M14KO male mice (n = 3/group). (B–I) The insulin-stimulated pIRβ/IGF1Rβ and pAKTs473 in the liver (B and C), eWAT (D and E), iWAT (F and G), and muscle (H and I) after injection of 1U insulin into the vena cava (n = 3/group). (J) Experimental scheme of in vitro co-culture experiments. Differentiated human white adipocytes, human primary hepatocytes, and differentiated human myotubes were treated with differentiated human brown adipocytes conditioned media for 16 h and stimulated with 100 nM insulin for 15 min. (K–P) The insulin-stimulated pIRβ/IGF1Rβ and pAKTs473 in human white adipocytes (K and L), human primary hepatocytes (M and N), and differentiated human myotubes (O and P) treated with or without hBAT-conditioned media (n = 3 independent experiments). All samples in each panel are biologically independent. Data are expressed as means ± SEM. *p < 0.05, **p < 0.01, and ***p < 0.001 by two-tailed unpaired t test (B, E, G, I, L, N, and P). CM, conditioned media. See also Figure S2.
Figure 3.
Figure 3.. Ablation of Mettl14 improves insulin sensitivity primarily through prostaglandin E2 and prostaglandin F2a
(A) Schematic of sample preparation for untargeted signaling lipidomics. (B) Volcano plots of differentially downregulated (blue data points) and upregulated (red data points) lipids in M14KO-iBAT, M14KO-iBAT conditioned Krebs solution and sgM14-hBAT-conditioned media identified by LC-MS lipid analysis (n = 9 for iBAT and iBAT conditioned Krebs solution, n = 3–6 for hBAT-conditioned media, log2 [fold change] threshold = 2, p value threshold = 0.05). (C) Venn diagram of all differentially abundant lipids in M14KO-iBAT, M14KO-iBAT conditioned Krebs solution, and sgM14-hBAT-conditioned media (n = 9 for iBAT and iBAT conditioned Krebs solution, n = 3–6 for hBAT-conditioned media, log2 [fold change] threshold = 2, p value threshold = 0.05). (D and E) PGE2 (D) and PGF2a (E) concentrations in hBAT-conditioned media (CM), iBAT conditioned Krebs solution (CKS), and mouse plasma measured by ELISAs (hBAT-CM, n = 4 for sgNTC, n = 4 for sgM14#1/2/3; iBAT-CKS, n = 5–9/group; plasma, n = 9/group). (F, I, L, and O) Western blot of pIRβ/IGF1Rβ and pAKTs473 in HepG2 (F), C2C12 (I), hWAT (L), and hBAT (O) cells induced by PGE2 (100 nM) or insulin (100 nM) pretreated with EP1/2/3/4 receptor antagonists ONO8711, PF04418948, L826266, and AH23848 (LE, longer exposure; n = 3 biological replicates). (G, J, M, and P) Western blot of represented pIRβ/IGF1Rβ and pAKTs473 in HepG2 (G), C2C12 (J), hWAT (M), and hBAT (P) cells induced by PGF2a (10 nM) or insulin (100 nM) pre-treated with FP receptor antagonist OBE022 (LE, longer exposure; n = 3 biological replicates). (H, K, N, and Q) 2-deoxyglucose uptake in HepG2 (H), C2C12 (K), hWAT (N), and hBAT (Q) cells pre-treated with PGE2 (100 nM for HepG2, C2C12, hWAT, and hBAT cells) or PGF2a (10 nM) and indicated antagonist(s) overnight, followed by treatment with insulin (100 nM) for 15 min (HepG2, n = 6 biological replicates; C2C12, n = 6 biological replicates; hWAT, n = 6 biological replicates; hBAT, n = 3–6 biological replicates). (R and S) Western blot of phosphatases for IR, PI3K, and AKT in HepG2 cells pre-treated with PGE2 (R) or PGF2a (S) in the presence of indicated antagonists (n =3 biological replicates). (T) Proposed model for mechanisms of action for PGE2 and PGF2a in HepG2 cells. Data are presented as mean ± SEM of biologically independent samples. *p < 0.05, **p < 0.01, and ***p < 0.001 by two-tailed unpaired t test (D, E, H, K, N, and Q). See also Figures S3–S5 and Table S2.
Figure 4.
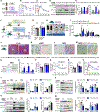
Figure 4.. PGE2 and PGF2a are the M14KO-iBAT secreted insulin sensitizers
(A) Schematic of neutralization experiments in control and M14KO mice. Control mice were injected with isotype-matching IgG control, and M14KO mice were injected with either IgG control antibody or 2B5 (anti-human PGE2 recombinant antibody). (B and C) Intraperitoneal insulin tolerance tests (B) and intraperitoneal glucose tolerance tests (C) of control mice injected with IgG and M14KO mice injected with IgG or 2B5 (ITT, n = 9 for the control and n = 6 for M14KO groups; GTT, n = 6/group). (D and E) Western blot (D) and quantification (E) of pIRβ/IGF1Rβ and pAKTs473 in the liver from control or M14KO mice that received IgG or 2B5, followed by 1 U insulin injection via vena cava (n = 2 for non-stimulated group; n = 3 for insulin-stimulated group). (F) Overview of the administration of PGE2+PGF2a every other day via intraperitoneal injections of either vehicle (saline), 25 mg/kg (12.5 mg/kg PGE2 + 12.5 mg/kg PGF2a), or 50 mg/kg (25 mg/kg PGE2 + 25 mg/kg PGF2a) PGE2+PGF2a into 12-week-old mice fed either with LFD or HFD for 21 days (n = 8/group). (G) Body weight of the vehicle-, 25 mg/kg PGE2+PGF2a-, or 50 mg/kg PGE2+PGF2a-injected LFD- or HFD-fed mice after 3-week injection (n = 8/group). (H) Representative gross appearance of body size, adipose tissues, and liver in vehicle- or 25 mg/kg PGE2+PGF2a-treated mice (n = 3). (I) Tissue weight of iBAT, iWAT, eWAT, liver, and pancreas of vehicle-, 25 mg/kg PGE2+PGF2a-, or 50 mg/kg PGE2+PGF2a-injected LFD- or HFD-fed mice after 3-week injection (n = 3–8/group). (J–M) Representative H&E staining in the liver (J), eWAT (K), iWAT (L), and UCP1 immunohistochemistry staining of iWAT (M) from vehicle- or 25 mg/kg PGE2+PGF2a-injected HFD-fed mice (n = 3). (N and O) Western blot (N) and quantification (O) of PGC1α, UCP1, and PRDM16 in iWAT from vehicle- or 25 mg/kg PGE2+PGF2a-injected HFD-fed mice (n = 4/group). (P–S) 6 h-fasting glucose levels (P), intraperitoneal insulin tolerance tests (Q), overnight-fasting glucose levels (R), and intraperitoneal glucose tolerance tests (S) of vehicle-, 25 mg/kg PGE2+PGF2a-, or 50 mg/kg PGE2+PGF2a-injected LFD- or HFD-fed mice (n = 8/group). (T and U) Western blot and quantification of pIRβ/IGF1Rβ and pAKTs473 in the liver (T) and iWAT (U) after 21-day injection of saline or 25 mg/kg PGE2+PGF2a, followed by 1 U insulin injection via vena cava (n = 3 for non-stimulated group; n = 5 for insulin-stimulated group). (V and W) Western blot and quantification of indicated phosphatases in liver (V) and iWAT (W) (n = 5/group). All samples in each panel are biologically independent. Data are expressed as means ± SEM. *p < 0.05, **p < 0.01, and ***p < 0.001 by two-tailed unpaired t test (O and T–W) and two-way ANOVA (B, C, E, G, I, and P–S). See also Figure S6.
Figure 5.
Figure 5.. Plasma levels of PGE2 and PGF2a are negatively associated with obesity and insulin resistance in humans
(A) Plasma PGE2/PGD2 levels in lean (BMI < 25 kg/m2), overweight (BMI > 25 kg/m2, <30 kg/m2), and obese (BMI > 30 kg/m2) subjects (n = 55). **p < 0.01, ***p < 0.001. Data are represented as mean ± SEM. L, lean; OV, overweight; OB, obese (L, n = 15; OV, n = 13; OB, n = 27). (B) Plasma levels of PGE2/PGD2 in individuals categorized as BAT— or BAT+ (BAT—, n = 33; BAT+, n = 22). (C) Spearman correlation between the plasma levels of PGE2/PGD2 and BMI (n = 55). (D) Spearman correlation between the plasma levels of PGE2/PGD2 and insulin resistance measured by HOMA-IR (n = 55). (E) Plasma PGF2a levels in lean (BMI < 25 kg/m2), overweight (BMI > 25 kg/m2, <30 kg/m2), and obese (BMI > 30 kg/m2) subjects (L, n = 15; OV, n = 13; OB, n = 27). (F) Plasma levels of PGF2a in individuals categorized as BAT— or BAT+ (BAT—, n = 33; BAT+, n = 22). (G) Spearman correlation between the plasma levels of PGF2a and BMI (n = 55). (H) Spearman correlation between the plasma levels of PGF2a and insulin resistance measured by HOMA-IR (n = 55). (I) Correlation between serum PGE2 levels and BMI in individuals who are obese (n = 175). (J) Correlation between serum PGF2a levels and insulin resistance measured by HOMA-IR in individuals who are obese (n = 175). (K) Correlation between serum PGE2 levels and BMI in individuals who are obese (n = 175). (L) Correlation between serum PGF2a levels and insulin resistance measured by HOMA-IR in individuals who are obese (n = 175). (M) Spearman correlation between the plasma levels of PGE2 and Matsuda index (n = 59). (N) Spearman correlation between the plasma levels of PGE2 and BMI (n = 59). (O) Spearman correlation between the plasma levels of PGE2 and insulin resistance measured by HOMA-IR (n = 59). (P) Spearman correlation between the plasma levels of PGF2a and Matsuda index (n = 75). (Q) Spearman correlation between the plasma levels of PGF2a and BMI (n = 75). (R) Spearman correlation between the plasma levels of PGF2a and insulin resistance measured by HOMA-IR (n = 75). For human cohort 1, relative concentrations are used in (A)–(F) because the lipid quantification data were detected using non-targeted lipidomics. For human cohort 2, PGE2 and PGF2a concentrations were measured by ELISAs. Transformed values of metabolites and clinical variables levels were used. For human cohort 3, PGE2 and PGF2a levels were measured by ELISAs. Absolute concentrations were used. All samples in each panel are biologically independent. *p < 0.05, **p < 0.01, ***p < 0.001. See also Figure S7 and Tables S3–S5.
Figure 6.
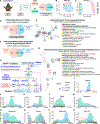
Figure 6.. METTL14 selectively methylates transcripts encoding prostaglandin biosynthesis enzymes and their regulators
(A) Schematic illustration of the RNA-seq and m6A-seq bioinformatic analyses strategy of iBAT samples from control and M14KO mice. (B) PCA plot of RNA-seq in controls (black dots, n = 4 independent biological samples) and M14KO-iBAT (blue dots, n = 4 independent biological samples). (C) PCA plot of m6A-seq in controls (black dots, n = 4 independent biological samples) and M14KO-iBAT (blue dots, n = 4 independent biological samples). (D) Venn diagram representation of the upregulated (red), downregulated (blue), and unchanged genes (black) of M14KO-iBAT compared with control-iBAT. Statistical analyses were performed using the Benjamin-Hochberg procedure, and genes were filtered for p < 0.01. (E) Top 15 enriched GOs and pathways of upregulated genes in M14KO-iBAT versus control-iBAT. (F) Venn diagram representation of the intersection between upregulated genes (red) with m6A-hypomethylated genes (blue) in M14KO-iBAT versus control-iBAT. Genes were filtered for p < 0.05. (G) Functional enrichment of intersected genes in (F). (H) Representation of prostaglandins biosynthesis pathway based on KEGG and Wikipathway annotations depicting several m6A hypomethylated genes (blue) and unchanged genes (black) and the upregulated prostaglandins suggested by LC-MS/MS lipidomics (red) in M14KO-iBAT versus control-iBAT (genes filtered for p < 0.05). (I–Q) Coverage plots of m6A peaks in Ptges2 (I), Cbr1 (J), Akr1b10 (K), Pparγ (L), Ppargc1α (M), Ppargc1β (N), Ednrα (O), Plasg12a (P), and Hsd11b1 (Q) transcripts in M14KO-iBAT versus control-iBAT. Plotted coverages are the median of the n replicates presented. All samples in each panel are biologically independent. See also Figure S8.
Figure 7.
Figure 7.. METTL14-mediated m6A installation promotes decay of PGs biosynthesis enzymes and their regulators mRNA in a YTHDF2/3-dependent manner
(A) RT-qPCR analysis of the indicated mRNA expression levels in the iBAT of male control and M14KO mice. mRNA expression levels were normalized to β-actin (n = 7–8/group). (B) Western blot analysis of the indicated proteins in the iBAT from male control and M14KO mice. GAPDH was used as a loading control (n = 6/group). (C) RT-qPCR analysis of the indicated mRNAs in sgNTC and sgM14 hBAT cells. mRNA levels were normalized to ACTB mRNA (n = 3/group). (D) Western blot analysis of the indicated proteins in the sgNTC and sgM14 hBAT cells. GAPDH was used as a loading control (n = 3/group). (E) RT-qPCR analysis of the indicated mRNA expression levels in differentiated sgNTC or sgM14 hBAT cells after a time course treatment with 100 μg/mL actinomycin D (Act D). mRNA levels were normalized to ACTB mRNA (n = 3/group). (F) RT-qPCR analysis of YTHDF2 and YTHDF3 mRNAs in differentiated wild-type hBAT cells transfected with siNTC/siYTHDF2/siYTHDF3 siRNA. mRNA levels were normalized to β-ACTIN mRNA (n = 3/group). (G) RT-qPCR analysis of the β-ACTIN, PTGES2, CBR1, and AKR1B10 mRNA in differentiated wild-type hBAT cells transfected with siNTC/siYTHDF2/siYTHDF3 siRNA and treated with 100 mg/mL Act D for the indicated time. PTGES2, CBR1, and AKR1B10 mRNA levels were normalized to β-ACTIN (n = 3/group). (H) Protein stability of indicated proteins in differentiated sgNTC- or sgM14-hBAT cells incubated with 100 μg/mL cycloheximide (CHX) for the indicated time. GAPDH was used as a loading control (n = 3/group). (I) A proposed model for the molecular mechanism of action that METTL14-mediated m6A installation destabilizes transcripts encoding prostaglandin biosynthesis enzymes. (J) Scheme of experimental approach depicting control mice receiving AAV8 eGFP (AAV-scramble), M14KO mice receiving AAV8 eGFP, M14KO mice receiving AAV8 knocking down Ptges2 (AAV-shPtges2), and M14KO mice receiving AAV8 knocking down Cbr1 (AAV-shCbr1) (n = 5/group). (K and L) Western blot analysis (K) and quantification (L) of METTL14, PTGES2, and CBR1 in iBAT of the AAV-injected mice. (M) PGE2 and PGF2a concentrations in mouse plasma measured by ELISAs (n = 6 for cont-AAV-scr; n = 5 for M14KO groups). (N and O) Intraperitoneal insulin tolerance tests (N) and intraperitoneal glucose tolerance tests (O) of mice injected with AAVs (n = 7 for cont-AAV-scr; n = 5 for M14KO groups). (P and Q) Western blot analysis (P) and quantification (Q) of pIRβ/IGF1Rβ and pAKTs473 in livers of mice 5-weeks post-AAV injections, followed by injection of 1U of insulin via the vena cava (n = 2 for non-stimulated groups; n = 3 for insulin-stimulated groups). All samples in each panel are biologically independent. Data are expressed as means ± SEM. *p < 0.05, **p < 0.01, and ***p < 0.001 by two-tailed unpaired t test (A and C) and two-way ANOVA (E–G, L–O, and Q). See also Figure S9.

Update of

References

    1. Ouellet V, Labbé SM, Blondin DP, Phoenix S, Guérin B, Haman F, Turcotte EE, Richard D, and Carpentier AC (2012). Brown adipose tissue oxidative metabolism contributes to energy expenditure during acute cold exposure in humans. J. Clin. Invest 122, 545–552. 10.1172/JCI60433. - DOI - PMC - PubMed
    1. Yoneshiro T, Aita S, Matsushita M, Kayahara T, Kameya T, Kawai Y, Iwanaga T, and Saito M (2013). Recruited brown adipose tissue as an antiobesity agent in humans. J. Clin. Invest 123, 3404–3408. 10.1172/JCI67803. - DOI - PMC - PubMed
    1. Becher T, Palanisamy S, Kramer DJ, Eljalby M, Marx SJ, Wibmer AG, Butler SD, Jiang CS, Vaughan R, Schöder H, et al. (2021). Brown adipose tissue is associated with cardiometabolic health. Nat. Med 27, 58–65. 10.1038/s41591-020-1126-7. - DOI - PMC - PubMed
    1. Shamsi F, Wang CH, and Tseng YH (2021). The evolving view of thermogenic adipocytes - ontogeny, niche and function. Nat. Rev. Endocrinol 17, 726–744. 10.1038/s41574-021-00562-6. - DOI - PMC - PubMed
    1. Cypess AM (2022). Reassessing human adipose tissue. N. Engl. J. Med 386, 768–779. 10.1056/NEJMra2032804. - DOI - PubMed

MeSH terms